Showing posts with label Markets During Intervention. Show all posts

Saturday, July 13, 2024

Markets During Periods Of Federal Reserve Intervention – July 13, 2024

In the August 9, 2011 post (“QE3 – Various Thoughts“) I posted a chart that depicted the movements of the S&P500, 10-Year Treasury Yield and the Fed Funds rate spanning the periods of various Federal Reserve interventions since 2007.

For reference purposes, here is an updated chart (through July 12, 2024) from the Advisor Perspectives’ site post of July 12, 2024 (“Treasury Yields Snapshot: July 12, 2024“):

S&P500 And Federal Reserve Intervention

_____

The Special Note summarizes my overall thoughts about our economic situation

SPX at 5615.35 as this post is written

Sunday, December 3, 2023

Markets During Periods Of Federal Reserve Intervention – December 3, 2023

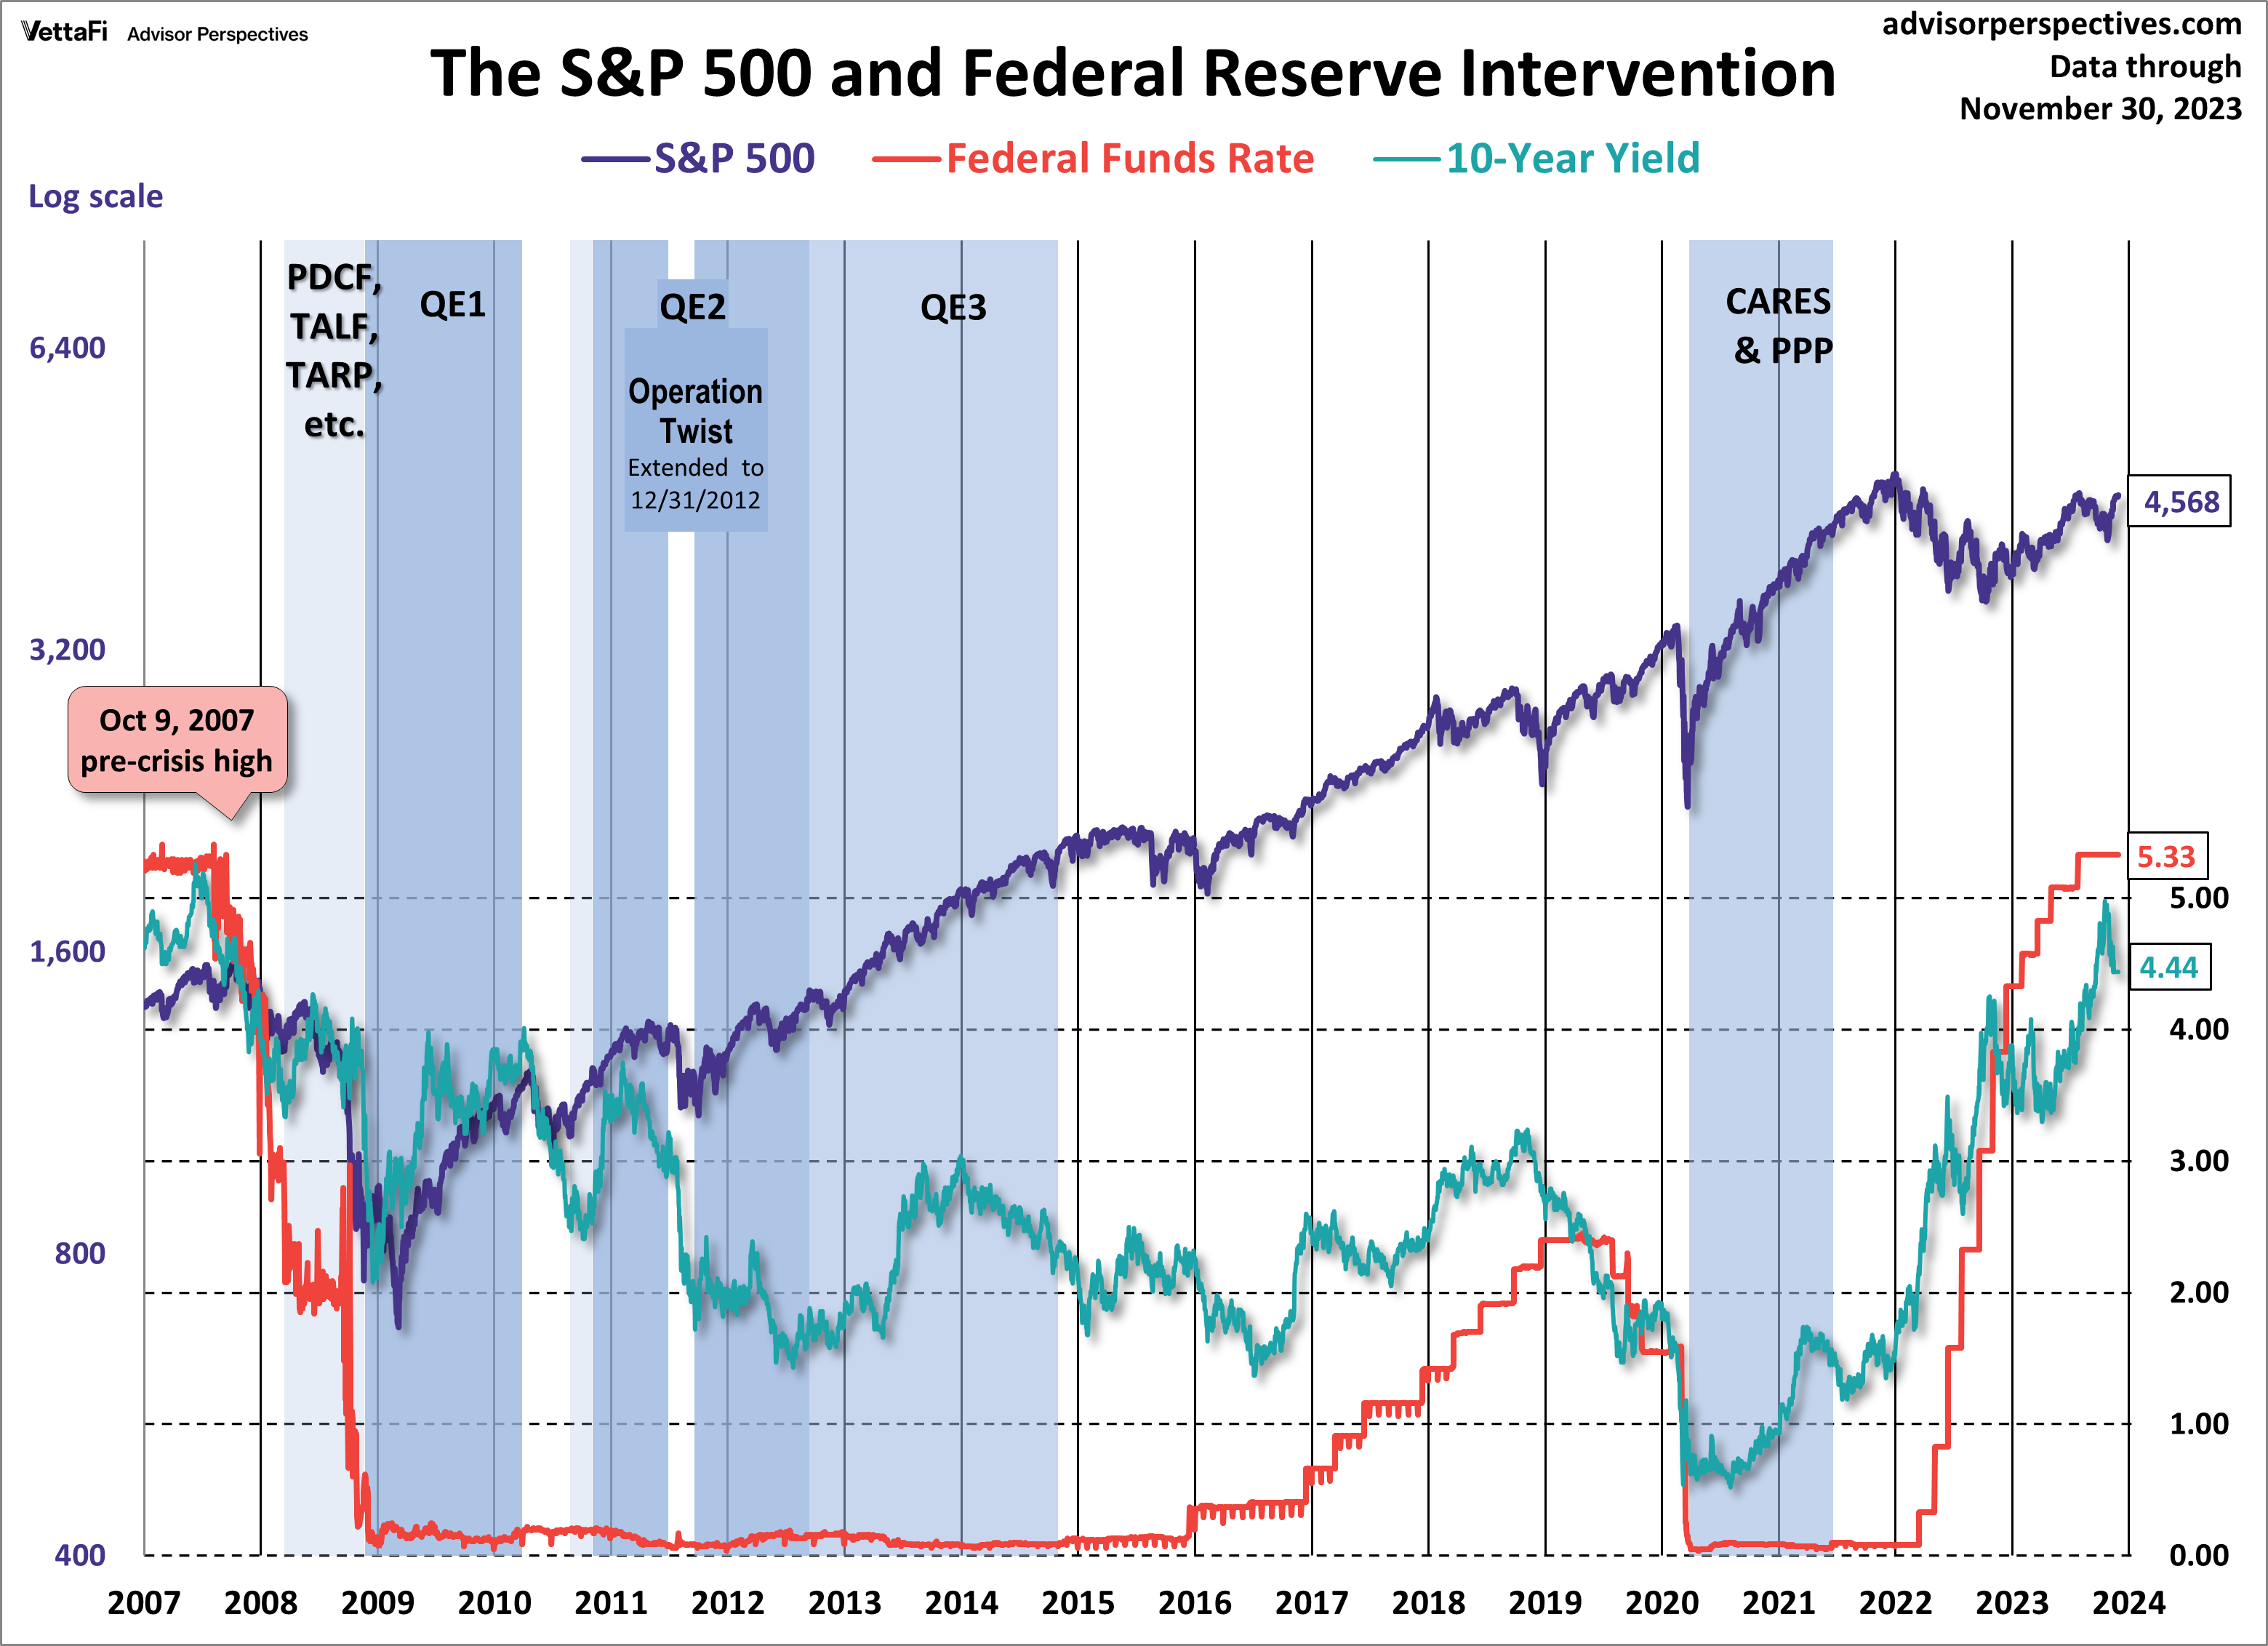
In the August 9, 2011 post (“QE3 – Various Thoughts“) I posted a chart that depicted the movements of the S&P500, 10-Year Treasury Yield and the Fed Funds rate spanning the periods of various Federal Reserve interventions since 2007.

For reference purposes, here is an updated chart (through November 30, 2023) from the Advisor Perspectives’ site post of December 1, 2023 (“Treasury Yields: A Long-Term Perspective“):

The S&P500 and Federal Reserve Intervention

_____

The Special Note summarizes my overall thoughts about our economic situation

SPX at 4594.63 as this post is written

Monday, July 3, 2023

Markets During Periods Of Federal Reserve Intervention – July 3, 2023

In the August 9, 2011 post (“QE3 – Various Thoughts“) I posted a chart that depicted the movements of the S&P500, 10-Year Treasury Yield and the Fed Funds rate spanning the periods of various Federal Reserve interventions since 2007.

For reference purposes, here is an updated chart (through June 30, 2023) from the Advisor Perspectives’ site post of June 30, 2023 (“Treasury Yields Snapshot…“):

The S&P500 and Federal Reserve Intervention

_____

The Special Note summarizes my overall thoughts about our economic situation

SPX at 4450.38 as this post is written

Monday, March 20, 2023

Markets During Periods Of Federal Reserve Intervention – March 20, 2023

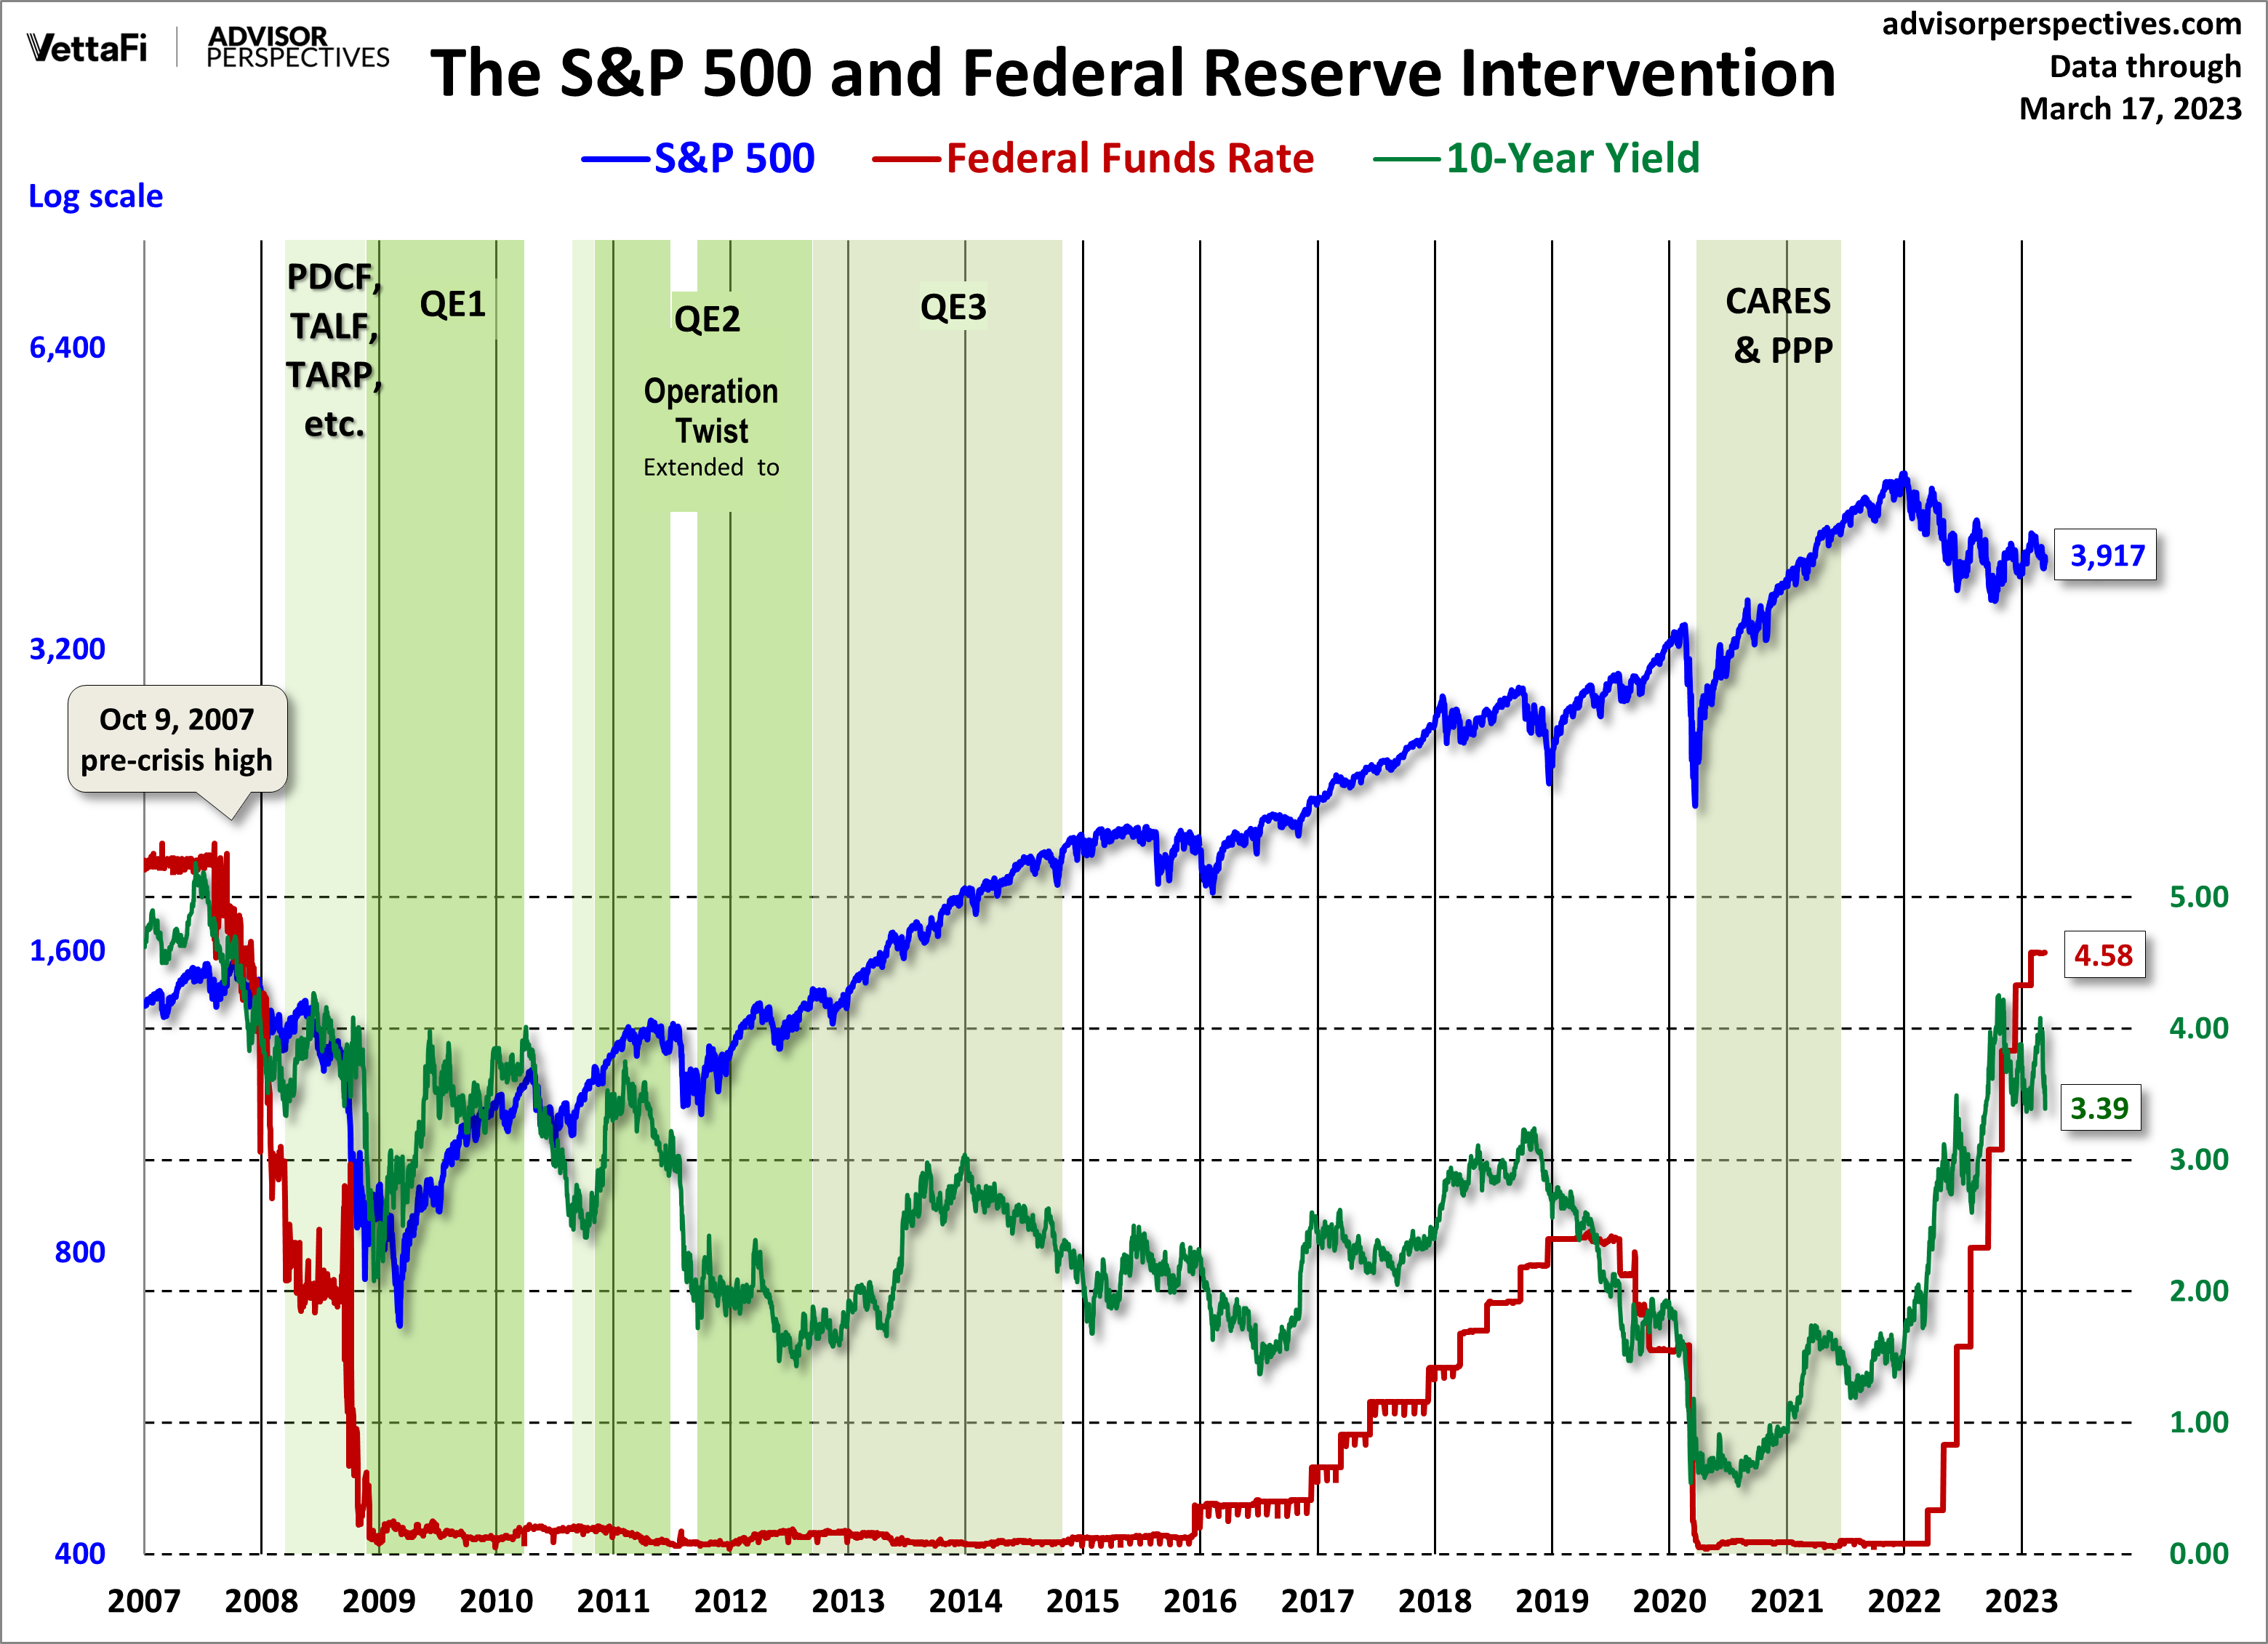
In the August 9, 2011 post (“QE3 – Various Thoughts“) I posted a chart that depicted the movements of the S&P500, 10-Year Treasury Yield and the Fed Funds rate spanning the periods of various Federal Reserve interventions since 2007.

For reference purposes, here is an updated chart (through March 17, 2023) from the Advisor Perspectives’ site post of March 17, 2023 (“Treasury Snapshot…“):

S&P500 During Federal Reserve Intervention

_____

The Special Note summarizes my overall thoughts about our economic situation

SPX at 3934.53 as this post is written

Sunday, December 4, 2022

Markets During Periods Of Federal Reserve Intervention – December 4, 2022

In the August 9, 2011 post (“QE3 – Various Thoughts“) I posted a chart that depicted the movements of the S&P500, 10-Year Treasury Yield and the Fed Funds rate spanning the periods of various Federal Reserve interventions since 2007.

For reference purposes, here is an updated chart (through December 2, 2022) from the Advisor Perspectives’ site post of December 2, 2022 (“Treasury Snapshot…“):

S&P500 and Federal Reserve Intervention

_____

The Special Note summarizes my overall thoughts about our economic situation

SPX at 4071.70 as this post is written

Friday, September 23, 2022

Markets During Periods Of Federal Reserve Intervention – September 23, 2022

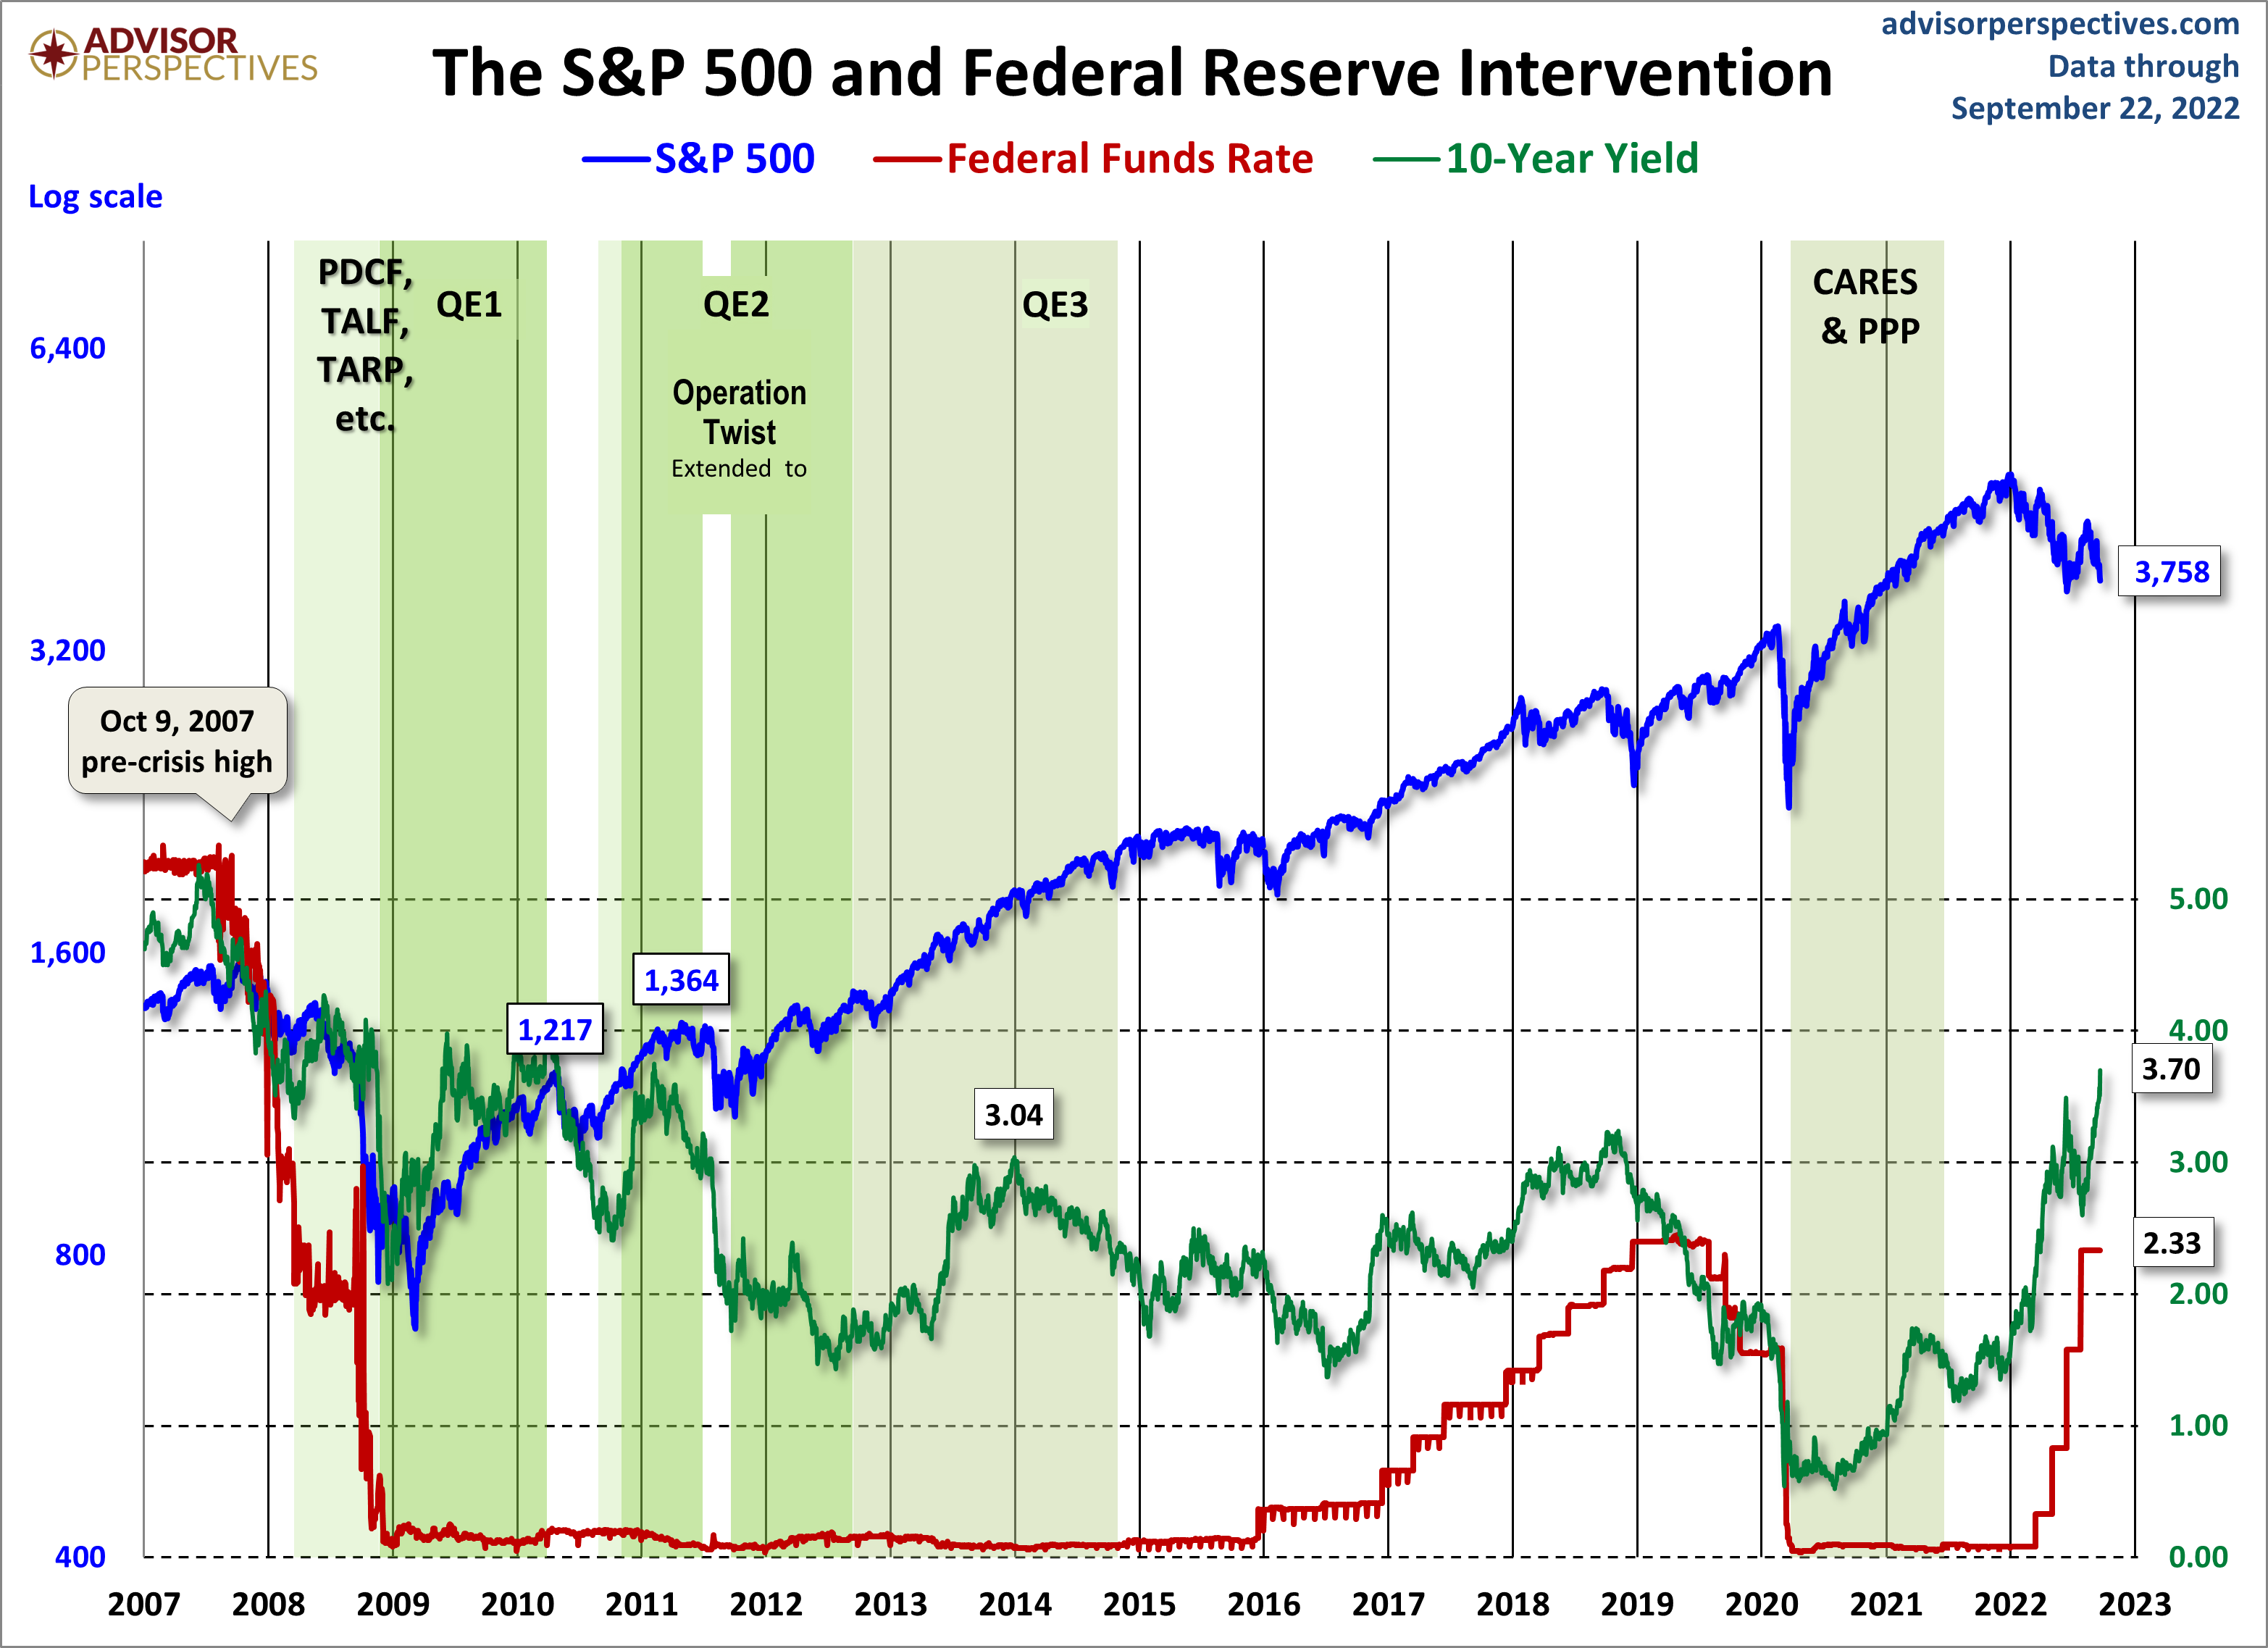
In the August 9, 2011 post (“QE3 – Various Thoughts“) I posted a chart that depicted the movements of the S&P500, 10-Year Treasury Yield and the Fed Funds rate spanning the periods of various Federal Reserve interventions since 2007.

For reference purposes, here is an updated chart (September 22, 2022) from the Advisor Perspectives’ site post of September 22, 2022 (“Treasury Snapshot…):

The S&P500 and Federal Reserve Intervention

_____

The Special Note summarizes my overall thoughts about our economic situation

SPX at 3670.48 as this post is written

Monday, April 11, 2022

Markets During Periods Of Federal Reserve Intervention – April 8, 2022 Update

In the August 9, 2011 post (“QE3 – Various Thoughts“) I posted a chart that depicted the movements of the S&P500, 10-Year Treasury Yield and the Fed Funds rate spanning the periods of various Federal Reserve interventions since 2007.

For reference purposes, here is an updated chart (April 8, 2022) from the Advisor Perspectives’ site post of April 8, 2022 (“Treasury Snapshot…):

The S&P500 and Federal Reserve Intervention

_____

The Special Note summarizes my overall thoughts about our economic situation

SPX at 4488.28 as this post is written

Friday, December 10, 2021

Markets During Periods Of Federal Reserve Intervention – December 9, 2021 Update

In the August 9, 2011 post (“QE3 – Various Thoughts“) I posted a chart that depicted the movements of the S&P500, 10-Year Treasury Yield and the Fed Funds rate spanning the periods of various Federal Reserve interventions since 2007.

For reference purposes, here is an updated chart (December 9, 2021) from the Advisor Perspectives’ site post of December 9, 2021 (“Treasury Yields – A Long-Term Perspective“):

Markets During Federal Reserve Intervention

_____

The Special Note summarizes my overall thoughts about our economic situation

SPX at 4667.45 as this post is written
Monday, August 9, 2021

Markets During Periods Of Federal Reserve Intervention – August 9, 2021 Update

In the August 9, 2011 post (“QE3 – Various Thoughts“) I posted a chart that depicted the movements of the S&P500, 10-Year Treasury Yield and the Fed Funds rate spanning the periods of various Federal Reserve interventions since 2007.

For reference purposes, here is an updated chart (August 6, 2021) from the Advisor Perspectives’ site post of August 6, 2021 (“Treasury Snapshot – 10-Year Note at 1.31%“):

The S&P500 during various periods of Federal Reserve intervention efforts

_____

The Special Note summarizes my overall thoughts about our economic situation

SPX at 4433.13 as this post is written
Monday, December 21, 2020

Markets During Periods Of Federal Reserve Intervention – December 21, 2020 Update

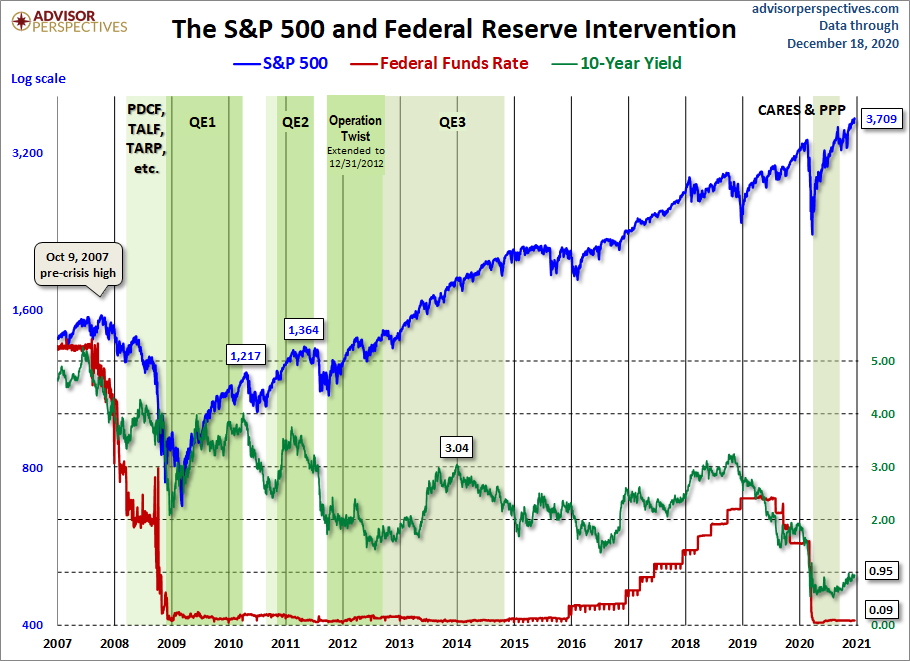
In the August 9, 2011 post (“QE3 – Various Thoughts“) I posted a chart that depicted the movements of the S&P500, 10-Year Treasury Yield and the Fed Funds rate spanning the periods of various Federal Reserve interventions since 2007.

For reference purposes, here is an updated chart (through December 18, 2020) from the Advisor Perspectives’ site post of December 18, 2020 (“Treasury Snapshot – 10-Year Note at .95%“):

S&P500, Fed Funds Rate and 10-Year Treasury during intervention

_____

The Special Note summarizes my overall thoughts about our economic situation

SPX at 3709.41 as this post is written
Thursday, September 3, 2020

Markets During Periods Of Federal Reserve Intervention – September 3, 2020 Update

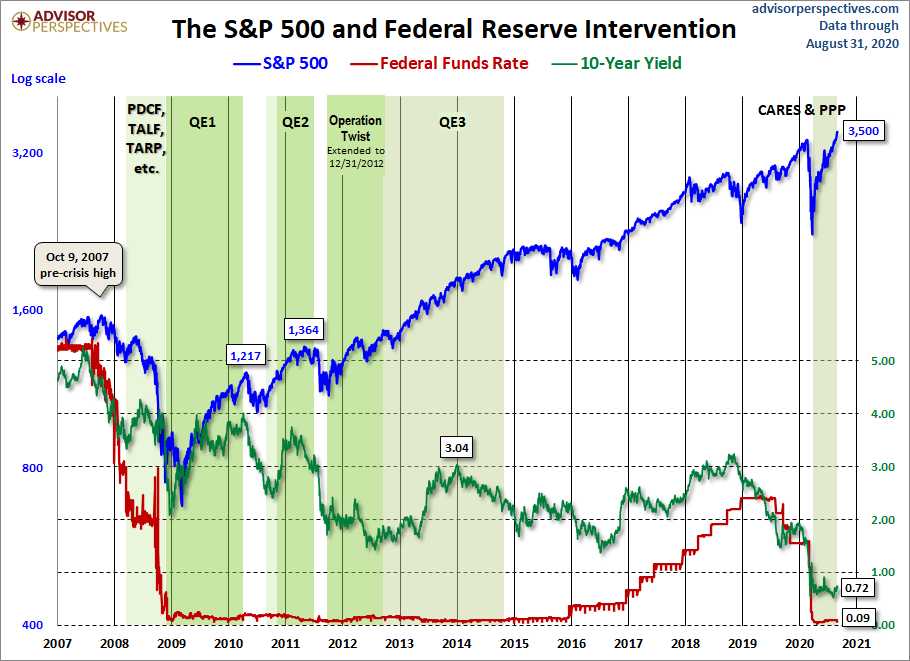
In the August 9, 2011 post (“QE3 – Various Thoughts“) I posted a chart that depicted the movements of the S&P500, 10-Year Treasury Yield and the Fed Funds rate spanning the periods of various Federal Reserve interventions since 2007.

For reference purposes, here is an updated chart (through August 28, 2020) from the Advisor Perspectives’ site post of September 1, 2020 (“Treasury Yields – A Long-Term Perspective“):

Markets During Federal Reserve Intervention

_____

The Special Note summarizes my overall thoughts about our economic situation

SPX at 3555.68 as this post is written
Saturday, February 29, 2020

Markets During Periods Of Federal Reserve Intervention – February 29, 2020 Update

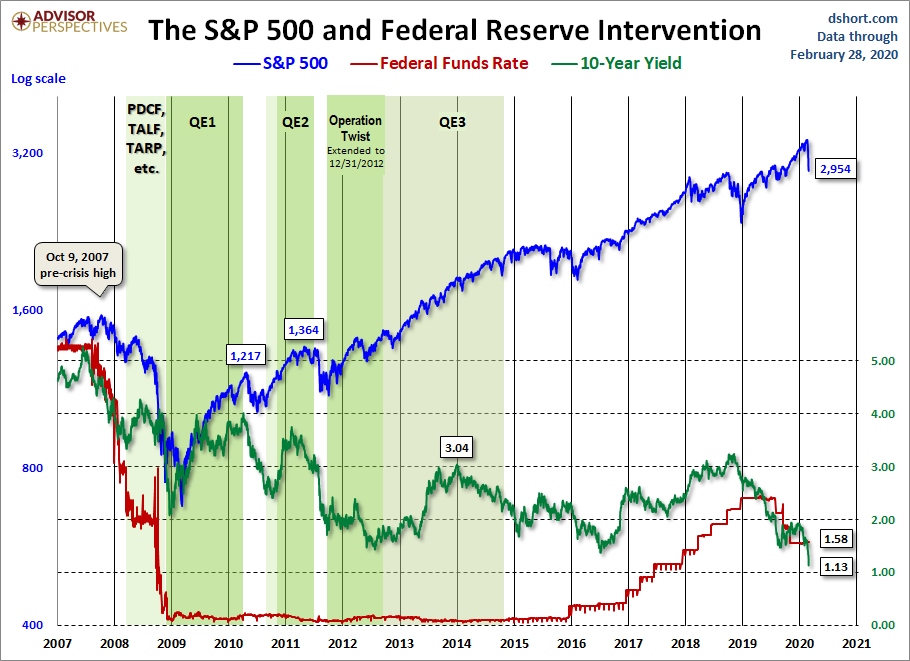
In the August 9, 2011 post (“QE3 – Various Thoughts“) I posted a chart that depicted the movements of the S&P500, 10-Year Treasury Yield and the Fed Funds rate spanning the periods of various Federal Reserve interventions since 2007.
For reference purposes, here is an updated chart (through February 28, 2020) from the Doug Short site post of February 28 (“Treasury Snapshot:  10-Year Note at 1.13%“):

The S&P500 and Federal Reserve Intervention

_____
The Special Note summarizes my overall thoughts about our economic situation
SPX at 2954.22 as this post is written
Wednesday, October 2, 2019

Markets During Periods Of Federal Reserve Intervention – October 1, 2019 Update

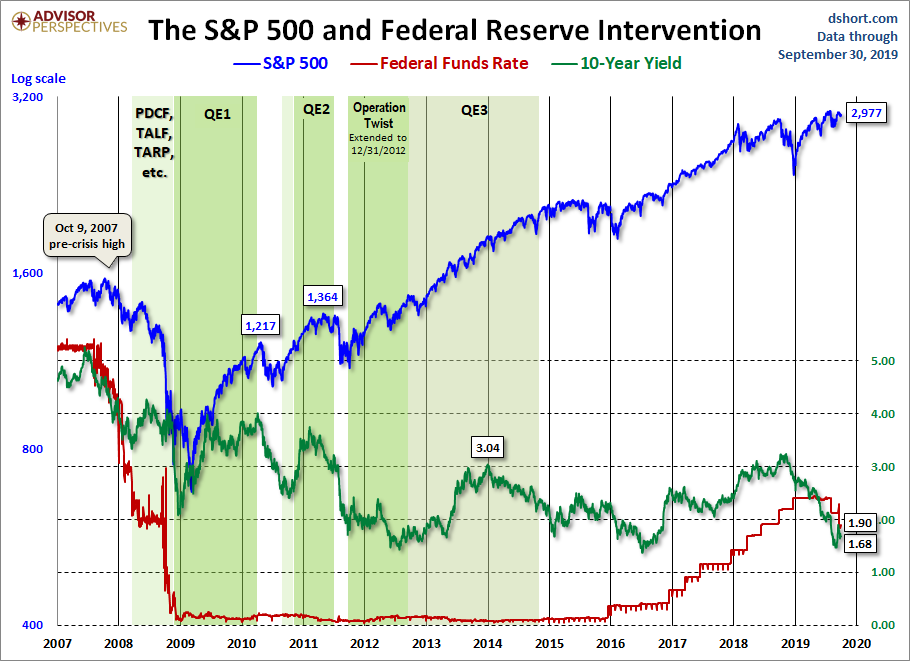
In the August 9, 2011 post (“QE3 – Various Thoughts“) I posted a chart that depicted the movements of the S&P500, 10-Year Treasury Yield and the Fed Funds rate spanning the periods of various Federal Reserve interventions since 2007.
For reference purposes, here is an updated chart (through September 30, 2019) from the Doug Short site post of October 1 (“Treasury Yields:  A Long-Term Perspective“):
The S&P500 during periods of Federal Reserve intervention
_____
The Special Note summarizes my overall thoughts about our economic situation
SPX at 2940.25 as this post is written
Wednesday, July 3, 2019

Markets During Periods Of Federal Reserve Intervention – June 28, 2019 Update

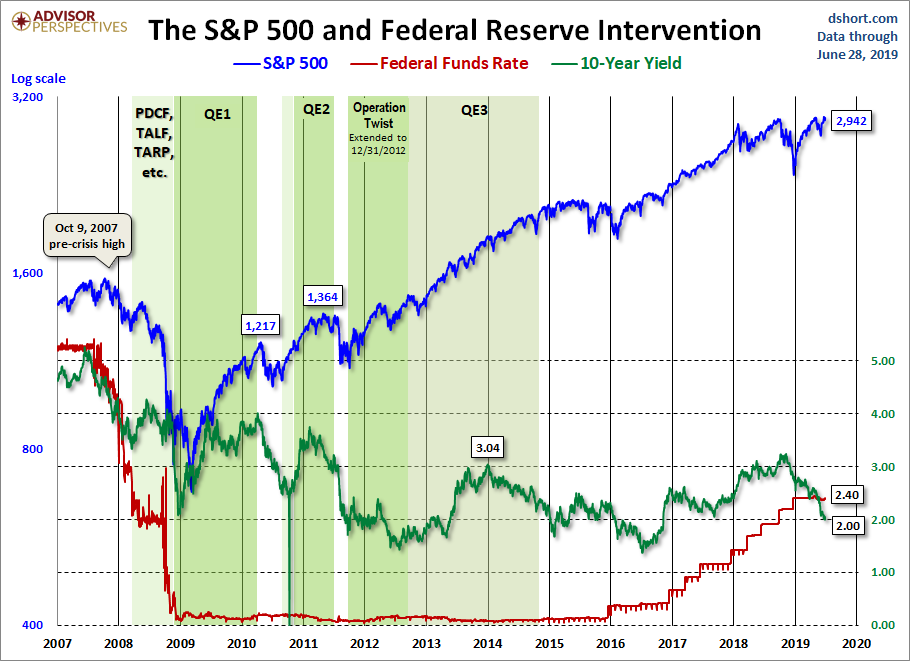
In the August 9, 2011 post (“QE3 – Various Thoughts“) I posted a chart that depicted the movements of the S&P500, 10-Year Treasury Yield and the Fed Funds rate spanning the periods of various Federal Reserve interventions since 2007.
For reference purposes, here is an updated chart (through June 28, 2019) from the Doug Short site post of July 2 (“Treasury Yields:  A Long-Term Perspective“):

Markets During Federal Reserve Intervention

_____
The Special Note summarizes my overall thoughts about our economic situation
SPX at 2973.01 as this post is written
Tuesday, February 19, 2019

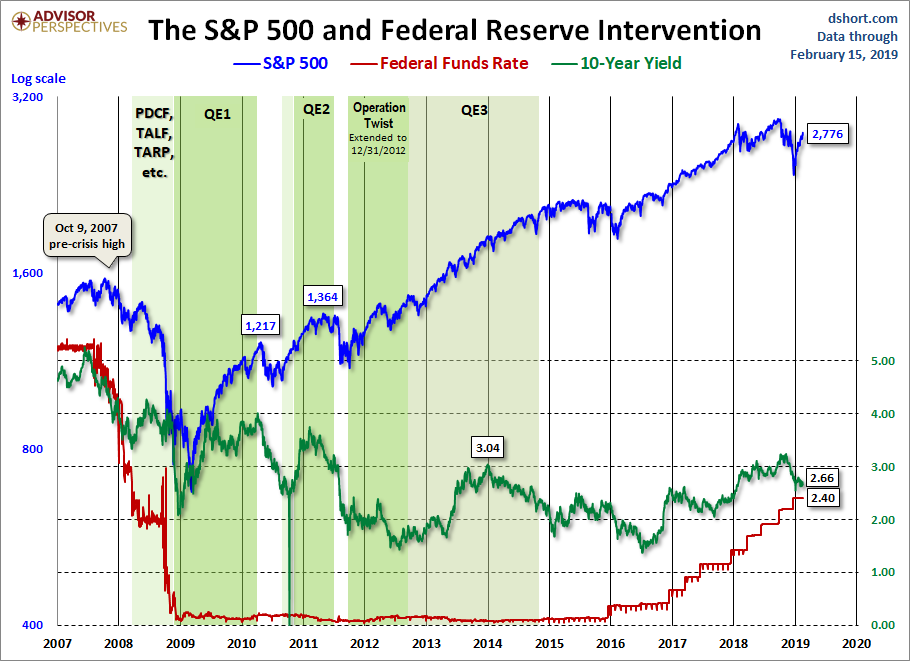
Markets During Periods Of Federal Reserve Intervention – February 15, 2019 Update

In the August 9, 2011 post (“QE3 – Various Thoughts“) I posted a chart that depicted the movements of the S&P500, 10-Year Treasury Yield and the Fed Funds rate spanning the periods of various Federal Reserve interventions since 2007.
For reference purposes, here is an updated chart (through February 15, 2019) from the Doug Short site post of February 15 (“Treasury Snapshot:  10-Year Yield at 2.66%“):
markets during Federal Reserve intervention
_____
The Special Note summarizes my overall thoughts about our economic situation
SPX at 2775.60 as this post is written

Wednesday, November 7, 2018

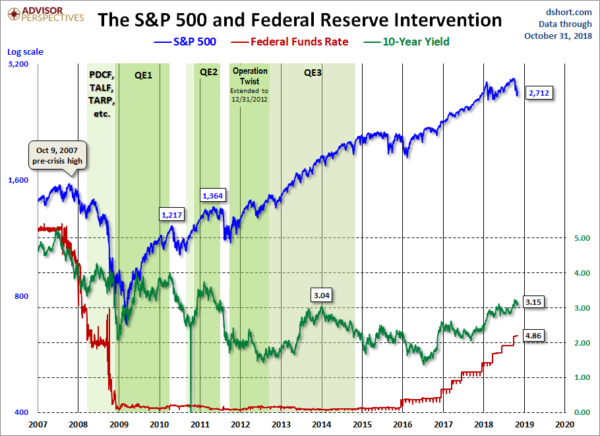
Markets During Periods Of Federal Reserve Intervention – October 31, 2018 Update

In the August 9, 2011 post (“QE3 – Various Thoughts“) I posted a chart that depicted the movements of the S&P500, 10-Year Treasury Yield and the Fed Funds rate spanning the periods of various Federal Reserve interventions since 2007.
For reference purposes, here is an updated chart (through October 31, 2018) from the Doug Short site post of November 6 (“Treasury Yields:  A Long-Term Perspective“):
S&P500 during Federal Reserve Intervention
_____
The Special Note summarizes my overall thoughts about our economic situation
SPX at 2778.97 as this post is written

Monday, June 18, 2018

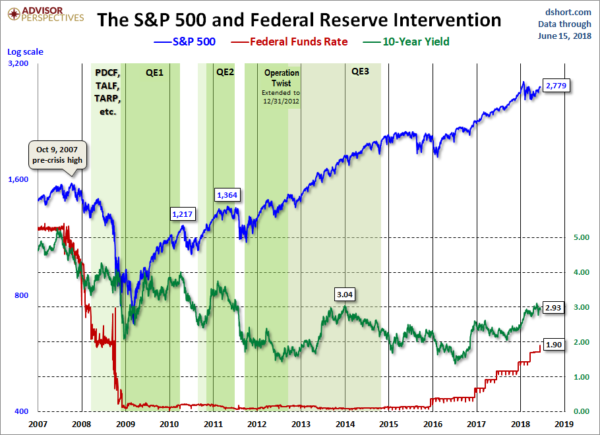
Markets During Periods Of Federal Reserve Intervention – June 15, 2018 Update

In the August 9, 2011 post (“QE3 – Various Thoughts“) I posted a chart that depicted the movements of the S&P500, 10-Year Treasury Yield and the Fed Funds rate spanning the periods of various Federal Reserve interventions since 2007.
For reference purposes, here is an updated chart (through June 15, 2018) from the Doug Short site post of June 15 (“Treasury Snapshot:  10-Year Remains at 2.93%“):
The S&P500 during Federal Reserve intervention
_____
The Special Note summarizes my overall thoughts about our economic situation
SPX at 2779.66 as this post is written

Thursday, February 1, 2018

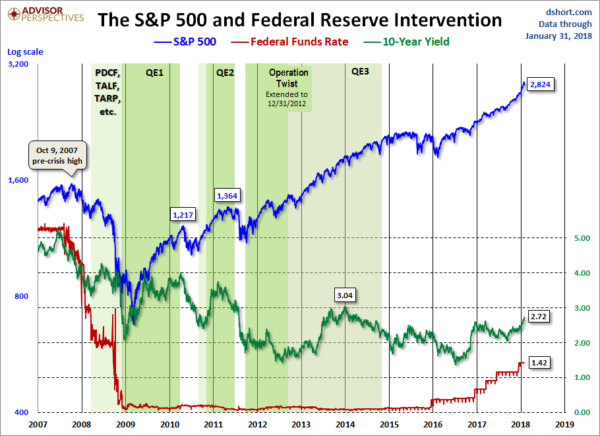
Markets During Periods Of Federal Reserve Intervention – January 31, 2018 Update

In the August 9, 2011 post (“QE3 – Various Thoughts“) I posted a chart that depicted the movements of the S&P500, 10-Year Treasury Yield and the Fed Funds rate spanning the periods of various Federal Reserve interventions since 2007.
For reference purposes, here is an updated chart (through January 31, 2018) from Doug Short’s blog post of January 31 (“Treasury Snapshot:  10-Year Yield at 2.72%“):
Periods Of Federal Reserve Intervention
_____
The Special Note summarizes my overall thoughts about our economic situation
SPX at 2823.81 as this post is written

Wednesday, July 12, 2017

Markets During Periods Of Federal Reserve Intervention – July 12, 2017 Update

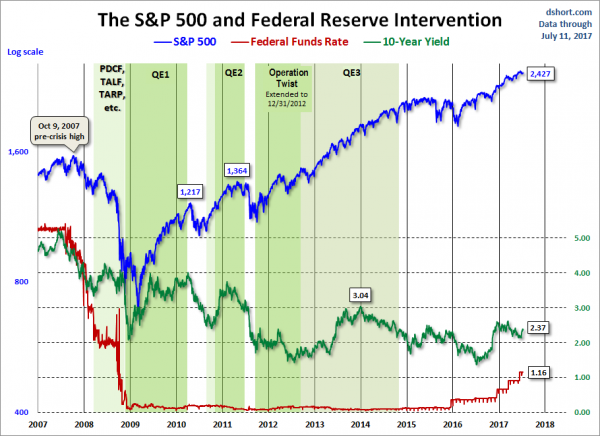
In the August 9, 2011 post (“QE3 – Various Thoughts“) I posted a chart that depicted the movements of the S&P500, 10-Year Treasury Yield and the Fed Funds rate spanning the periods of various Federal Reserve interventions since 2007.

For reference purposes, here is an updated chart (through July 11, 2017) from Doug Short’s blog post of July 12 (“Treasury Yields:  A Long-Term Perspective“):

The SandP500 and Federal Reserve Intervention

_____

The Special Note summarizes my overall thoughts about our economic situation

SPX at 2443.25 as this post is written

Tuesday, May 9, 2017

Markets During Periods Of Federal Reserve Intervention – May 8, 2017 Update

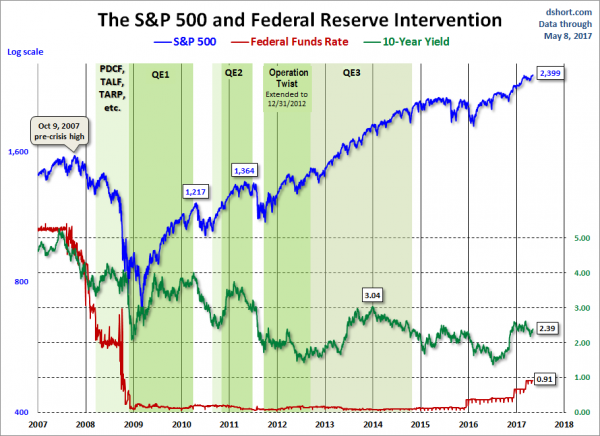
In the August 9, 2011 post (“QE3 – Various Thoughts“) I posted a chart that depicted the movements of the S&P500, 10-Year Treasury Yield and the Fed Funds rate spanning the periods of various Federal Reserve interventions since 2007.
For reference purposes, here is an updated chart (through May 8, 2017) from Doug Short’s blog post of May 8 (“Treasury Snapshot:  Possible Reversal Continues“):
S&P500 and Federal Reserve Intervention
_____
The Special Note summarizes my overall thoughts about our economic situation
SPX at 2402.25 as this post is written