Showing posts with label VIX. Show all posts

Monday, December 1, 2025

VIX Charts Since The Year 2000 – December 1, 2025 Update

For reference purposes, below are two charts of the VIX from year 2000 through the December 1, 2025 close, which had a value of 17.24.

Here is the VIX Weekly chart, depicted on a LOG scale, with the 13- and 34-week moving averages, seen in the cyan and red lines, respectively:

(click on chart to enlarge image)(chart courtesy of StockCharts.com; chart creation and annotation by the author)

VIX Weekly

–

Here is the VIX Monthly chart, depicted on a LOG scale, with the 13- and 34-month moving average, seen in the cyan and red lines, respectively:

(click on chart to enlarge image)(chart courtesy of StockCharts.com; chart creation and annotation by the author)

VIX Monthly

____

The Special Note summarizes my overall thoughts about our economic situation

SPX at 6812.63 as this post is written

Tuesday, November 4, 2025

VIX Charts Since The Year 2000 – November 4, 2025 Update

For reference purposes, below are two charts of the VIX from year 2000 through the November 3, 2025 close, which had a value of 17.17.

Here is the VIX Weekly chart, depicted on a LOG scale, with the 13- and 34-week moving averages, seen in the cyan and red lines, respectively:

(click on chart to enlarge image)(chart courtesy of StockCharts.com; chart creation and annotation by the author)

VIX Weekly chart

–

Here is the VIX Monthly chart, depicted on a LOG scale, with the 13- and 34-month moving average, seen in the cyan and red lines, respectively:

(click on chart to enlarge image)(chart courtesy of StockCharts.com; chart creation and annotation by the author)

VIX Monthly chart

____

The Special Note summarizes my overall thoughts about our economic situation

SPX at 6851.97 as this post is written

Wednesday, October 1, 2025

VIX Charts Since The Year 2000 – October 1, 2025 Update

For reference purposes, below are two charts of the VIX from year 2000 through the October 1, 2025 close, which had a value of 16.29.

Here is the VIX Weekly chart, depicted on a LOG scale, with the 13- and 34-week moving averages, seen in the cyan and red lines, respectively:

(click on chart to enlarge image)(chart courtesy of StockCharts.com; chart creation and annotation by the author)

VIX Weekly 16.29

–

Here is the VIX Monthly chart, depicted on a LOG scale, with the 13- and 34-month moving average, seen in the cyan and red lines, respectively:

(click on chart to enlarge image)(chart courtesy of StockCharts.com; chart creation and annotation by the author)

VIX Monthly 16.29

____

The Special Note summarizes my overall thoughts about our economic situation

SPX at 6711.20 as this post is written

Tuesday, September 2, 2025

VIX Charts Since The Year 2000 – September 2, 2025 Update

For reference purposes, below are two charts of the VIX from year 2000 through the September 2, 2025 close, which had a value of 17.17.

Here is the VIX Weekly chart, depicted on a LOG scale, with the 13- and 34-week moving averages, seen in the cyan and red lines, respectively:

(click on chart to enlarge image)(chart courtesy of StockCharts.com; chart creation and annotation by the author)

VIX Weekly LOG 17.17

–

Here is the VIX Monthly chart, depicted on a LOG scale, with the 13- and 34-month moving average, seen in the cyan and red lines, respectively:

(click on chart to enlarge image)(chart courtesy of StockCharts.com; chart creation and annotation by the author)

VIX Monthly LOG 17.17

____

The Special Note summarizes my overall thoughts about our economic situation

SPX at 6415.54 as this post is written

Sunday, August 3, 2025

VIX Charts Since The Year 2000 – August 3, 2025 Update

For reference purposes, below are two charts of the VIX from year 2000 through the August 1, 2025 close, which had a value of 20.38.

Here is the VIX Weekly chart, depicted on a LOG scale, with the 13- and 34-week moving averages, seen in the cyan and red lines, respectively:

(click on chart to enlarge image)(chart courtesy of StockCharts.com; chart creation and annotation by the author)

VIX Weekly 20.38

–

Here is the VIX Monthly chart, depicted on a LOG scale, with the 13- and 34-month moving average, seen in the cyan and red lines, respectively:

(click on chart to enlarge image)(chart courtesy of StockCharts.com; chart creation and annotation by the author)

VIX Monthly 20.38

____

The Special Note summarizes my overall thoughts about our economic situation

SPX at 6238.01 as this post is written

Wednesday, July 2, 2025

VIX Charts Since The Year 2000 – July 2, 2025 Update

For reference purposes, below are two charts of the VIX from year 2000 through the July 1, 2025 close, which had a value of 16.83.

Here is the VIX Weekly chart, depicted on a LOG scale, with the 13- and 34-week moving averages, seen in the cyan and red lines, respectively:

(click on chart to enlarge image)(chart courtesy of StockCharts.com; chart creation and annotation by the author)

VIX Weekly 16.83

–

Here is the VIX Monthly chart, depicted on a LOG scale, with the 13- and 34-month moving average, seen in the cyan and red lines, respectively:

(click on chart to enlarge image)(chart courtesy of StockCharts.com; chart creation and annotation by the author)

VIX Monthly 16.83

____

The Special Note summarizes my overall thoughts about our economic situation

SPX at 6198.01 as this post is written

Sunday, June 1, 2025

VIX Charts Since The Year 2000 – June 1, 2025 Update

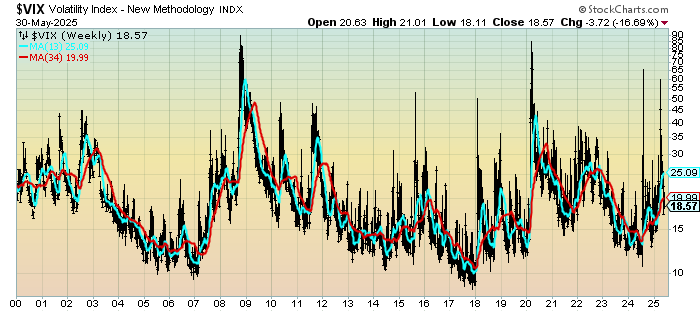
For reference purposes, below are two charts of the VIX from year 2000 through the May 30, 2025 close, which had a value of 18.57.

Here is the VIX Weekly chart, depicted on a LOG scale, with the 13- and 34-week moving averages, seen in the cyan and red lines, respectively:

(click on chart to enlarge image)(chart courtesy of StockCharts.com; chart creation and annotation by the author)

VIX Weekly 18.57

–

Here is the VIX Monthly chart, depicted on a LOG scale, with the 13- and 34-month moving average, seen in the cyan and red lines, respectively:

(click on chart to enlarge image)(chart courtesy of StockCharts.com; chart creation and annotation by the author)

VIX Monthly 18.57

____

The Special Note summarizes my overall thoughts about our economic situation

SPX at 5911.69 as this post is written

Sunday, May 4, 2025

VIX Charts Since The Year 2000 – May 4, 2025 Update

For reference purposes, below are two charts of the VIX from year 2000 through the May 2, 2025 close, which had a value of 22.68.

Here is the VIX Weekly chart, depicted on a LOG scale, with the 13- and 34-week moving averages, seen in the cyan and red lines, respectively:

(click on chart to enlarge image)(chart courtesy of StockCharts.com; chart creation and annotation by the author)

VIX Weekly LOG 22.68

–

Here is the VIX Monthly chart, depicted on a LOG scale, with the 13- and 34-month moving average, seen in the cyan and red lines, respectively:

(click on chart to enlarge image)(chart courtesy of StockCharts.com; chart creation and annotation by the author)

VIX Monthly LOG 22.68

____

The Special Note summarizes my overall thoughts about our economic situation

SPX at 5686.67 as this post is written

Sunday, March 2, 2025

VIX Charts Since The Year 2000 – March 2, 2025 Update

For reference purposes, below are two charts of the VIX from year 2000 through the February 28, 2025 close, which had a value of 19.63.

Here is the VIX Weekly chart, depicted on a LOG scale, with the 13- and 34-week moving averages, seen in the cyan and red lines, respectively:

(click on chart to enlarge image)(chart courtesy of StockCharts.com; chart creation and annotation by the author)

VIX Weekly 19.63

–

Here is the VIX Monthly chart, depicted on a LOG scale, with the 13- and 34-month moving average, seen in the cyan and red lines, respectively:

(click on chart to enlarge image)(chart courtesy of StockCharts.com; chart creation and annotation by the author)

VIX monthly 19.63

____

The Special Note summarizes my overall thoughts about our economic situation

SPX at 5954.50 as this post is written

Sunday, February 2, 2025

VIX Charts Since The Year 2000 – February 2, 2025 Update

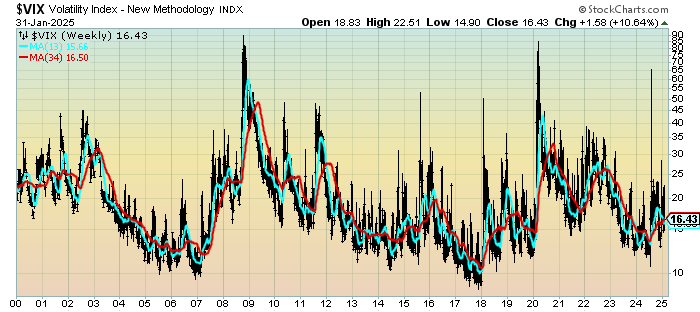
For reference purposes, below are two charts of the VIX from year 2000 through the January 31, 2025 close, which had a value of 16.43.

Here is the VIX Weekly chart, depicted on a LOG scale, with the 13- and 34-week moving averages, seen in the cyan and red lines, respectively:

(click on chart to enlarge image)(chart courtesy of StockCharts.com; chart creation and annotation by the author)

VIX Weekly

–

Here is the VIX Monthly chart, depicted on a LOG scale, with the 13- and 34-month moving average, seen in the cyan and red lines, respectively:

(click on chart to enlarge image)(chart courtesy of StockCharts.com; chart creation and annotation by the author)

VIX Monthly since 2000

____

The Special Note summarizes my overall thoughts about our economic situation

SPX at 6040.53 as this post is written

Friday, January 3, 2025

VIX Charts Since The Year 2000 – January 3, 2025 Update

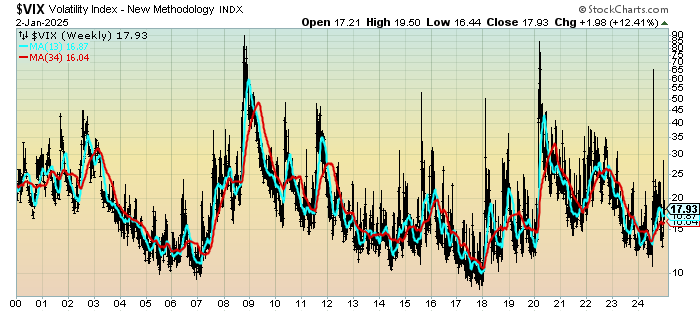
For reference purposes, below are two charts of the VIX from year 2000 through the January 2, 2025 close, which had a value of 17.93.

Here is the VIX Weekly chart, depicted on a LOG scale, with the 13- and 34-week moving averages, seen in the cyan and red lines, respectively:

(click on chart to enlarge image)(chart courtesy of StockCharts.com; chart creation and annotation by the author)

VIX Weekly 17.93

–

Here is the VIX Monthly chart, depicted on a LOG scale, with the 13- and 34-month moving average, seen in the cyan and red lines, respectively:

(click on chart to enlarge image)(chart courtesy of StockCharts.com; chart creation and annotation by the author)

VIX Monthly 17.93

____

The Special Note summarizes my overall thoughts about our economic situation

SPX at 5868.55 as this post is written

Sunday, December 1, 2024

VIX Charts Since The Year 2000 – December 1, 2024 Update

For reference purposes, below are two charts of the VIX from year 2000 through the November 29, 2024 close, which had a value of 13.51.

Here is the VIX Weekly chart, depicted on a LOG scale, with the 13- and 34-week moving averages, seen in the cyan and red lines, respectively:

(click on chart to enlarge image)(chart courtesy of StockCharts.com; chart creation and annotation by the author)

VIX chart since 2000

–

Here is the VIX Monthly chart, depicted on a LOG scale, with the 13- and 34-month moving average, seen in the cyan and red lines, respectively:

(click on chart to enlarge image)(chart courtesy of StockCharts.com; chart creation and annotation by the author)

VIX chart since 2000

____

The Special Note summarizes my overall thoughts about our economic situation

SPX at 6032.38 as this post is written

Monday, November 4, 2024

VIX Charts Since The Year 2000 – November 4, 2024 Update

For reference purposes, below are two charts of the VIX from year 2000 through the November 1, 2024 close, which had a value of 21.88.

Here is the VIX Weekly chart, depicted on a LOG scale, with the 13- and 34-week moving averages, seen in the cyan and red lines, respectively:

(click on chart to enlarge image)(chart courtesy of StockCharts.com; chart creation and annotation by the author)

VIX Weekly

–

Here is the VIX Monthly chart, depicted on a LOG scale, with the 13- and 34-month moving average, seen in the cyan and red lines, respectively:

(click on chart to enlarge image)(chart courtesy of StockCharts.com; chart creation and annotation by the author)

VIX Monthly

____

The Special Note summarizes my overall thoughts about our economic situation

SPX at 5728.80 as this post is written

Tuesday, October 1, 2024

VIX Charts Since The Year 2000 – October 1, 2024 Update

For reference purposes, below are two charts of the VIX from year 2000 through the September 30, 2024 close, which had a value of 16.73.

Here is the VIX Weekly chart, depicted on a LOG scale, with the 13- and 34-week moving averages, seen in the cyan and red lines, respectively:

(click on chart to enlarge image)(chart courtesy of StockCharts.com; chart creation and annotation by the author)

VIX Weekly chart 16.73

–

Here is the VIX Monthly chart, depicted on a LOG scale, with the 13- and 34-month moving average, seen in the cyan and red lines, respectively:

(click on chart to enlarge image)(chart courtesy of StockCharts.com; chart creation and annotation by the author)

VIX Monthly chart 16.73

____

The Special Note summarizes my overall thoughts about our economic situation

SPX at 5762.48 as this post is written
Tuesday, September 3, 2024

VIX Charts Since The Year 2000 – September 3, 2024 Update

For reference purposes, below are two charts of the VIX from year 2000 through the August 30, 2024 close, which had a value of 15.00.

Here is the VIX Weekly chart, depicted on a LOG scale, with the 13- and 34-week moving averages, seen in the cyan and red lines, respectively:

(click on chart to enlarge image)(chart courtesy of StockCharts.com; chart creation and annotation by the author)

VIX Weekly 15.00

–

Here is the VIX Monthly chart, depicted on a LOG scale, with the 13- and 34-month moving average, seen in the cyan and red lines, respectively:

(click on chart to enlarge image)(chart courtesy of StockCharts.com; chart creation and annotation by the author)

VIX Monthly 15.00

____

The Special Note summarizes my overall thoughts about our economic situation

SPX at 5648.40 as this post is written