Monday, October 10, 2011

Near-Term Direction Of Stock Market – October 10 Update


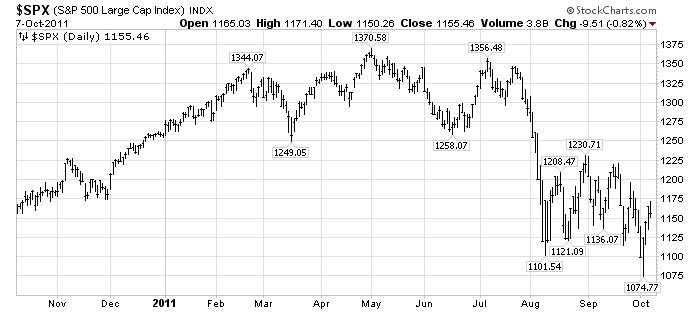
In my post of September 29 ("Near-Term Direction Of The Stock Market - Update") I had reiterated my view that the S&P500 would fall below the August 9 low of 1101.54.

It did fall below that 1101.54 level, reaching a bottom of 1074.77 on October 4.

The question now becomes whether that 1074.77 was a "lasting bottom," or whether there is more near-term downside.  I believe that the 1074.77 low will not be a "lasting bottom" - i.e. it will be breached to the downside in the near-term.

This may seem illogical to some, as we have seen a strong rebound from that 1075-level over the last few days.  Friday's close of 1155.46, as well as strong futures indications this morning, have led many to become bullish.

This strong rebound seems to me to be a strong "bounce" more than anything else.  I continue to believe what I wrote in the aforementioned September 29 post - "...the stock market “price action” feels very “unsettled” to me, and, as such,  I think the “danger” here is rather high."

There are many aspects of the financial and economic situation - many that I have recently written of - that lead me to believe this continues to be a dangerous situation.

Here is an updated chart of the S&P500, on a 1-year daily basis through 10-7-11 with price labels, for reference:

(click on chart to enlarge image)(chart courtesy of StockCharts.com)

_____

Since the S&P500 highs of early May and early July I have written a variety of posts warning of what I considered cautionary signs for the stock market.  Most of those posts can be found in the "stock market" category.
_____


The Special Note summarizes my overall thoughts about our economic situation


SPX at 1155.46 as this post is written

Sunday, October 9, 2011

U-3 And U-6 Unemployment Rate Long-Term Reference Charts


Shortly after each monthly employment report I have been posting a continual series titled "3 Critical Unemployment Charts."

Of course, there are many other employment charts that can be displayed as well.

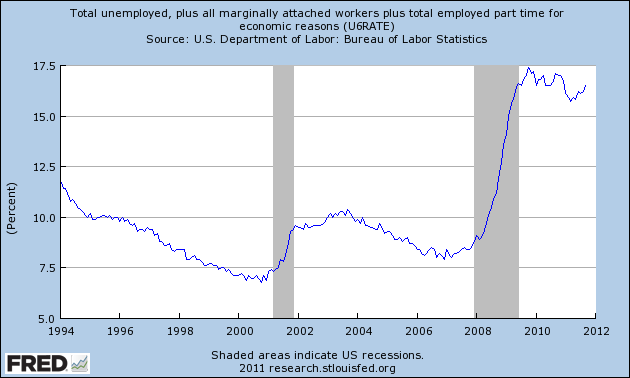
For reference purposes, below are the U-3 and U-6 Unemployment Rate charts from a long-term historical perspective.  Both charts are from the St. Louis Fed site.  The U-3 measure is what is commonly referred to as the official unemployment rate; whereas the U-6 rate is officially (per Bureau of Labor Statistics) defined as:
Total unemployed, plus all persons marginally attached to the labor force, plus total employed part time for economic reasons, as a percent of the civilian labor force plus all persons marginally attached to the labor force
Of note, many economic observers use the U-6 rate as a (closer) proxy of the actual unemployment rate rather than that depicted by the U-3 measure.

Here is the U-3 chart, showing a 9.1% unemployment rate:

(click on charts to enlarge images)(charts updated as of 10-7-11)


-

Here is the U-6 chart, showing a 16.5% unemployment rate:


_____

The Special Note summarizes my overall thoughts about our economic situation


SPX at 1155.46 as this post is written

3 Critical Unemployment Charts – October 2011


As I have commented previously, as in the October 6, 2009 post (“A Note About Unemployment Statistics”), in my opinion the official methodologies used to measure the various job loss and unemployment statistics do not provide an accurate depiction; they serve to understate the severity of unemployment.

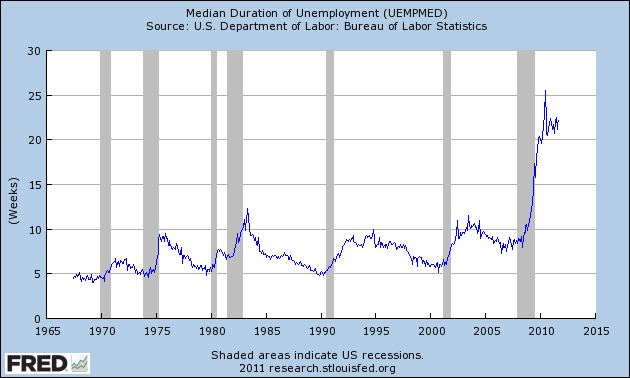
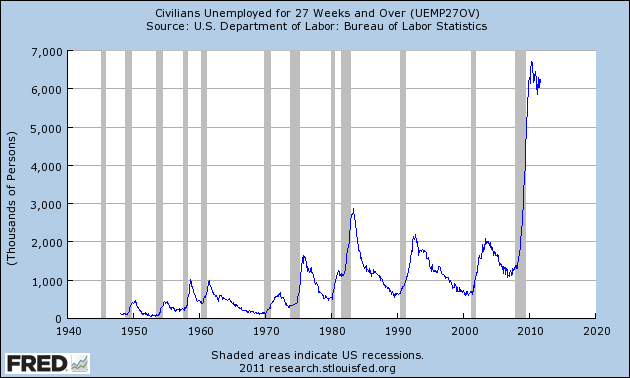
However, even if one chooses to look at the official statistics, the following charts provide an interesting (and disconcerting) long-term perspective of certain aspects of the officially-stated unemployment situation.

The first two charts are from the St. Louis Fed site.  Here is the Median Duration of Unemployment:

(click on charts to enlarge images)(charts updated as of 10-7-11)


-

Here is the chart for Unemployed 27 Weeks and Over:


-

Lastly, a chart from the CalculatedRisk.com site, from the October 7 post titled “September Unemployment Report…”  This shows the employment situation vs. that of previous recessions, as shown:


-

As depicted by these charts, our unemployment problem is severe.  Unfortunately, there do not appear to be any “easy” solutions.

In July 2009 I wrote a series of five blog posts titled “Why Aren’t Companies Hiring?”, which discusses various aspects of the topic, many of which lack recognition.
_____


The Special Note summarizes my overall thoughts about our economic situation


SPX at 1155.46 as this post is written

Friday, October 7, 2011

The Plight Of The Wealthy During Depressions


As seen in the September 15 post ("September 13 Gallup Poll On Upper-Income Americans' Economic Confidence") lately there appears to be a significant lessening of economic confidence among "upper-income" Americans; and, as seen in the poll, "This is the first month since the financial crisis of late 2008 and early 2009 that upper-income Americans are more pessimistic about the future direction of the U.S. economy than other Americans."

One question that may arise is how the wealthy and ultra-wealthy will be ultimately impacted in severe economic weakness, i.e. conditions most will label a Depression.  Of course, in the last 100 years or so, The Great Depression is the only episode of such an environment in the United States.  While to my knowledge there is no definitive study of loss of wealth among the most affluent during The Great Depression, it appears as if many of the wealthiest Americans during the period experienced a pronounced reduction in wealth.  Some, including the most wealthy and influential of the day, "lost everything."  One documentary of the period that illustrated this facet was "The Crash of 1929" that I highlighted in the July 8 post.

This current economic and investment environment is one in which large percentages of wealth can be quickly lost.  I base this statement on many factors, one being the existence of many asset bubbles, which I have written of extensively.

_____


The Special Note summarizes my overall thoughts about our economic situation


SPX at 1164.97 as this post is written

CEO & CFO Surveys 3Q 2011


On September 29 the Business Roundtable’s CEO Economic Outlook Survey was released for the 3rd quarter.  The September Duke/CFO Magazine Global Business Outlook Survey (pdf) was released on September 13.  Both contain a variety of statistics regarding how executives view business and economic conditions.

In the CEO survey, of particular interest is the CEO Economic Outlook Index, which decreased to 77.6 from 109.9 in the 2nd quarter.  Also stated in the report, "In terms of the overall U.S. economy, member CEOs estimate real GDP will grow by 1.8 percent in 2011, a decrease from the 2.8 percent projected in the second quarter of 2011." Also, as seen in the Press Release:
“The findings of this survey show declines in each category of economic measurement,” said Jim McNerney, Chairman of Business Roundtable and Chairman, President and CEO of The Boeing Company.  “While we see strong business fundamentals in America still, the quarterly survey results reflect increased uncertainty among CEOs concerning the economic climate and business environment.”
In the CFO Survey:
Chief financial officers don’t foresee a double-dip recession, but doubts about the strength of the economy have pessimists outnumbering optimists by more than five to one in the United States. Business spending is expected to grow, though more slowly than last quarter, and hiring will continue at a sluggish pace.
also:
Capital spending in the U.S. is expected to see solid growth of 4.5 percent, but that is about half the pace predicted last quarter. One-third of firms say they’ve slowed planned spending this year, citing economic uncertainty and funding constraints.
also:
Domestic U.S. employment is expected to rise about 1 percent in the next year, which would likely leave the unemployment rate stalled around 9 percent.
also:
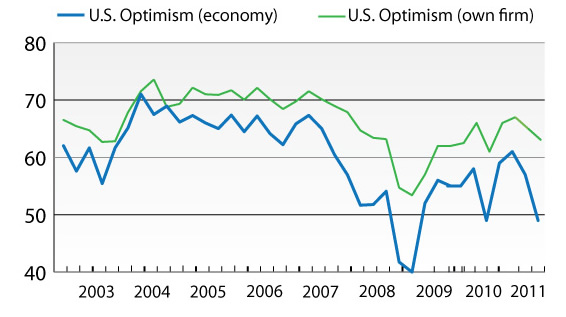
“This significant drop in optimism is being driven by a number of deep concerns: continued weak consumer demand, intense price pressure, and uncertainty about government policies and global financial instability,” said Kate O’Sullivan, deputy editor at CFO Magazine.
The CFO survey contains the Optimism Index chart, showing U.S. Optimism (with regard to the economy) at 49.4, as seen below:


It should be interesting to see how well the CEOs and CFOs predict business and economic conditions going forward.   I discussed various aspects of this, and the importance of these predictions, in the July 9 2010 post titled “The Business Environment”.

(past posts on CEO and CFO Surveys can be found under the “CFO and CEO Confidence” label)
_____

I post various economic forecasts because I believe they should be carefully monitored.  However, as those familiar with this blog are aware, I do not agree with many of the consensus estimates and much of the commentary in these forecast surveys.
_____


The Special Note summarizes my overall thoughts about our economic situation


SPX at 1164.97 as this post is written

Thursday, October 6, 2011

A Chart Of Recent S&P500 Price Volatility


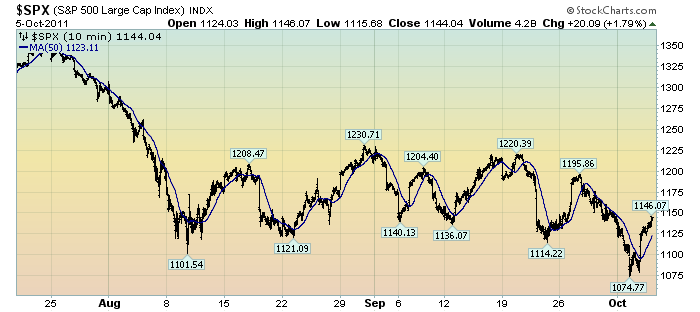
The following chart depicts the S&P500 in 10 minute intervals from July 20 through yesterday's close.  As such, it encompasses the progression of the stock market since its July 25 daily high of 1344.32:

(click on chart to enlarge image)(chart courtesy of StockCharts.com)


The blue line is a 50-period moving average.

What I find notable is the frequency and extent of the price volatility.  As one can see, there have been several episodes of advances and declines of roughly 80-100+ points in rapid fashion - some even happening over the course of a few days.

While there are various ways to interpret such volatility, my overall belief is that such is (yet another) cautionary sign.
_____


The Special Note summarizes my overall thoughts about our economic situation


SPX at 1144.04 as this post is written

Tuesday, October 4, 2011

U.S. Dollar Decline – October 2011 Update


U.S. Dollar weakness is a foremost concern of mine.  As such, I have extensively written about it.  I am very concerned that the actions being taken to “improve” our economic situation will dramatically weaken the Dollar.  Should the Dollar substantially decline from here, as I expect, the negative consequences will far outweigh any benefits.  The negative impact of a substantial Dollar decline can’t be overstated, in my opinion.

The following three charts illustrate various technical analysis aspects of the U.S. Dollar, as depicted by the U.S. Dollar Index.

First, a look at the monthly U.S. Dollar from 1983.  This clearly shows a long-term weakness, with the blue line showing technical support (until 2007):

(charts courtesy of StockCharts.com; annotations by the author)

(click on chart image to enlarge)


-

Next, another chart, this one focused on the daily U.S. Dollar since 2000 on a LOG scale.  The red line represents both a trendline as well as a relatively good visual “best-fit” line.  The gray dotted line is the 200-day M.A. (moving average).  As seen on this chart, the U.S. Dollar looks vulnerable to continuing its downward trend that has been interrupted since early 2008:


-

Lastly, a chart of the Dollar on a weekly LOG scale.  There are some clearly marked  channels here, with a large, prominent triangle featured.  Recently, this triangle formation has been breached to the upside.


-

I will be providing updates on this U.S. Dollar situation regularly as it deserves very close monitoring…
_____

The Special Note summarizes my overall thoughts about our economic situation


SPX at 1099.23 as this post is written

Monday, October 3, 2011

ECRI Recession Statement Of September 30 - Notable Excerpts


On September 30 ECRI released a statement titled "U.S. Economy Tipping Into Recession."

My thoughts on ECRI's work are complex.  While I don't necessarily agree with their comments in this September 30 statement, I do find the following excerpts to be especially notable:
Early last week, ECRI notified clients that the U.S. economy is indeed tipping into a new recession. And there’s nothing that policy makers can do to head it off.
also:
More than three years ago, before the Lehman debacle, we were already warning of a longstanding pattern of slowing growth: at least since the 1970s, the pace of U.S. growth – especially in GDP and jobs – has been stair-stepping down in successive economic expansions.
also:
It’s important to understand that recession doesn’t mean a bad economy – we’ve had that for years now. It means an economy that keeps worsening, because it’s locked into a vicious cycle.
also:
Here’s what ECRI’s recession call really says: if you think this is a bad economy, you haven’t seen anything yet.
_____


The Special Note summarizes my overall thoughts about our economic situation


SPX at 1131.42 as this post is written