Thursday, July 11, 2013

Broad-Based Indicators Of Economic Activity

The Chicago Fed National Activity Index (CFNAI) and the Aruoba-Diebold-Scotti Business Conditions Index (ADS Index) are two broad-based economic indicators that I regularly feature in this site.

The current levels of each are notable, as they are vacillating from a short-term perspective and their long-term trends continue to sink.

Doug Short, in his blog post of July 11, titled “The Philly Fed Business Conditions Index” displays both the CFNAI MA-3 (3-month Moving Average) and ADS Index (91-Day Moving Average) from a variety of perspectives.

Of particular note, two of the charts, shown below, denote where the current levels of each reading is relative to the beginning of past recessionary periods, as depicted by the red dots.

The CFNAI MA-3:

(click on charts to enlarge images)

Dshort 7-11-13 Chicago-Fed-CFNAI-recession-indicator

-

The ADS Index, 91-Day MA:

Dshort 7-11-13 ADS-index-91-day-MA

-

Also shown in the Doug Short’s aforementioned post is a chart of each with a long-term trendline (linear regression) as well as a chart depicting GDP for comparison purposes.

_________

I post various indicators and indices because I believe they should be carefully monitored.  However, as those familiar with this blog are aware, I do not necessarily agree with what they depict or imply.
_____

The Special Note summarizes my overall thoughts about our economic situation

SPX at 1673.38 as this post is written

CEO Confidence Surveys 2Q 2013 – Notable Excerpts

Today (July 11), The Conference Board released its 2nd Quarter CEO Confidence Survey.   The overall measure of CEO Confidence was at 62, up from 54 in the first quarter. [note:  a reading of more than 50 points reflects more positive than negative responses]

Notable excerpts from this July 11 Press Release include:
CEOs’ appraisal of current economic conditions improved dramatically. Now, 60 percent are claiming conditions are better compared to six months ago, up from 36 percent in the first quarter. Business leaders are also more upbeat about conditions in their own industries. Approximately 40 percent say conditions in their own industries have improved, compared with close to 29 percent last quarter.
CEOs’ short-term outlook also improved significantly. Currently, 60 percent of business leaders expect economic conditions to improve over the next six months, up from 32 percent in the first quarter. Expectations for their own industries are also more positive, with 53 percent of CEOs anticipating an improvement in conditions in the months ahead, up from 33 percent last quarter.
The Business Roundtable also released its CEO Economic Outlook Survey for the 2nd Quarter of 2013 last month.   Notable excerpts from the June 12 release, titled “CEOs Expect Slight Increase in U.S. Economic Output in 2013” include the following:
CEO expectations for the U.S. economy increased for the second time in five quarters.  They assessed the GDP would grow at a 2.2. annual rate in this survey, up from 2.1 percent expect growth in last quarter’s survey.
also:
The Business Roundtable CEO Economic Outlook Survey Index – a composite index of CEO expectations for the next six months of sales, capital spending and employment – increased in the second quarter of 2013 to 84.3 from 81.0 in the first quarter. The Index signals expected continued economic expansion and is at its highest level since the second quarter of 2012. The current Index is at modestly above its long-term average level of 79.3.
_____

I post various economic forecasts because I believe they should be carefully monitored.  However, as those familiar with this blog are aware, I do not necessarily agree with many of the consensus estimates and much of the commentary in these forecast surveys.
_____

The Special Note summarizes my overall thoughts about our economic situation

SPX at 1669.32 as this post is written

Would Deflation Be Beneficial?

The topic of deflation is one that I feel lacks recognition, especially since my analyses indicate that deflation is on the horizon and that many signs of "deflationary pressures" exist,  some of which I wrote of in the post of  June 10, "The Prospect Of Deflation." [note: to clarify, for purposes of this discussion, when I mention "deflation" I am referring to the CPI going below zero.]

Every so often I run across an article that seeks to explain why deflation would be a positive occurrence.  Most of these arguments center around the idea that consumer's purchasing power would be increased, and that lower prices would stimulate demand.

While the idea of consumers receiving lower prices certainly sounds appealing - especially given the ongoing low-growth nature of aggregate wages and income - arguments espousing that deflation would be a positive occurrence inherently neglect to consider the overall economic environment that would accompany such deflation.

While one can find many past periods of deflation - both here and abroad - and draw various conclusions from such - I strongly believe that the most recent economic environments in which deflation occurred (post-1930) are those most analogous to our present situation.  One can see these in the chart below (from Doug Short's long-term inflation updates) :

EconomicGreenfield 7-11-13 dshort 6-18-13 - inflation-1872-present

In particular, my analyses indicates that the deflationary periods of the Great Depression, as well as the brief - but sharp - episode during the Financial Crisis - are the most relevant.  Needless to say, in each of those two episodes, while consumers encountered lower prices, the overall economic environment was not beneficial.  While consumers may have benefited from lower prices, they (in aggregate) concomitantly saw a raft of negative economic impacts, including lower wages, rising unemployment, and substantial "hits" to their net worth.  Therefore, from an overall perspective, these deflationary environments were not beneficial in an overall sense.

Given the limited number of deflationary episodes that have been encountered in the U.S. post-1930, I believe it would be difficult to fully predict, from a behavioral standpoint, what impact a deflationary environment may have.  The impact on businesses' revenues and profitability would likely (depending upon the extent of the deflation as well as other factors) be pronounced, as various calculations attest.  While recent business surveys (such as that seen in my post titled "Business Expectations Concerning Price Changes And Unit Costs") don't appear to indicate that businesses expect oncoming deflationary conditions, whether businesses would foresee - and successfully adapt - to such deflationary conditions remains to be seen.

Also of note is various pernicious dynamics that would likely accompany deflation.  While these, of course, would vary with the extent of deflation, many would be inimical to today's U.S. economic and financial structure.
_____

The Special Note summarizes my overall thoughts about our economic situation

SPX at 1652.62 as this post is written

Tuesday, July 9, 2013

Charts Of Equities’ Performance Since March 9, 2009 And January 1, 1980 – July 9, 2013 Update

In the March 9, 2012 post ("Charts of Equities’ Performance Since March 9, 2009 And January 1, 1980") I highlighted two charts for reference purposes.

Below are those two charts, updated through yesterday’s closing price.

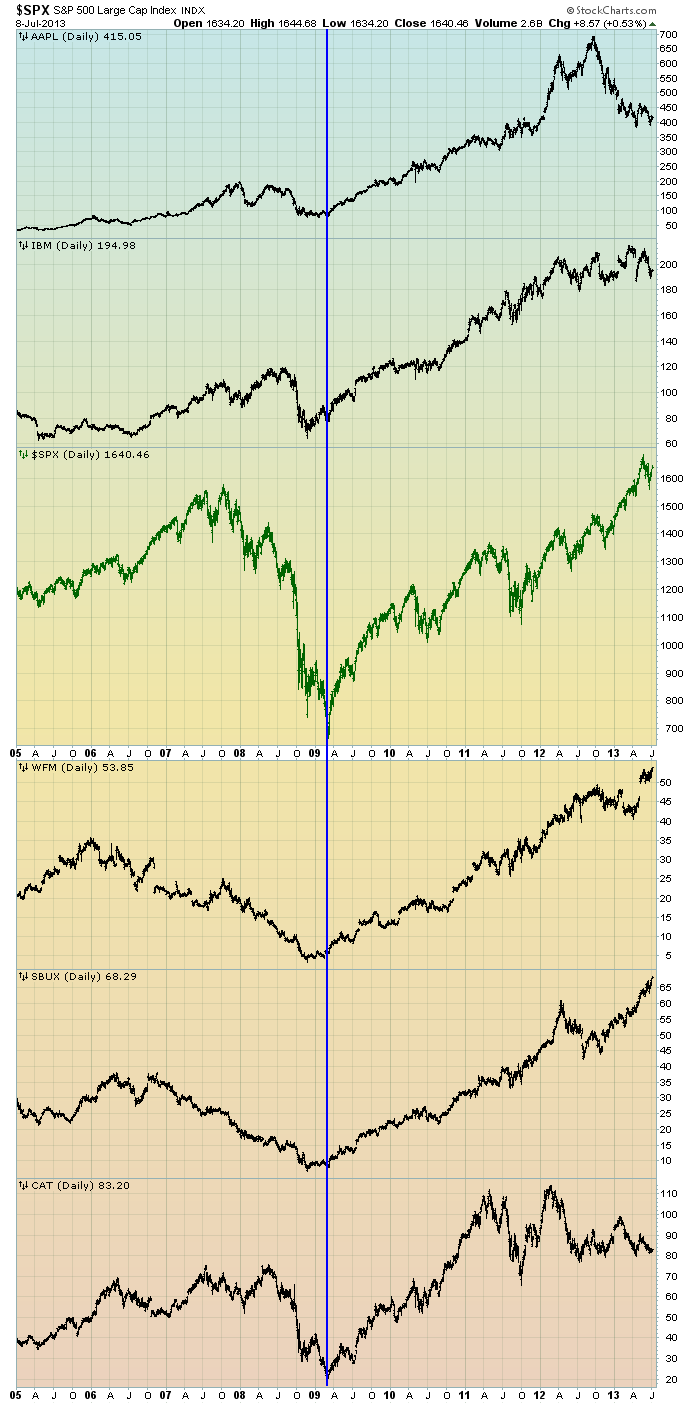
The first is a daily chart of the S&P500 (shown in green), as well as five prominent (AAPL, IBM, WFM, SBUX, CAT) individual stocks, since 2005.  There is a blue vertical line that is very close to the March 6, 2009 low.  As one can see, both the S&P500 performance, as well as many stocks including the five shown, have performed strongly since the March 6, 2009 low:

(click on chart to enlarge image)(chart courtesy of StockCharts.com; chart creation and annotation by the author)

EconomicGreenfield.com 7-9-13 AAPL IBM et al

-

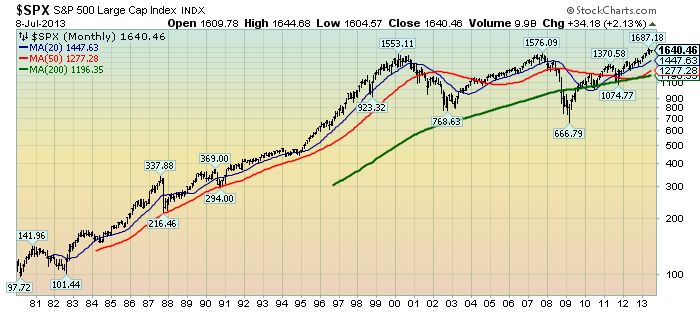
This next chart shows, on a monthly LOG basis, the S&P500 since 1980.  I find this chart notable as it provides an interesting long-term perspective on the S&P500′s performance.  The 20, 50, and 200-month moving averages are shown in blue, red, and green lines, respectively:

(click on chart to enlarge image)(chart courtesy of StockCharts.com; chart creation and annotation by the author)

EconomicGreenfield.com 7-9-13 SPX Monthly LOG since 1980

_____

The Special Note summarizes my overall thoughts about our economic situation

SPX at 1640.46 as this post is written

Monday, July 8, 2013

Building Financial Danger – July 8, 2013 Update

On October 17, 2011 I wrote a post titled “Danger Signs In The Stock Market, Financial System And Economy.”  This post is a brief 26th update to that post.

My overall analysis indicates a continuing elevated and growing level of danger which contains  many worldwide and U.S.-specific “stresses” of a very complex nature. I have written numerous posts in this blog of some of what I consider both ongoing and recent “negative developments.”  These developments, as well as other exceedingly problematic conditions, have presented a highly perilous economic environment that endangers the overall financial system.

Also of ongoing immense importance is the existence of various immensely large asset bubbles, a subject of which I have extensively written.  While all of these asset bubbles are wildly pernicious and will have profound adverse future implications, hazards presented by the bond market bubble are especially notable.

Predicting the specific timing and extent of a stock market crash is always difficult, and the immense complexity of today’s economic situation makes such a prediction even more challenging. With that being said, my analyses indicate that the danger inherent in the financial system has surpassed the level at which a near-term stock market crash – that would also involve (as seen in 2008) various other markets as well – is of tremendous concern.

(note: the “next crash” has outsized significance and implications, as discussed in the post of January 6, 2012 titled "The Next Crash And Its Significance")

As reference, below is a one-year daily chart of the S&P500 through the opening minutes of July 8 (with a last price of 1639.84), indicating both the 50dma and 200dma as well as price labels:

(click on chart to enlarge image)(chart courtesy of StockCharts.com; chart creation and annotation by the author)

EconomicGreenfield 7-8-13 SPX 1-year daily

_____

The Special Note summarizes my overall thoughts about our economic situation

SPX at 1639.84 as this post is written

Average Hourly Earnings Trends

I have written many blog posts concerning the worrisome trends in income and earnings.

Along these lines, one of the measures showing disconcerting trends is that of hourly earnings.

While the concept of hourly earnings can be defined and measured in a variety of ways, below are a few charts that I believe broadly illustrate problematic trends.

The first chart depicts Average Hourly Earnings Of All Employees: Total Private  (FRED series CES0500000003)(current value = $24.01) :

(click on chart to enlarge image)(chart last updated 7-5-13)

CES0500000003_7-5-13 24.01
Data Source: FRED, Federal Reserve Economic Data, Federal Reserve Bank of St. Louis: Average Hourly Earnings of All Employees:  Total Private [CES0500000003] ; U.S. Department of Labor: Bureau of Labor Statistics; accessed July 8, 2013:

-

This next chart depicts this same measure on a “Percentage Change From A Year Ago” basis.  While not totally surprising, I find the decline from 2009 and subsequent trend to be disconcerting:

(click on chart to enlarge image)(chart last updated 7-5-13)

CES0500000003_7-5-13 Percent Change From Year Ago

-

There are slightly different measures available from a longer-term perspective.  Pictured below is another measure, the Average Hourly Earnings of Production and Nonsupervisory Employees – Total Private  (FRED series AHETPI)(current value = $20.14)  :

(click on chart to enlarge image)(chart last updated 7-5-13)

AHETPI_7-5-13 20.14
Data Source: FRED, Federal Reserve Economic Data, Federal Reserve Bank of St. Louis: Average Hourly Earnings of Production and Nonsupervisory Employees:  Total Private [AHETPI] ; U.S. Department of Labor: Bureau of Labor Statistics;  accessed July 8, 2013:

-

Pictured below is this AHETPI measure on a “Percentage Change From A Year Ago” basis:

(click on chart to enlarge image)(chart last updated 7-5-13)

AHETPI_7-5-13 20.14 Percent Change From Year Ago

-

I will continue to actively monitor these trends, especially given the post-2009 dynamics.
_____

The Special Note summarizes my overall thoughts about our economic situation

SPX at 1631.89 as this post is written

Saturday, July 6, 2013

U-3 And U-6 Unemployment Rate Long-Term Reference Charts As Of July 5, 2013

Shortly after each monthly employment report I have been posting a continual series titled “3 Critical Unemployment Charts.”

Of course, there are many other employment charts that can be displayed as well.

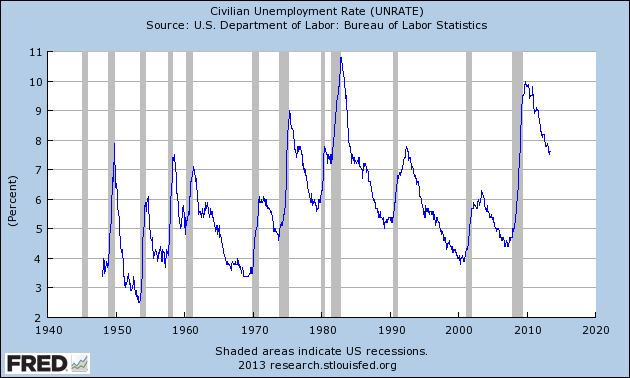
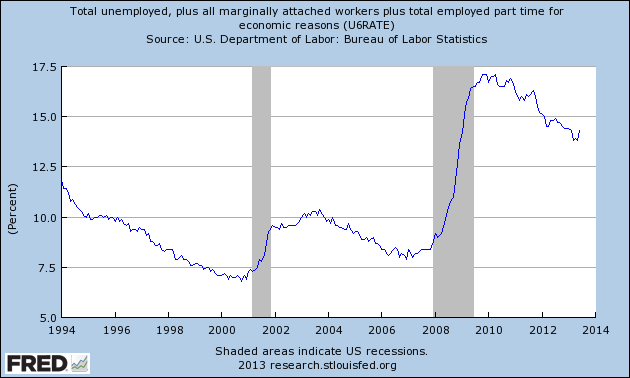
For reference purposes, below are the U-3 and U-6 Unemployment Rate charts from a long-term historical perspective.  Both charts are from the St. Louis Fed site.  The U-3 measure is what is commonly referred to as the official unemployment rate; whereas the U-6 rate is officially (per Bureau of Labor Statistics) defined as:
Total unemployed, plus all persons marginally attached to the labor force, plus total employed part time for economic reasons, as a percent of the civilian labor force plus all persons marginally attached to the labor force
Of note, many economic observers use the U-6 rate as a (closer) proxy of the actual unemployment rate rather than that depicted by the U-3 measure.

Here is the U-3 chart, currently showing a 7.6% unemployment rate:

(click on charts to enlarge images)(charts updated as of 7-5-13)

UNRATE_7-5-13 7.6 percent
Data Source: FRED, Federal Reserve Economic Data, Federal Reserve Bank of St. Louis: Civilian Unemployment Rate [UNRATE] ; U.S. Department of Labor: Bureau of Labor Statistics; accessed July 6, 2013;

-

Here is the U-6 chart, currently showing a 14.3% unemployment rate:

U6RATE_7-5-13 14.3 percent
Data Source: FRED, Federal Reserve Economic Data, Federal Reserve Bank of St. Louis: Total unemployed, plus all marginally attached workers plus total employed part time for economic reasons  [U6RATE] ; U.S. Department of Labor: Bureau of Labor Statistics; accessed July 6, 2013;

_____

The Special Note summarizes my overall thoughts about our economic situation

SPX at 1631.89 as this post is written

3 Critical Unemployment Charts – July 2013

As I have commented previously, as in the October 6, 2009 post (“A Note About Unemployment Statistics”), in my opinion the official methodologies used to measure the various job loss and unemployment statistics do not provide an accurate depiction; they serve to understate the severity of unemployment.

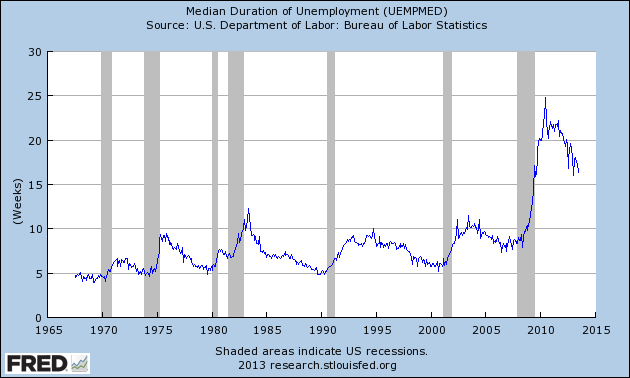
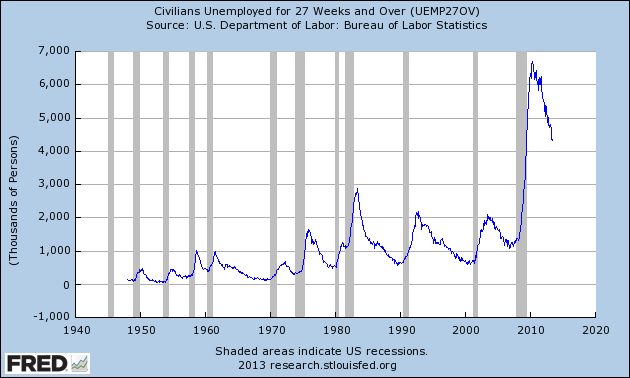
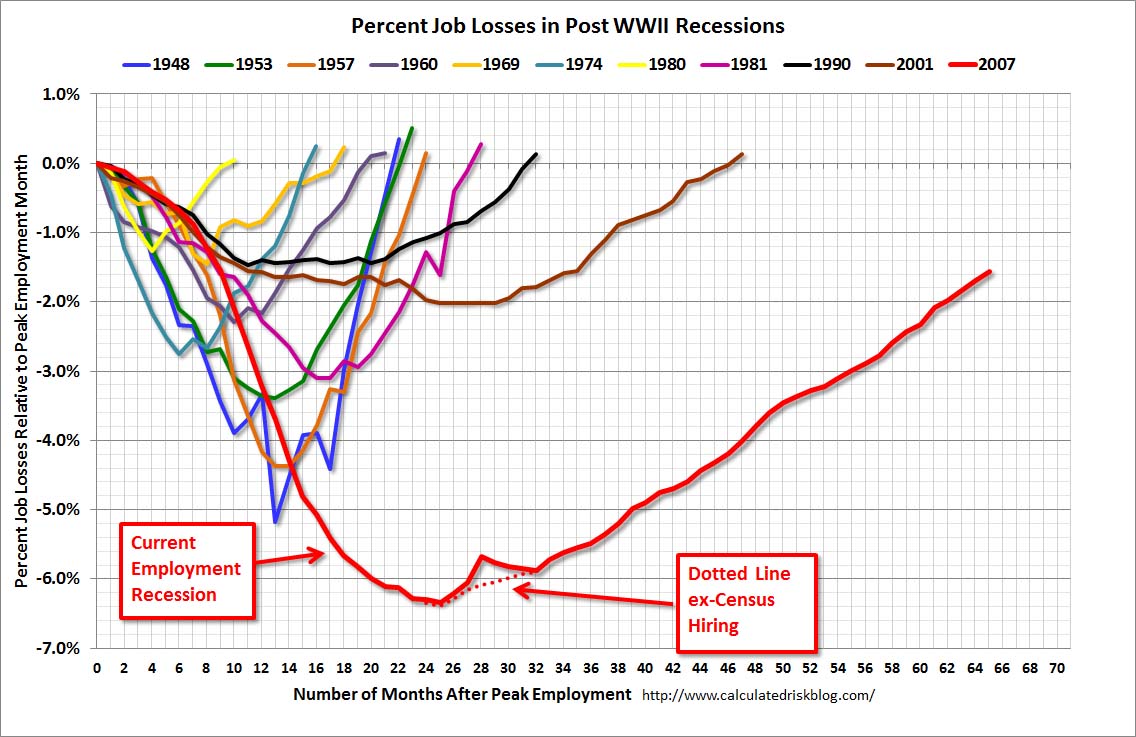
However, even if one chooses to look at the official statistics, the following charts provide an interesting (and disconcerting) long-term perspective of certain aspects of the officially-stated unemployment situation.

The first two charts are from the St. Louis Fed site.  Here is the Median Duration of Unemployment (current value = 16.3 weeks) :

(click on charts to enlarge images)(charts updated as of 7-5-13)

UEMPMED_7-5-13 16.3
Data Source: FRED, Federal Reserve Economic Data, Federal Reserve Bank of St. Louis: Median Duration of Unemployment [UEMPMED] ; U.S. Department of Labor: Bureau of Labor Statistics; accessed July 6, 2013;

-

Here is the chart for Unemployed 27 Weeks and Over (current value =  4.328 million) :

UEMP27OV_7-5-13 4328
Data Source: FRED, Federal Reserve Economic Data, Federal Reserve Bank of St. Louis: Civilians Unemployed for 27 Weeks and Over [UEMP27OV] ; U.S. Department of Labor: Bureau of Labor Statistics; accessed July 6, 2013;

-

Lastly, a chart from the CalculatedRisk.com site, from the July 5 post titled “June Employment Report:  195,000 Jobs, 7.6% Unemployment Rate.”  This shows the employment situation vs. that of previous recessions, as shown:

CR 7-5-13 EmployRecJune2013

-

As depicted by these charts, our unemployment problem is severe.  Unfortunately, there do not appear to be any “easy” solutions.

On April 24, 2012 I wrote a five-part blog post titled “The Unemployment Situation Facing The United States”, which discusses various problematical issues concerning the present and future employment situation.
_____

The Special Note summarizes my overall thoughts about our economic situation

SPX at 1631.89 as this post is written