Wednesday, July 1, 2015

Chicago Fed National Financial Conditions Index (NFCI)

The St. Louis Fed’s Financial Stress Index (STLFSI) is one index that is supposed to measure stress in the financial system.  Its reading as of the June 25, 2015 update (reflecting data through June 19) is -1.02.
Of course, there are a variety of other measures and indices that are supposed to measure financial stress and other related issues, both from the Federal Reserve as well as from private sources.
Two other indices that I regularly monitor include the Chicago Fed National Financial Conditions Index (NFCI) as well as the Chicago Fed Adjusted National Financial Conditions Index (ANFCI).
Here are summary descriptions of each, as seen in FRED:
The National Financial Conditions Index (NFCI) measures risk, liquidity and leverage in money markets and debt and equity markets as well as in the traditional and “shadow” banking systems. Positive values of the NFCI indicate financial conditions that are tighter than average, while negative values indicate financial conditions that are looser than average.
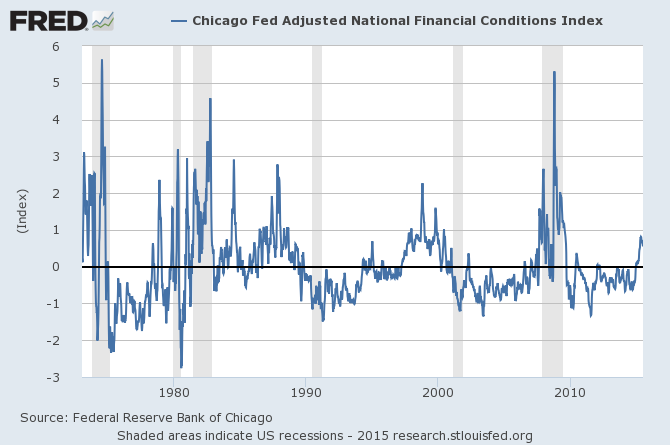
The adjusted NFCI (ANFCI). This index isolates a component of financial conditions uncorrelated with economic conditions to provide an update on how financial conditions compare with current economic conditions.
For further information, please visit the Federal Reserve Bank of Chicago’s web site:
Below are the most recently updated charts of the NFCI and ANFCI, respectively.
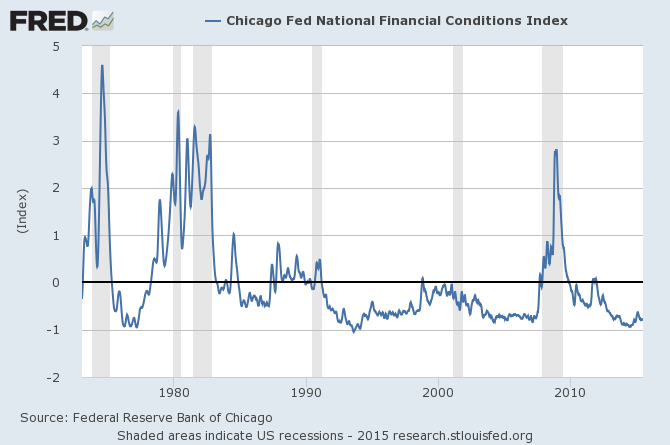
The NFCI chart below was last updated on July 1, 2015 incorporating data from January 5,1973 to June 26, 2015, on a weekly basis.  The June 26, 2015 value is -.79:
(click on chart to enlarge image)
NFCI
Data Source: FRED, Federal Reserve Economic Data, Federal Reserve Bank of St. Louis; accessed July 1, 2015:
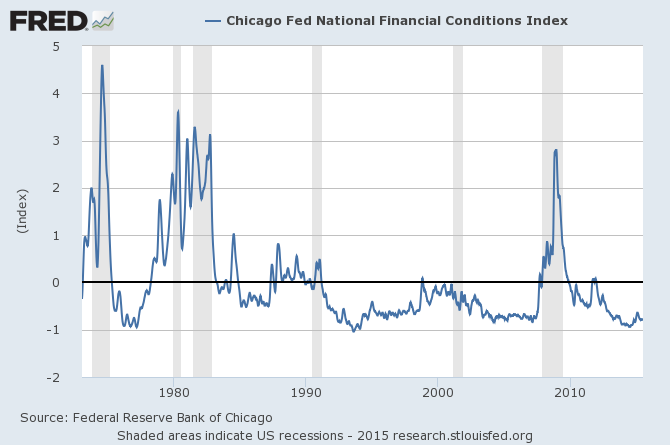
The ANFCI chart below was last updated on July 1, 2015 incorporating data from January 5,1973 to June 26, 2015, on a weekly basis.  The June 26 value is .55:
ANFCI
Data Source: FRED, Federal Reserve Economic Data, Federal Reserve Bank of St. Louis; accessed July 1, 2015:
_________
I post various indicators and indices because I believe they should be carefully monitored.  However, as those familiar with this blog are aware, I do not necessarily agree with what they depict or imply.
_____
The Special Note summarizes my overall thoughts about our economic situation
SPX at 2069.74 as this post is written

U.S. Dollar Decline – July 1, 2015 Update

U.S. Dollar weakness is a foremost concern of mine.  As such, I have extensively written about it.  I am very concerned that the actions being taken to “improve” our economic situation will dramatically weaken the Dollar.  Should the Dollar substantially decline from here, as I expect, the negative consequences will far outweigh any benefits.  The negative impact of a substantial Dollar decline can’t be overstated, in my opinion.
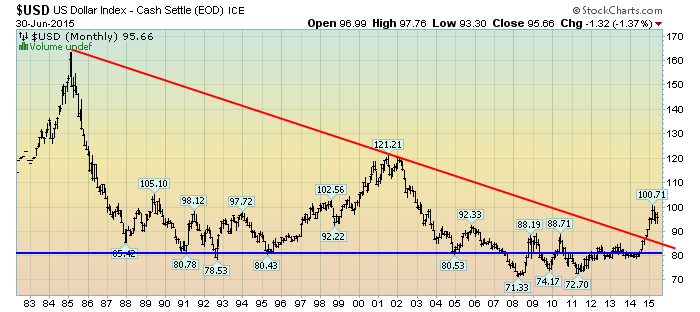
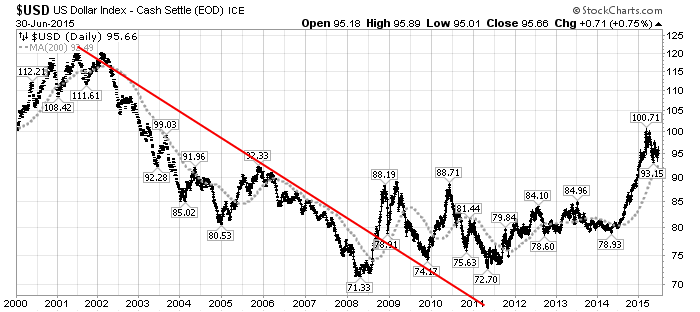
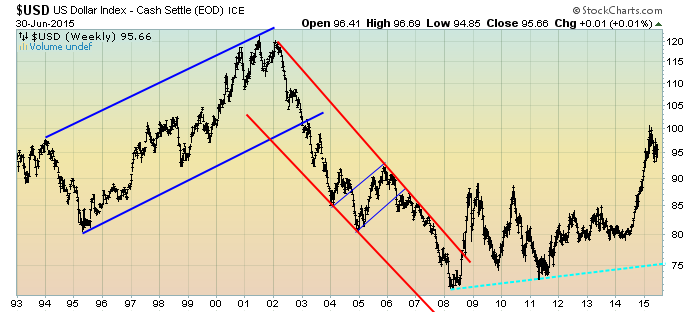
The following three charts illustrate various technical analysis aspects of the U.S. Dollar, as depicted by the U.S. Dollar Index.
First, a look at the monthly U.S. Dollar from 1983.  This clearly shows a long-term weakness, with the blue line showing technical support until 2007, and the red line representing a (past) trendline:
(charts courtesy of StockCharts.com; annotations by the author)
(click on charts to enlarge images)
U.S. Dollar Monthly
Next, another chart, this one focused on the daily U.S. Dollar since 2000 on a LOG scale.  The red line represents a (past) trendline.  The gray dotted line is the 200-day M.A. (moving average):
U.S. Dollar Daily
Lastly, a chart of the Dollar on a weekly LOG scale.  There are two clearly marked channels, with possible technical support depicted by the dashed light blue line:
U.S. Dollar Weekly
I will continue providing updates on this U.S. Dollar situation regularly as it deserves very close monitoring…
_____
The Special Note summarizes my overall thoughts about our economic situation
SPX at 2072.81 as this post is written
Tuesday, June 30, 2015

Consumer Confidence Surveys – As Of June 30, 2015

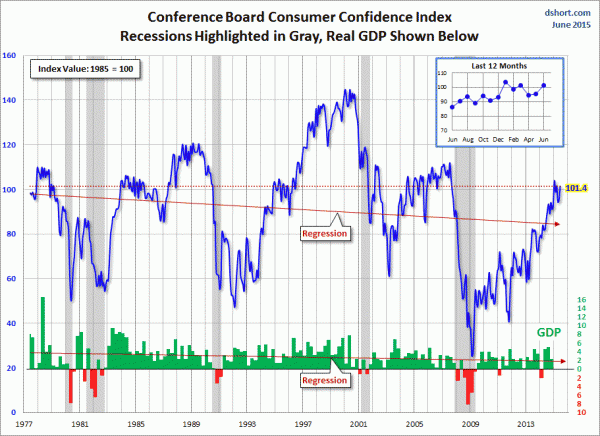
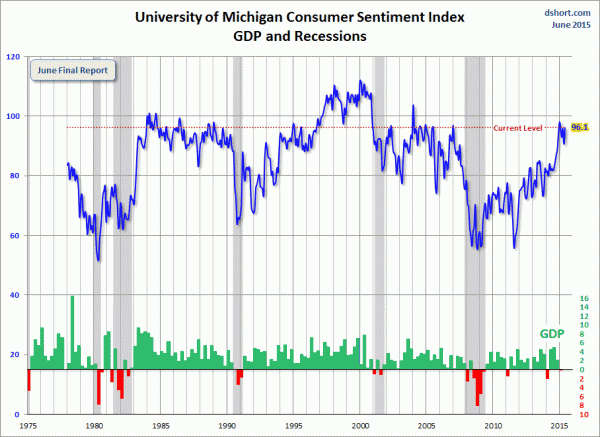
Doug Short had a blog post of June 30, 2015 (“Another Gain in Consumer Confidence“) in which he presents the latest Conference Board Consumer Confidence and Thomson/Reuters University of Michigan Consumer Sentiment Index charts.  They are presented below:
(click on charts to enlarge images)
Conference Board Consumer Confidence
Michigan Consumer Confidence
There are a few aspects of the above charts that I find highly noteworthy.  Of course, until the recent sudden upswing, the continued subdued absolute levels of these two surveys was disconcerting.
Also, I find the “behavior” of these readings to be quite disparate as compared to the other post-recession periods, as shown in the charts between the gray shaded areas (the gray areas denote recessions as defined by the NBER.)
While I don’t believe that confidence surveys should be overemphasized, I find these readings to be very problematical, especially in light of a variety of other highly disconcerting measures highlighted throughout this site.
_____
The Special Note summarizes my overall thoughts about our economic situation
SPX at 2060.38 as this post is written
Friday, June 26, 2015

Long-Term Charts Of The ECRI WLI & ECRI WLI, Gr. – June 26, 2015 Update

As I stated in my July 12, 2010 post (“ECRI WLI Growth History“):
For a variety of reasons, I am not as enamored with ECRI’s WLI and WLI Growth measures as many are.
However, I do think the measures are important and deserve close monitoring and scrutiny.
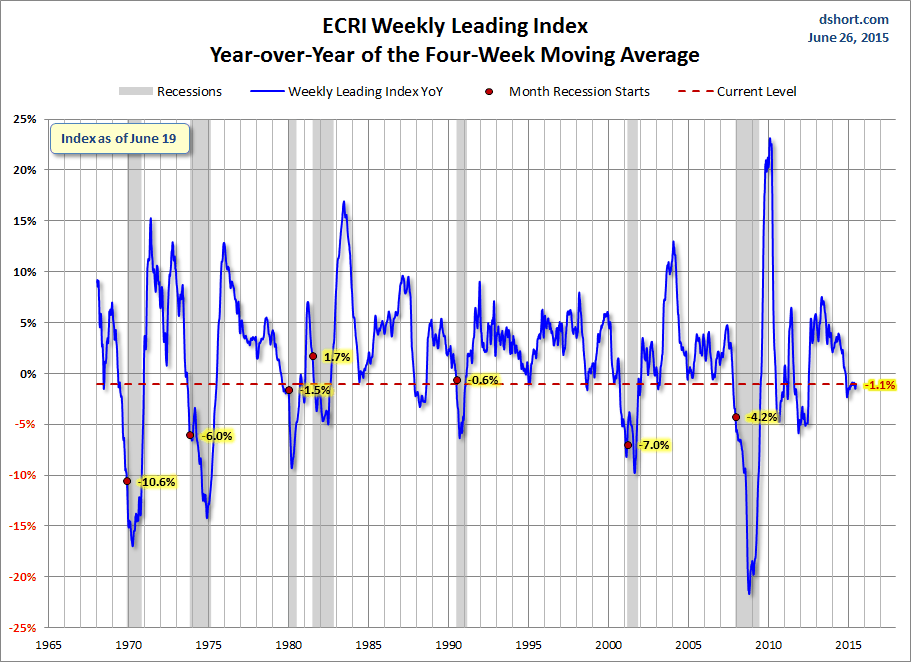
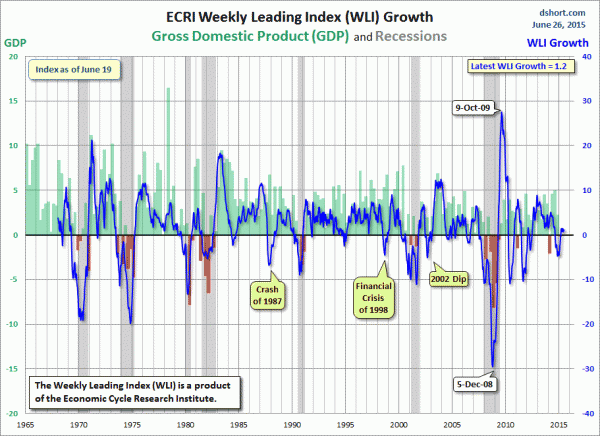
Below are three long-term charts, from Doug Short’s blog post of June 26, 2015 titled “ECRI Weekly Leading Index:  Little to No Change.”  These charts are on a weekly basis through the June 26 release, indicating data through June 19, 2015.
Here is the ECRI WLI (defined at ECRI’s glossary):
ECRI WLI
This next chart depicts, on a long-term basis, the Year-over-Year change in the 4-week moving average of the WLI:
Dshort 6-26-15 - ECRI-WLI-YoY -1.1 percent
This last chart depicts, on a long-term basis, the WLI, Gr.:
ECRI WLI,Gr.

_________
I post various economic indicators and indices because I believe they should be carefully monitored.  However, as those familiar with this blog are aware, I do not necessarily agree with what they depict or imply.
_____
The Special Note summarizes my overall thoughts about our economic situation
SPX at 2095.95 as this post is written
Thursday, June 25, 2015

Money Supply Charts Through May 2015

For reference purposes, below are two sets of charts depicting growth in the money supply.
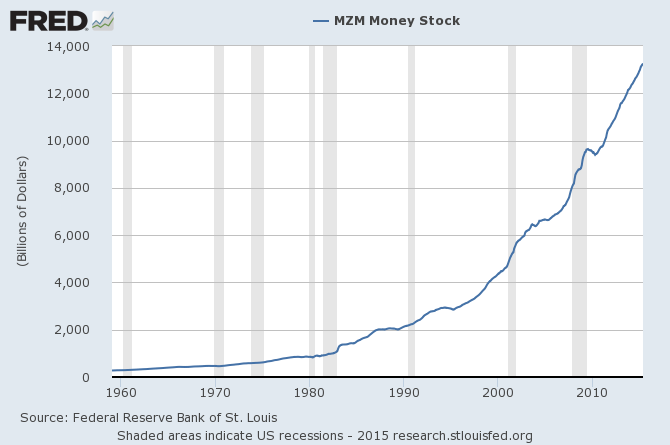
The first shows the MZM (Money Zero Maturity), defined in FRED as the following:
M2 less small-denomination time deposits plus institutional money funds.
Money Zero Maturity is calculated by the Federal Reserve Bank of St. Louis.
Here is the “MZM Money Stock” (seasonally adjusted) chart, updated on June 19, 2015 depicting data through May 2015, with value $13,263.3 Billion:
MZMSL
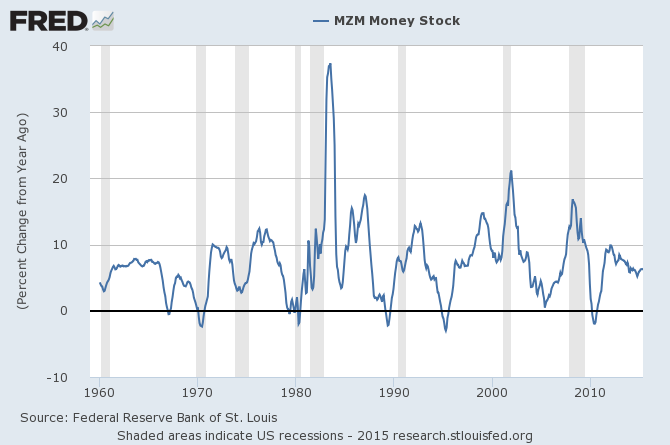
Here is the “MZM Money Stock” chart on a “Percent Change From Year Ago” basis:
MZMSL percent change from a year ago
Data Source: FRED, Federal Reserve Economic Data, Federal Reserve Bank of St. Louis; accessed June 25, 2015:
The second set shows M2, defined in FRED as the following:
M2 includes a broader set of financial assets held principally by households. M2 consists of M1 plus: (1) savings deposits (which include money market deposit accounts, or MMDAs); (2) small-denomination time deposits (time deposits in amounts of less than $100,000); and (3) balances in retail money market mutual funds (MMMFs). Seasonally adjusted M2 is computed by summing savings deposits, small-denomination time deposits, and retail MMMFs, each seasonally adjusted separately, and adding this result to seasonally adjusted M1.
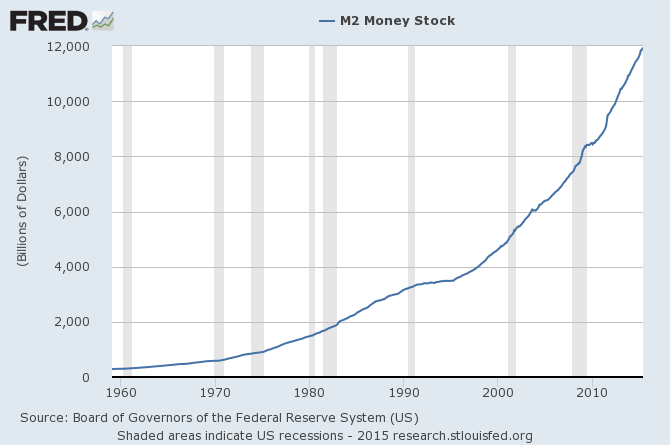
Here is the “M2 Money Stock” (seasonally adjusted) chart, updated on June 18, 2015, depicting data through May 2015, with value $11,937.70 Billion:
M2SL_6-18-15 11937.7
Here is the “M2 Money Stock” chart on a “Percent Change From Year Ago” basis:
M2SL_6-18-15 11937.7 Percent Change From Year Ago
Data Source: FRED, Federal Reserve Economic Data, Federal Reserve Bank of St. Louis; accessed June 25, 2015:
_____
The Special Note summarizes my overall thoughts about our economic situation
SPX at 2103.83 as this post is written
Wednesday, June 24, 2015

Chicago Fed National Financial Conditions Index (NFCI)

The St. Louis Fed’s Financial Stress Index (STLFSI) is one index that is supposed to measure stress in the financial system.  Its reading as of the June 18, 2015 update (reflecting data through June 12) is -1.009.
Of course, there are a variety of other measures and indices that are supposed to measure financial stress and other related issues, both from the Federal Reserve as well as from private sources.
Two other indices that I regularly monitor include the Chicago Fed National Financial Conditions Index (NFCI) as well as the Chicago Fed Adjusted National Financial Conditions Index (ANFCI).
Here are summary descriptions of each, as seen in FRED:
The National Financial Conditions Index (NFCI) measures risk, liquidity and leverage in money markets and debt and equity markets as well as in the traditional and “shadow” banking systems. Positive values of the NFCI indicate financial conditions that are tighter than average, while negative values indicate financial conditions that are looser than average.
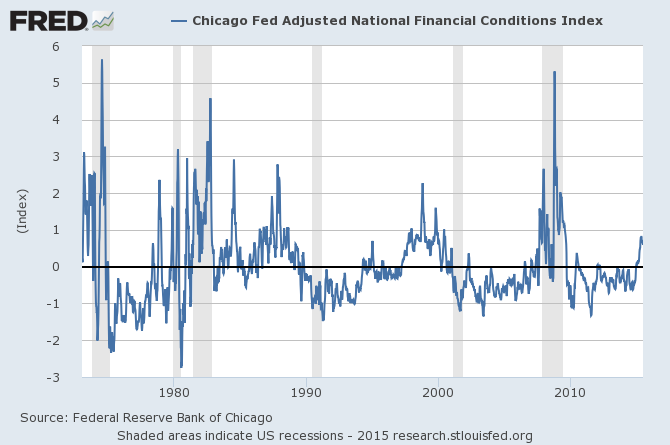
The adjusted NFCI (ANFCI). This index isolates a component of financial conditions uncorrelated with economic conditions to provide an update on how financial conditions compare with current economic conditions.
For further information, please visit the Federal Reserve Bank of Chicago’s web site:
Below are the most recently updated charts of the NFCI and ANFCI, respectively.
The NFCI chart below was last updated on June 24, 2015 incorporating data from January 5,1973 to June 19, 2015, on a weekly basis.  The June 19, 2015 value is -.79:
(click on chart to enlarge image)
NFCI 6-24-15
Data Source: FRED, Federal Reserve Economic Data, Federal Reserve Bank of St. Louis; accessed June 24, 2015:
The ANFCI chart below was last updated on June 24, 2015 incorporating data from January 5,1973 to June 19, 2015, on a weekly basis.  The June 19 value is .59:
ANFCI
Data Source: FRED, Federal Reserve Economic Data, Federal Reserve Bank of St. Louis; accessed June 24, 2015:
_________
I post various indicators and indices because I believe they should be carefully monitored.  However, as those familiar with this blog are aware, I do not necessarily agree with what they depict or imply.
_____
The Special Note summarizes my overall thoughts about our economic situation
SPX at 2111.77 as this post is written

Tuesday, June 23, 2015

Durable Goods New Orders – Long-Term Charts Through May 2015

Many people place emphasis on Durable Goods New Orders as a prominent economic indicator and/or leading economic indicator.
For reference, below are charts depicting this measure.
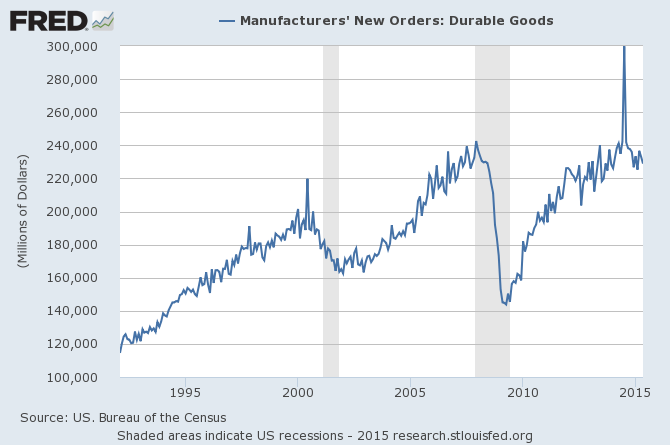
First, from the St. Louis Fed site (FRED), a chart through May, updated on June 23, 2015. This value is $228,913 ($ Millions):
(click on charts to enlarge images)
Durable Goods New Orders
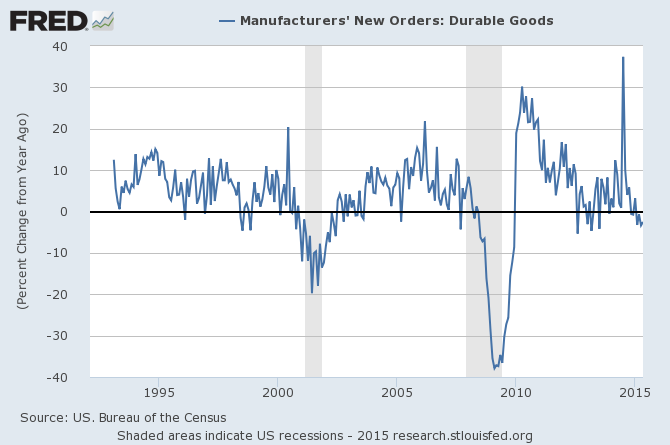
Here is the chart depicting this measure on a “Percentage Change from a Year Ago” basis:
Durable Goods New Orders Percent Change From Year Ago
Data Source: FRED, Federal Reserve Economic Data, Federal Reserve Bank of St. Louis: Manufacturers’ New Orders:  Durable Goods [DGORDER]; U.S. Department of Commerce: Census Bureau; accessed June 23, 2015;
_________
I post various indicators and indices because I believe they should be carefully monitored.  However, as those familiar with this blog are aware, I do not necessarily agree with what they depict or imply.
_____
The Special Note summarizes my overall thoughts about our economic situation
SPX at 2124.10 as this post is written

The U.S. Economic Situation – June 23, 2015 Update

Perhaps the main reason that I write of our economic situation is that I continue to believe, based upon various analyses, that our economic situation is in many ways misunderstood.  While no one likes to contemplate a future rife with economic adversity, current and future economic problems must be properly recognized and rectified if high-quality, sustainable long-term economic vitality is to be realized.
There are an array of indications and other “warning signs” – many readily apparent – that current economic activity and financial market performance is accompanied by exceedingly perilous dynamics.
I have written extensively about this peril, including in the following:
Building Financial Danger” (ongoing updates)
My analyses continues to indicate that the growing level of financial danger will lead to the next stock market crash that will also involve (as seen in 2008) various other markets as well.  Key attributes of this next crash is its outsized magnitude (when viewed from an ultra-long term historical perspective) and the resulting economic impact.  This next financial crash is of tremendous concern, as my analyses indicate it will lead to a Super Depression – i.e. an economy characterized by deeply embedded, highly complex, and difficult-to-solve problems.
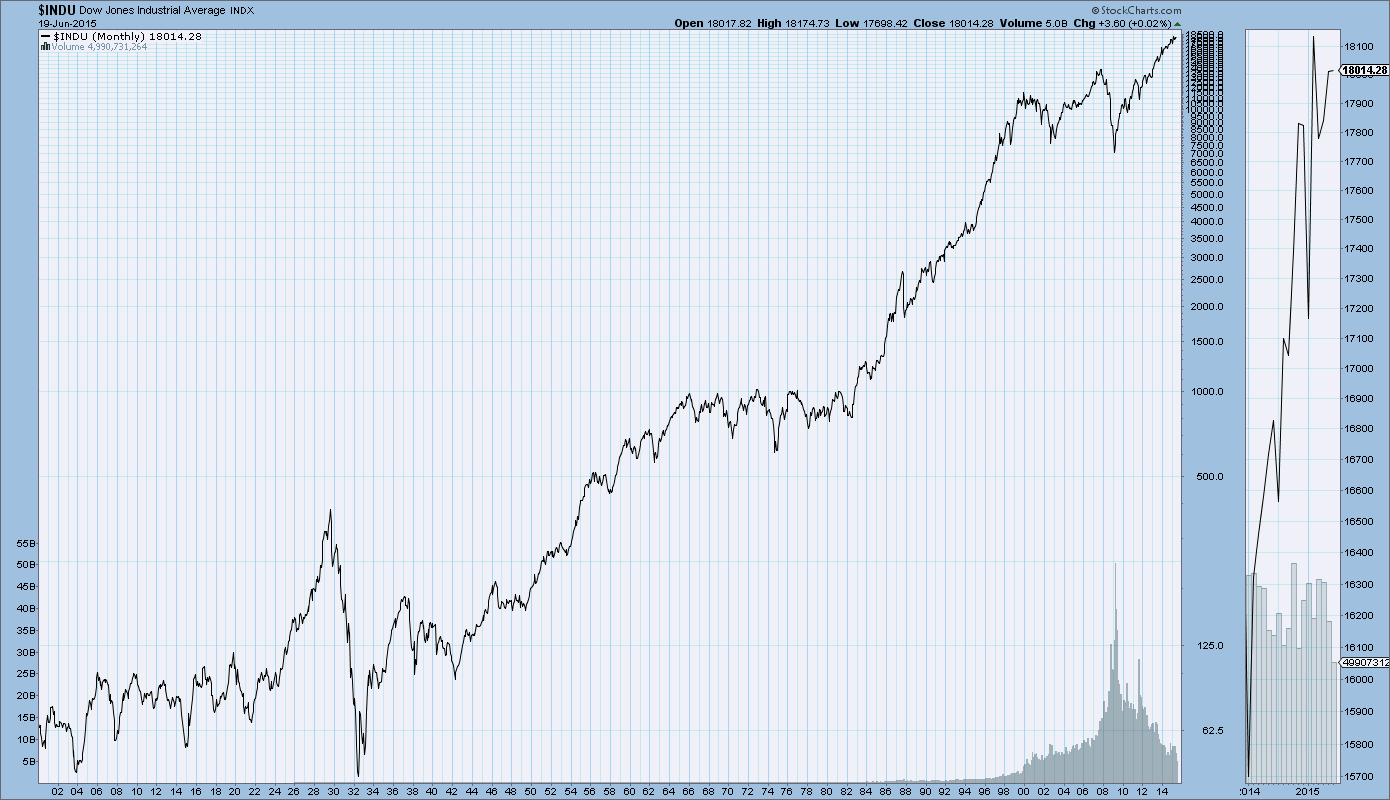
For long-term reference purposes, here is a chart of the Dow Jones Industrial Average since 1900, depicted on a monthly basis using a LOG scale (updated through June 19, 2015, with a last value of 18014.28):
(click on chart to enlarge image)(chart courtesy of StockCharts.com)
DJIA since 1900
_____
The Special Note summarizes my overall thoughts about our economic situation
SPX at 2124.88 as this post is written