Thursday, May 2, 2019

Another Recession Probability Indicator – Updated Through Q4 2018

Each month I have been highlighting various estimates of U.S. recession probabilities.  The latest update was that of April 8, 2019, titled “Recession Probability Models – April 2019.”
While I don’t agree with the methodologies employed or the probabilities of impending economic weakness as depicted by these and other estimates, I do believe that the results of these models and estimates should be monitored.
Another probability of recession is provided by James Hamilton, and it is titled “GDP-Based Recession Indicator Index.”  A description of this index, as seen in FRED:
This index measures the probability that the U.S. economy was in a recession during the indicated quarter. It is based on a mathematical description of the way that recessions differ from expansions. The index corresponds to the probability (measured in percent) that the underlying true economic regime is one of recession based on the available data. Whereas the NBER business cycle dates are based on a subjective assessment of a variety of indicators that may not be released until several years after the event , this index is entirely mechanical, is based solely on currently available GDP data and is reported every quarter. Due to the possibility of data revisions and the challenges in accurately identifying the business cycle phase, the index is calculated for the quarter just preceding the most recently available GDP numbers. Once the index is calculated for that quarter, it is never subsequently revised. The value at every date was inferred using only data that were available one quarter after that date and as those data were reported at the time.
If the value of the index rises above 67% that is a historically reliable indicator that the economy has entered a recession. Once this threshold has been passed, if it falls below 33% that is a reliable indicator that the recession is over.
Additional reference sources for this index and its construction can be seen in the Econbrowser post of February 14, 2016 titled “Recession probabilities” as well as on the “The Econbrowser Recession Indicator Index” page.
Below is a chart depicting the most recent value of 2.40%, for the fourth quarter of 2018, last updated on May 2, 2019 (after the April 26, 2019 Gross Domestic Product, First Quarter 2019 (Advance Estimate) (pdf)):
GDP-Based Recession Indicator Index (JHGDPBRINDX)
source:  Hamilton, James, GDP-Based Recession Indicator Index [JHGDPBRINDX], retrieved from FRED, Federal Reserve Bank of St. Louis on May 2, 2019:
https://research.stlouisfed.org/fred2/series/JHGDPBRINDX
_________
I post various indicators and indices because I believe they should be carefully monitored.  However, as those familiar with this site are aware, I do not necessarily agree with what they depict or imply.
_____
The Special Note summarizes my overall thoughts about our economic situation
SPX at 2917.52 as this post is written

Stock Market Capitalization To GDP – Through Q1 2019

“Stock market capitalization to GDP” is a notable and important metric regarding stock market valuation.  In February of 2009 I wrote of it in “Does Warren Buffett’s Market Metric Still Apply?”
On the Doug Short site there is an update depicting this “stock market capitalization to GDP” metric.
As seen in the May 2, 2019 post titled “Market Cap to GDP:  An Updated Look at the Buffett Valuation Indicator” two different versions are displayed, varying by the definition of stock market capitalization. (note:  additional explanation is provided in the post.)
For reference purposes, here is the first chart, with the stock market capitalization as defined by the Federal Reserve:
(click on charts to enlarge images)
Stock Market Capitalization To GDP
–
Here is the second chart, with the stock market capitalization as defined by the Wilshire 5000:
Stock Market Capitalization To GDP - using Wilshire 5000
–
As one can see in both measures depicted above, “stock market capitalization to GDP” is at notably high levels from a long-term historical perspective.
_____
The Special Note summarizes my overall thoughts about our economic situation
SPX at 2917.86 as this post is written

Jerome Powell’s May 1, 2019 Press Conference – Notable Aspects

On Wednesday, May 1, 2019 FOMC Chairman Jerome Powell gave his scheduled May 2019 FOMC Press Conference. (link of video and related materials)
Below are Jerome Powell’s comments I found most notable – although I don’t necessarily agree with them – in the order they appear in the transcript.  These comments are excerpted from the “Transcript of Chairman Powell’s Press Conference“ (preliminary)(pdf) of May 1, 2019, with the accompanying “FOMC Statement.”
From Chairman Powell’s opening comments:
CHAIR POWELL:  Good afternoon, and welcome.  At the Federal Open Market Committee (FOMC) meeting that concluded today, we reviewed economic and financial developments in the United States and around the world and decided to leave our policy interest rate unchanged.  
My colleagues and I have one overarching goal:  to use our monetary policy tools to sustain the economic expansion, with a strong job market and stable prices, for the benefit of the American people.  Incoming data since our last meeting in March have been broadly in line with our expectations.  Economic growth and job creation have both been a bit stronger than we anticipated, while inflation has been somewhat weaker.  Overall, the economy continues on a healthy path, and the Committee believes that the current stance of policy is appropriate. 
The Committee also believes that solid underlying fundamentals are supporting the economy, including accommodative financial conditions, high employment and job growth, rising wages, and strong consumer and business sentiment.  Job gains rebounded in March after a weak reading in February and averaged 180,000 per month in the first quarter, well above the pace needed to absorb new entrants to the labor force.  Although first-quarter gross domestic product (GDP) rose more than most forecasters had expected, growth in private consumption and business fixed investment slowed.  Recent data suggest that these two components will bounce back, supporting our expectation of healthy GDP growth over the rest of the year.  
Jerome Powell’s responses as indicated to the various questions:
STEVE LIESMAN. Thank you, Mr. Chair, Steve Liesman, CNBC. As the statement noted, core inflation now running below 2 percent. It’s been falling for three straight months and while you’ve been close, it’s only been at 2 percent or above one month since 2012. Mr. Chair, I guess I wonder is it time to address low inflation through policy and can you give us some sense of your metric for when it would be time? At what level would it require a policy response from the Committee? 
CHAIR POWELL. So, first, we are strongly committed to our 2 percent inflation objective and to achieving it on a sustained and symmetric basis. As I mentioned, we think our policy stance is appropriate at the moment and we don’t see a strong case for moving in either direction. I would point out that inflation actually ran, including core inflation, actually ran pretty close to 2 percent for much of 2018. As you point out, both headline and core though did come in on the soft side in the first quarter and that was not expected as it relates to core. So we say in our statement of longer run goals and monetary policy strategy that the Committee would be concerned if inflation were running persistently above or below 2 percent. So persistent carries the sense of something that’s not transient, something that will sustain over a period of time. And in this case, as we look at these readings in the first quarter for core, we do see good reasons to think that some or all of the unexpected decrease may wind up being transient. And I’d point to things like portfolio management, service prices, apparel prices, and other things. In addition, the trimmed mean measures of inflation did not go down as much, indeed Dallas trimmed mean is at 2 percent. But to go back to your question, if we did see a persistent — inflation running persistently below, then that is something the Committee would be concerned about and something that we would take into account in setting policy.
also:
MICHAEL MCKEE. Michael McKee with Bloomberg. I’m curious about the financial conditions that you see out there. The minutes of the March meeting tell us a few officials worried about financial stability risks. Was there a broader discussion at this meeting? Any consensus on whether such risks are growing as the markets hit new highs and we do see some instability in short-end trading. Is it possible that rates are too low at this point? 
CHAIR POWELL. We actually have a financial stability briefing and opportunity for comment every other meeting. So we had our quarterly briefing today — yesterday, as a matter of fact — and had that discussion as well. And I think there haven’t been a lot of changes since the last meeting but I’ll just go through the way we think about it. First, we’ve developed and published our framework for assessing financial stability vulnerabilities, put it out for comment, and welcomed any feedback we get from the public. And that enables us to focus our assessments regularly on the same things so that we can be held accountable and be transparent. So there are four aspects of it that I’ll go through quickly but I’d say that the headline really is that while there are some concerns around nonfinancial corporate debt, really the finding is that overall financial stability vulnerabilities are moderate on balance and, in addition, I would say that the financial system is quite resilient to shocks of various kinds with high capital and liquidity. But the four things we look at are, first, asset prices. And as for asset prices, some asset prices are somewhat elevated but I would say not extremely so. Leverage in the financial sector, I mentioned households are actually in good shape from a leverage standpoint. Default rates are low. Borrowing is relatively low. Nonfinancial corporates is an area that we’ve spotlighted and focused on for attention and there are concerns about that, not so much from a financial stability standpoint but from the standpoint that having a highly levered corporate sector could be an amplifier for a downturn. And then the last two things are really about the leverage in the financial system and funding risk and those are both very, very low by historic standards in the United States. So on balance, in my view, vulnerabilities are moderate. 
MICHAEL MCKEE. If I could follow up on that, I’m just curious as to whether the level of asset prices is a reason why you might not be interested in cutting rates.
CHAIR POWELL. So we do say that risks to the financial system — we say in our longer-run statement of goals and monetary policy strategy that risks to the financial system that could prevent us from achieving our goals are something that we do take into consideration. I would say though that really the tools for addressing those concerns are better — capital liquidity, good supervision, good stress testing, and things like that. Those are better first-order tools to deal with these kinds of issues than monetary policy. 
_____
_____
The Special Note summarizes my overall thoughts about our economic situation
SPX at 2914.81 as this post is written

VIX Weekly And Monthly Charts Since The Year 2000 – May 2, 2019 Update

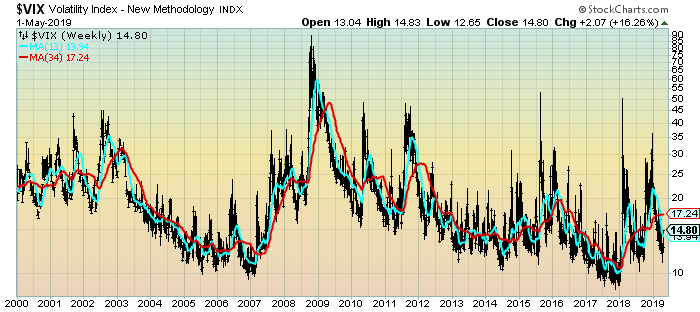
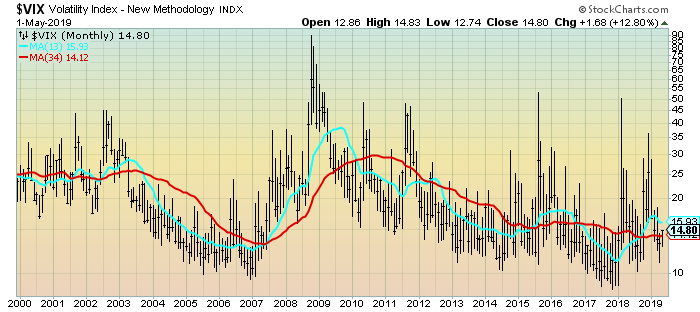
For reference purposes, below are two charts of the VIX from year 2000 through Wednesday’s (May 1, 2019) close, which had a closing value of 14.80.
Here is the VIX Weekly chart, depicted on a LOG scale, with the 13- and 34-week moving averages, seen in the cyan and red lines, respectively:
(click on chart to enlarge image)(chart courtesy of StockCharts.com; chart creation and annotation by the author)
VIX Weekly LOG chart
–
Here is the VIX Monthly chart, depicted on a LOG scale, with the 13- and 34-month moving average, seen in the cyan and red lines, respectively:
(click on chart to enlarge image)(chart courtesy of StockCharts.com; chart creation and annotation by the author)
VIX Monthly chart
____
The Special Note summarizes my overall thoughts about our economic situation
SPX at 2923.73 as this post is written

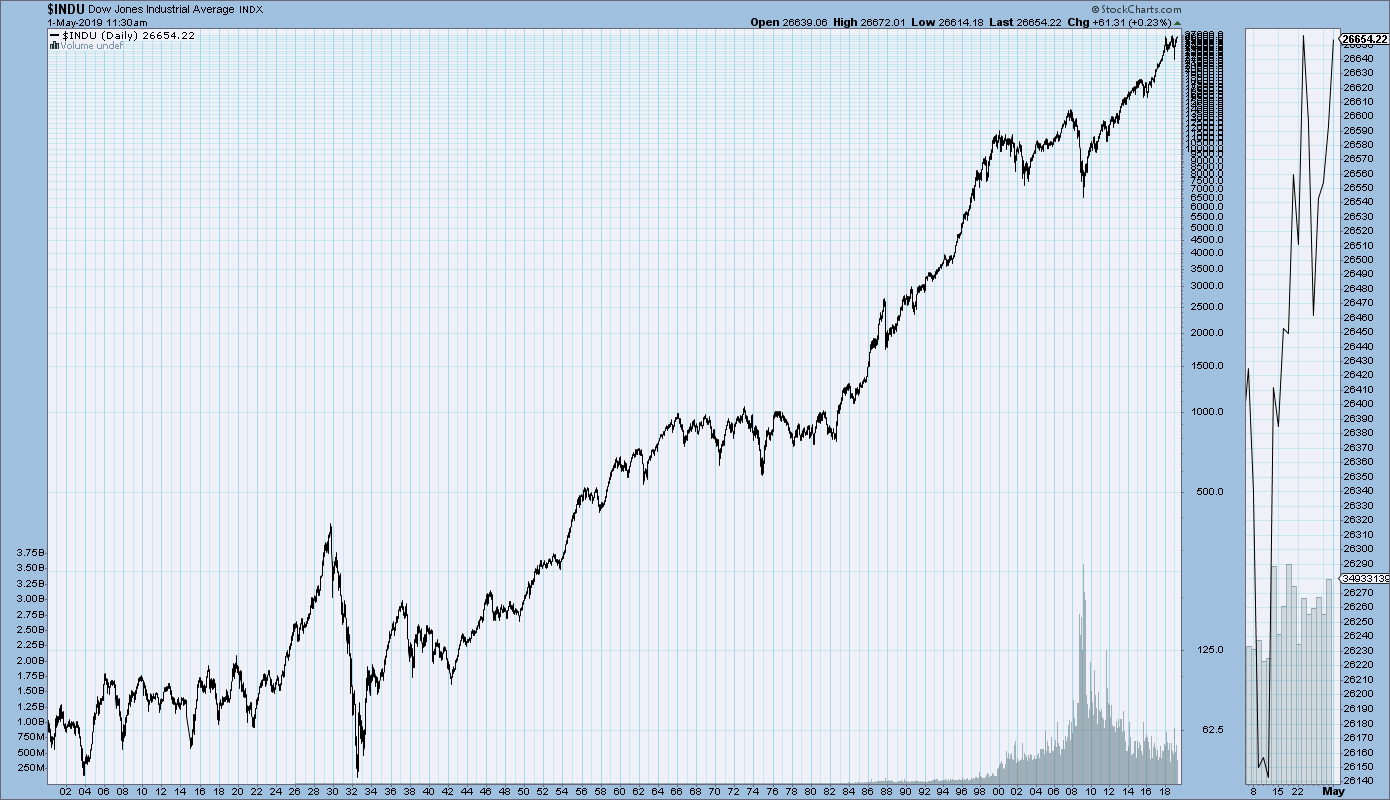
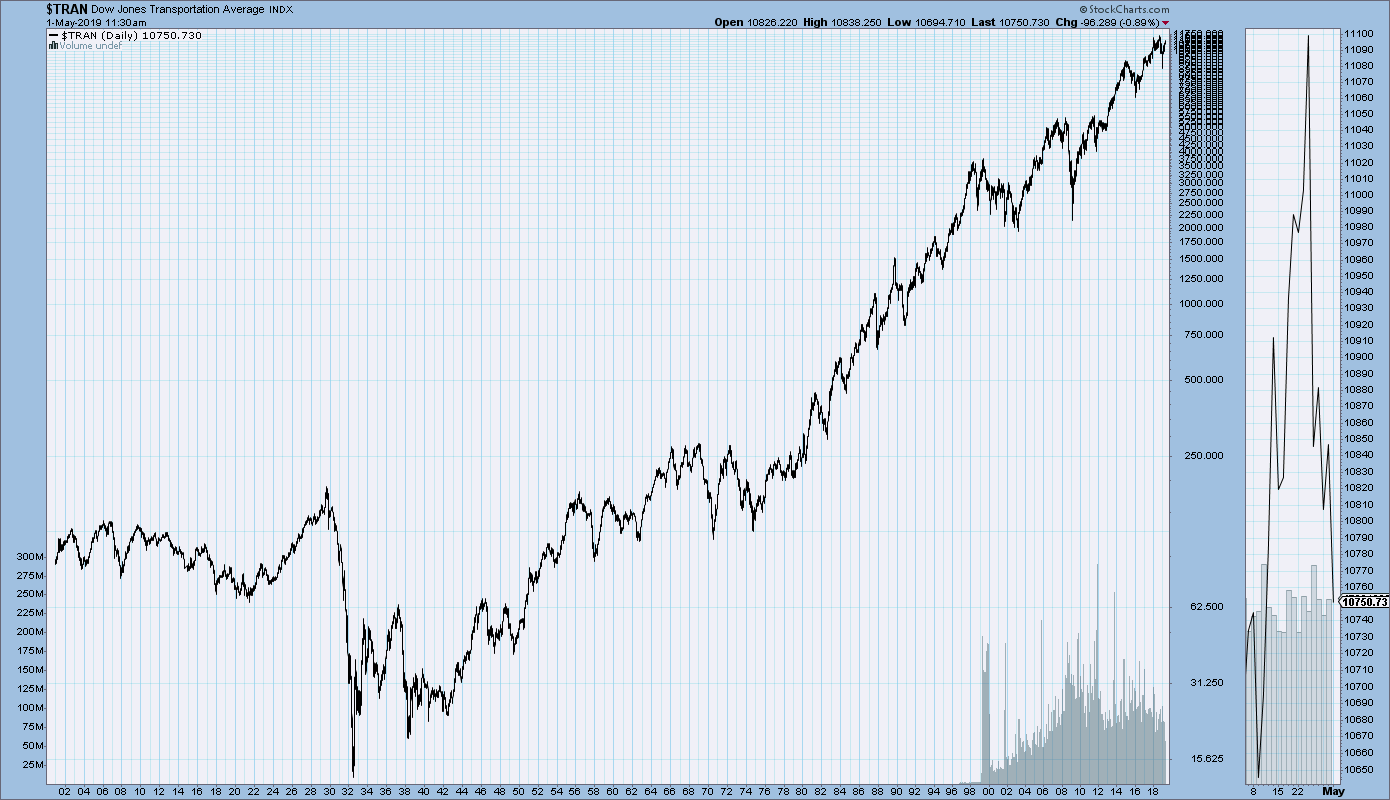
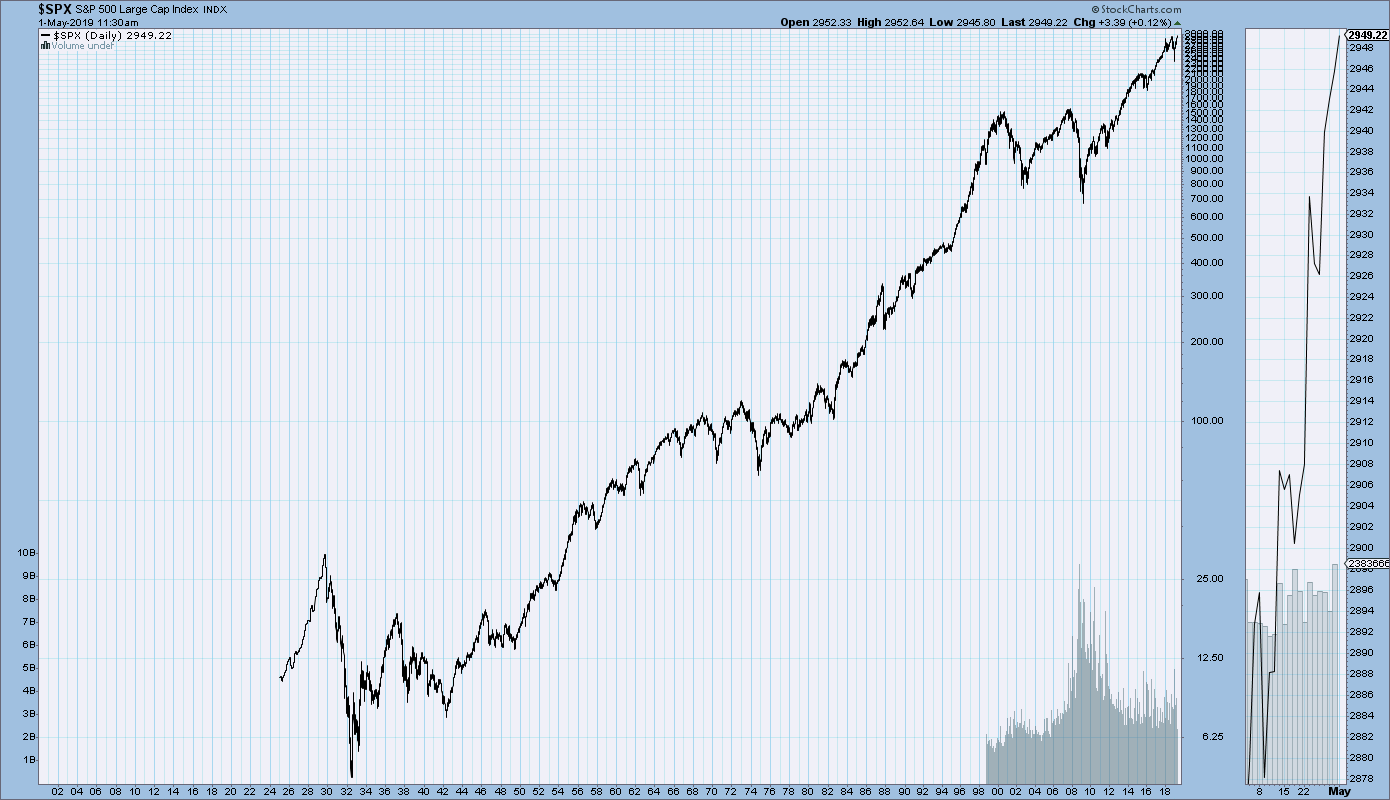
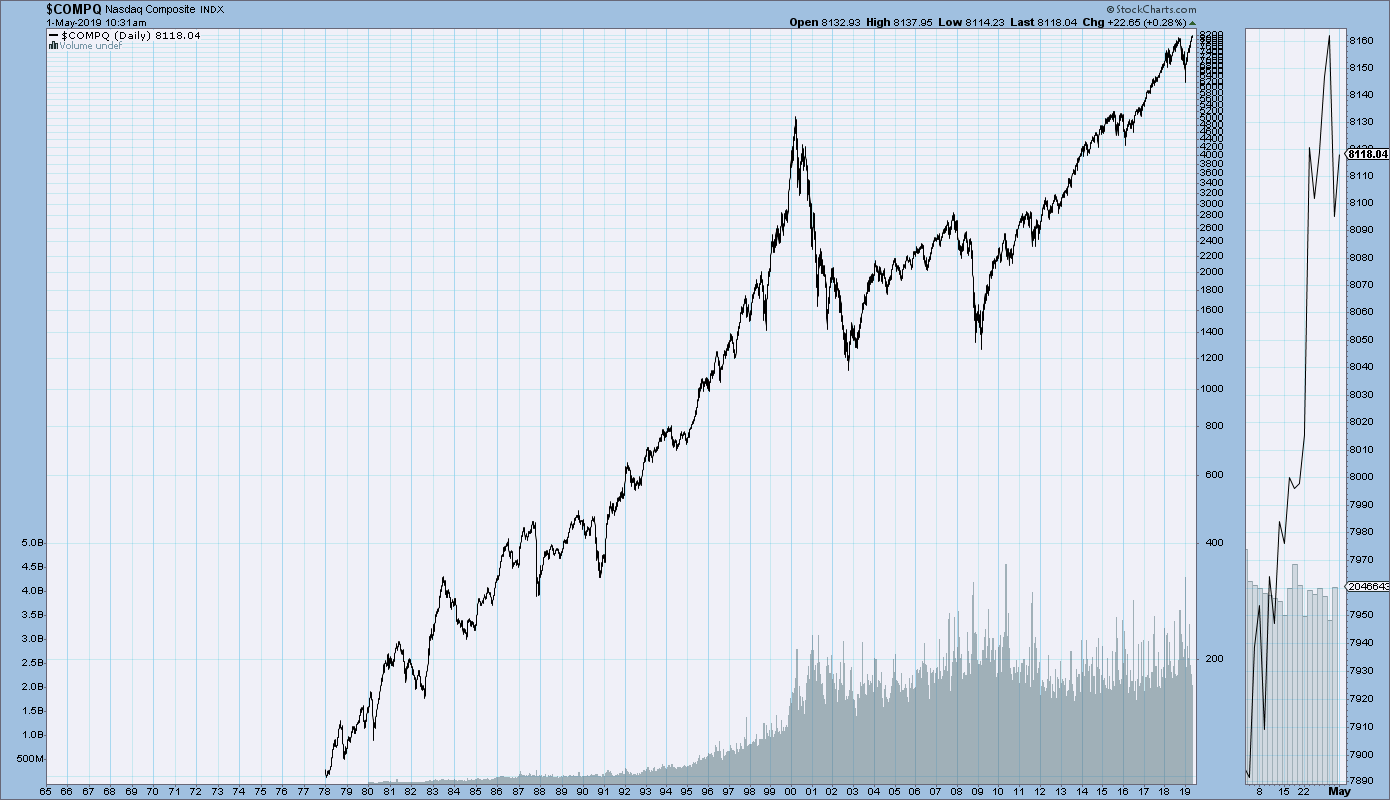
Primary U.S. Stock Market Indices Long-Term Price Charts

StockCharts.com maintains long-term historical charts of various major stock market indices, interest rates, currencies, commodities, and economic indicators.
As a long-term reference, below are charts depicting various stock market indices for the dates shown.  All charts are depicted on a monthly basis using a LOG scale.
(click on charts to enlarge images)(charts courtesy of StockCharts.com)
The Dow Jones Industrial Average, from 1900 – May 1, 2019:
DJIA chart since 1900
–
The Dow Jones Transportation Average, from 1900 – May 1, 2019:
DJTA chart since 1900
–
The S&P500, from 1925 – May 1, 2019:
S&P500 since 1925
–
The Nasdaq Composite, from 1978 – May 1, 2019:
Nasdaq Composite since 1978
_____
The Special Note summarizes my overall thoughts about our economic situation
SPX at 2923.73 as this post is written

Wednesday, May 1, 2019

Charts Of Equities’ Performance Since March 9, 2009 And January 1, 1980 – May 1, 2019 Update

In the March 9, 2012 post (“Charts of Equities’ Performance Since March 9, 2009 And January 1, 1980“) I highlighted two charts for reference purposes.
Below are those two charts, updated through the latest daily closing price.
The first is a daily chart of the S&P500 (shown in green), as well as five prominent (AAPL, IBM, AMZN, SBUX, CAT) individual stocks, since 2005.  There is a blue vertical line that is very close to the March 6, 2009 low.  As one can see, both the S&P500 performance, as well as many stocks including the five shown, have performed strongly since the March 6, 2009 low:
(click on chart to enlarge image)(chart courtesy of StockCharts.com; chart creation and annotation by the author)
S&P500 and prominent stocks
–
This next chart shows, on a monthly LOG basis, the S&P500 since 1980.  I find this chart notable as it provides an interesting long-term perspective on the S&P500′s performance.  The 20, 50, and 200-month moving averages are shown in blue, red, and green lines, respectively:
(click on chart to enlarge image)(chart courtesy of StockCharts.com; chart creation and annotation by the author)
S&P500 monthly chart since 1980
_____
The Special Note summarizes my overall thoughts about our economic situation
SPX at 2923.73 as this post is written

Chicago Fed National Financial Conditions Index (NFCI)

The St. Louis Fed’s Financial Stress Index (STLFSI) is one index that is supposed to measure stress in the financial system.  Its reading as of the April 25, 2019 update (reflecting data through April 19, 2019) is -1.336.
Of course, there are a variety of other measures and indices that are supposed to measure financial stress and other related issues, both from the Federal Reserve as well as from private sources.
Two other indices that I regularly monitor include the Chicago Fed National Financial Conditions Index (NFCI) as well as the Chicago Fed Adjusted National Financial Conditions Index (ANFCI).
Here are summary descriptions of each, as seen in FRED:
The National Financial Conditions Index (NFCI) measures risk, liquidity and leverage in money markets and debt and equity markets as well as in the traditional and “shadow” banking systems. Positive values of the NFCI indicate financial conditions that are tighter than average, while negative values indicate financial conditions that are looser than average.
The adjusted NFCI (ANFCI). This index isolates a component of financial conditions uncorrelated with economic conditions to provide an update on how financial conditions compare with current economic conditions.
For further information, please visit the Federal Reserve Bank of Chicago’s web site:
Below are the most recently updated charts of the NFCI and ANFCI, respectively.
The NFCI chart below was last updated on May 1, 2019 incorporating data from January 8, 1971 through April 26, 2019, on a weekly basis.  The April 26 value is -.88:
NFCI
Data Source: FRED, Federal Reserve Economic Data, Federal Reserve Bank of St. Louis; accessed May 1, 2019: 
http://research.stlouisfed.org/fred2/series/NFCI
–
The ANFCI chart below was last updated on May 1, 2019 incorporating data from January 8, 1971 through April 26, 2019, on a weekly basis.  The April 26 value is -.70:
ANFCI
Data Source: FRED, Federal Reserve Economic Data, Federal Reserve Bank of St. Louis; accessed May 1, 2019: 
http://research.stlouisfed.org/fred2/series/ANFCI
_________
I post various indicators and indices because I believe they should be carefully monitored.  However, as those familiar with this site are aware, I do not necessarily agree with what they depict or imply.
_____
The Special Note summarizes my overall thoughts about our economic situation
SPX at 2945.83 as this post is written

U.S. Dollar Decline – May 1, 2019 Update

U.S. Dollar weakness is a foremost concern of mine.  As such, I have extensively written about it.  I am very concerned that the actions being taken to “improve” our economic situation will dramatically weaken the Dollar.  Should the Dollar substantially decline from here, as I expect, the negative consequences will far outweigh any benefits.  The negative impact of a substantial Dollar decline can’t, in my opinion, be overstated.
The following three charts illustrate various technical analysis aspects of the U.S. Dollar, as depicted by the U.S. Dollar Index.
First, a look at the monthly U.S. Dollar from 1983.  This clearly shows a long-term weakness, with the blue line showing technical support until 2007, and the red line representing a (past) trendline:
(charts courtesy of StockCharts.com; annotations by the author)
(click on charts to enlarge images)


U.S Dollar monthly chart

–
Next, another chart, this one focused on the daily U.S. Dollar since 2000 on a LOG scale.  The red line represents a (past) trendline.  The gray dotted line is the 200-day M.A. (moving average):


U.S. Dollar chart 200dma

–
Lastly, a chart of the Dollar on a weekly LOG scale.  There are two clearly marked past channels, with possible technical support depicted by the dashed light blue line:


U.S. Dollar Index Weekly chart

–
I will continue providing updates on this U.S. Dollar situation regularly as it deserves very close monitoring…
_____
The Special Note summarizes my overall thoughts about our economic situation
SPX at 2945.83 as this post is written