Monday, January 13, 2020

Charts Indicating Economic Weakness – January 2020

U.S. Economic Indicators

Throughout this site there are many discussions of economic indicators.  At this time, the readings of various indicators are especially notable.  This post is the latest in a series of posts indicating U.S. economic weakness or a notably low growth rate.
While many U.S. economic indicators – including GDP – are indicating economic growth, others depict (or imply) various degrees of weak growth or economic contraction.  As seen in the December 2019 Wall Street Journal Economic Forecast Survey the consensus (average estimate) among various economists is for 2.2% GDP growth in 2019 and 1.8% GDP growth in 2020.  However, there are other broad-based economic indicators that seem to imply a weaker growth rate.
As well, it should be remembered that GDP figures can be (substantially) revised.

Charts Indicating U.S. Economic Weakness

Below are a small sampling of charts that depict weak growth or contraction, and a brief comment for each:

Total Federal Receipts

“Total Federal Receipts” growth continues to be intermittent in nature since 2015.  As well, the level of growth does not seem congruent to the (recent) levels of economic growth as seen in aggregate measures such as Real GDP.
“Total Federal Receipts” through December had a last monthly value of $335,805 Million.  Shown below is the measure displayed on a “Percent Change From Year Ago” basis with value 7.4%, last updated January 13, 2020:
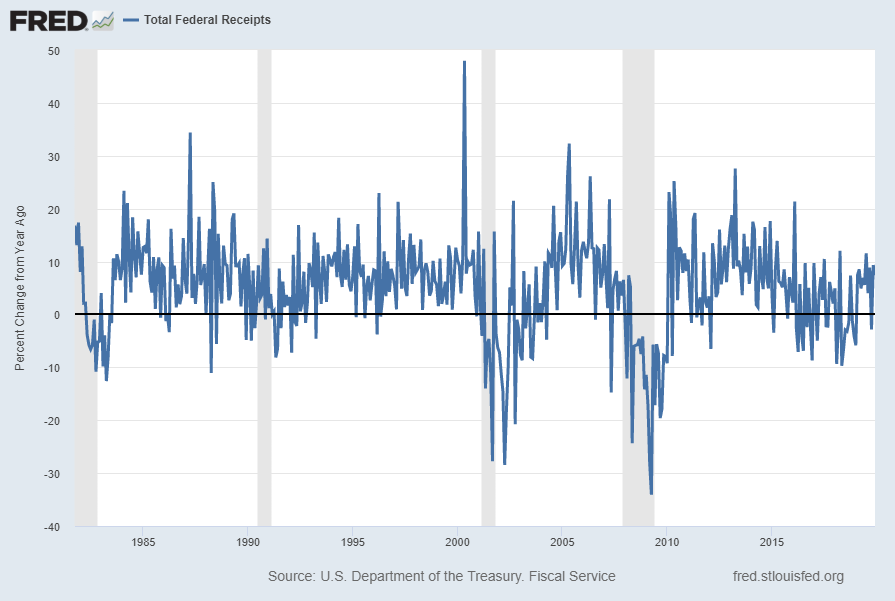
Total Federal Receipts Percent Change From Year Ago
source:  U.S. Department of the Treasury. Fiscal Service, Total Federal Receipts [MTSR133FMS], retrieved from FRED, Federal Reserve Bank of St. Louis; accessed January 13, 2020: 
https://fred.stlouisfed.org/series/MTSR133FMS
__

Value of Manufacturers’ New Orders for Consumer Goods Industries (ACOGNO)

A measure for consumer goods exhibiting a recent weakening (on a YoY basis) growth trend is the “Value of Manufacturers’ New Orders for Consumer Goods Industries” (ACOGNO). Shown below is this measure with last value of $212,644 Million through November (last updated January 7, 2020):
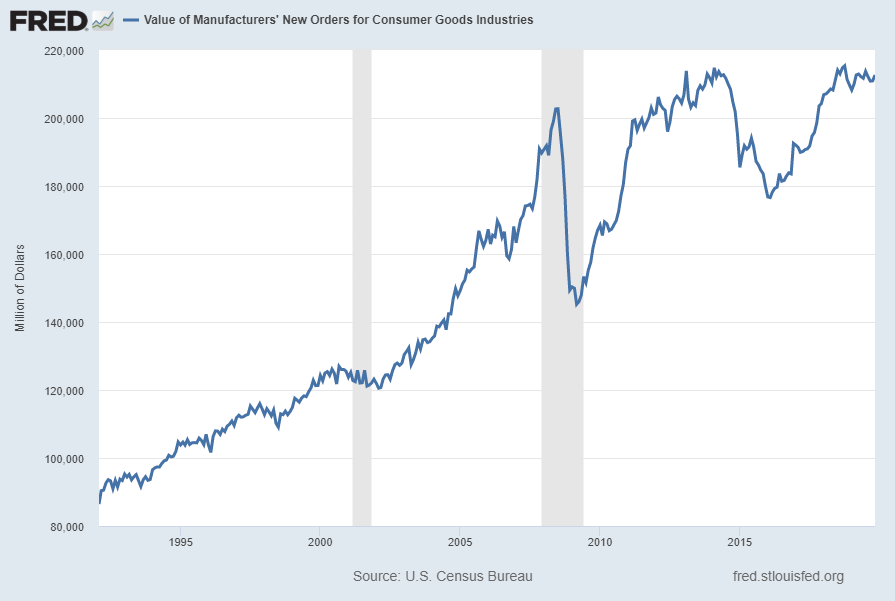
Value of Manufacturers' New Orders for Consumer Goods Industries (ACOGNO)
Below is this ACOGNO measure displayed on a “Percent Change From Year Ago” basis with value of .6%:
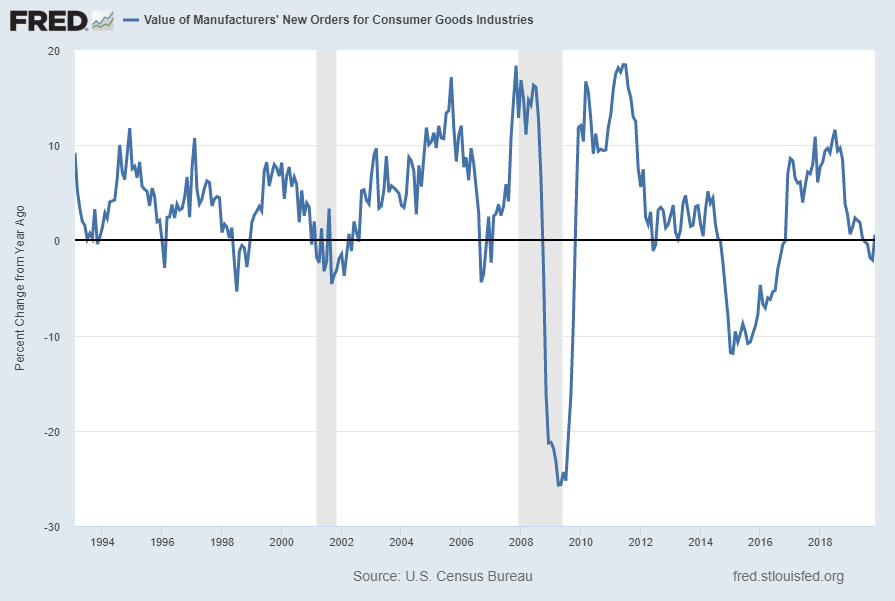
Value Of Manufacturers' New Orders for Consumer Goods Industries Percent Change From Year Ago
source:  U.S. Census Bureau, Value of Manufacturers’ New Orders for Consumer Goods Industries [ACOGNO], retrieved from FRED, Federal Reserve Bank of St. Louis; accessed January 7, 2020:  https://fred.stlouisfed.org/series/ACOGNO

__

Average Weekly Overtime Hours of Production and Nonsupervisory Employees: Manufacturing (AWOTMAN)

Various U.S. manufacturing measures continue to indicate either a significant weakening in growth or a decline in various aspects of activity. An indication of weakening manufacturing activity is overtime hours. Shown below is the “Average Weekly Overtime Hours of Production and Nonsupervisory Employees: Manufacturing” measure (with last value of 4.2 hours through December) displayed on a “Percent Change From Year Ago” basis with value -6.7%, last updated January 10, 2020:
Average Weekly Overtime Hours of Production and Nonsupervisory Employees: Manufacturing Percent Change From Year Ago
source: U.S. Bureau of Labor Statistics, Average Weekly Overtime Hours of Production and Nonsupervisory Employees: Manufacturing [AWOTMAN], retrieved from FRED, Federal Reserve Bank of St. Louis; accessed January 13, 2020: https://fred.stlouisfed.org/series/AWOTMAN

__

Motor Vehicle Retail Sales: Heavy Weight Trucks (HTRUCKSSA)

Sales of “Heavy Weight Trucks” (HTRUCKSSA) are once again contracting on a “Percent Change From Year Ago” basis. Shown below is this measure with last value of 38.499 Thousand through November, last updated December 20, 2019:
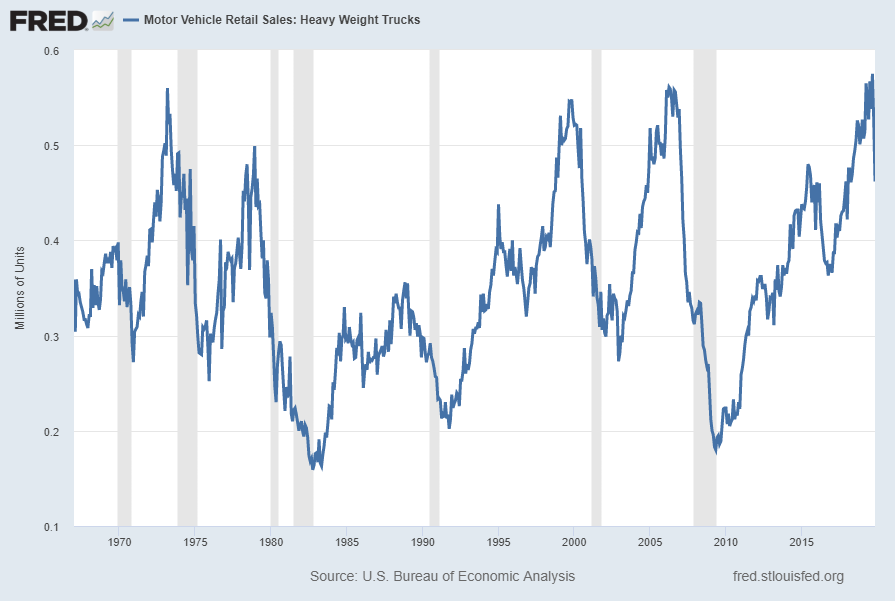
Heavy Weight Trucks sales
Below is this measure displayed on a “Percent Change From Year Ago” basis with value -7.8%:
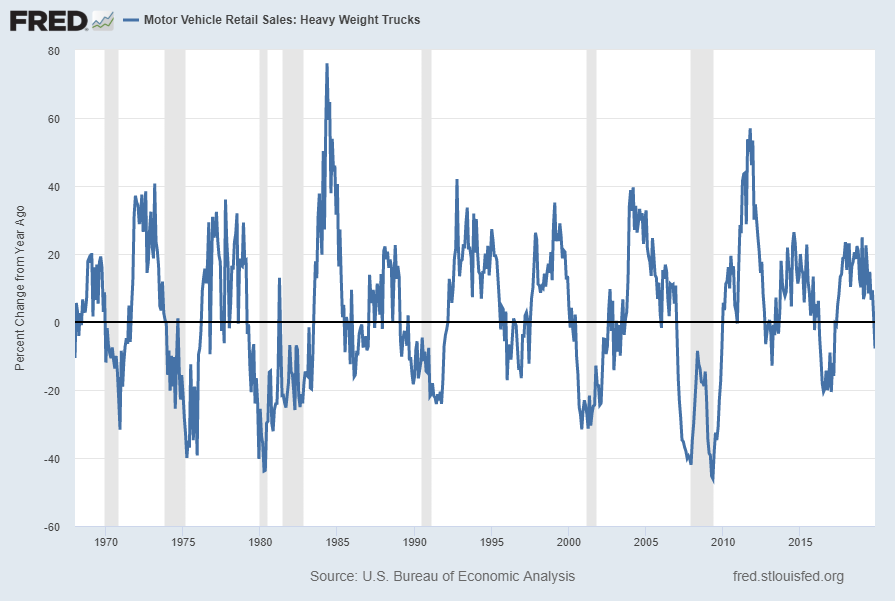
Heavy Weight Truck Sales Percent Change From Year Ago
source: U.S. Bureau of Economic Analysis, Motor Vehicle Retail Sales: Heavy Weight Trucks [HTRUCKSSA], retrieved from FRED, Federal Reserve Bank of St. Louis; accessed January 7, 2020: https://fred.stlouisfed.org/series/HTRUCKSSA
__

Other Indicators

As mentioned previously, many other indicators discussed on this site indicate economic weakness or economic contraction, if not outright (gravely) problematical economic conditions.
_____
The Special Note summarizes my overall thoughts about our economic situation
SPX at 3288.13 as this post is written

CEO Confidence Surveys 4Q 2019 – Notable Excerpts

On January 7, 2020, The Conference Board released the 4th Quarter Measure Of CEO Confidence.   The overall measure of CEO Confidence was at 43, up from 34 in the third quarter. [note:  a reading of more than 50 points reflects more positive than negative responses]
Notable excerpts from this January 7, 2020 Press Release include:
CEOs are less pessimistic about current economic conditions, with 15 percent saying conditions are better compared to six months ago, up from just 8 percent last quarter. Now, 52 percent say conditions are worse, down from 73 percent in Q3. CEOs are also more positive about current conditions in their own industries. Currently, 25 percent say conditions are better compared to six months ago, up from about 15 percent last quarter. Regarding conditions in their own industry, about 42 percent say conditions are worse, down from 63 percent last quarter.
Looking ahead, CEOs’ expectations regarding the economic outlook is less pessimistic. Now, 12 percent anticipate economic conditions will improve over the next six months, up from just 4 percent in the third quarter. Meanwhile, 44 percent expect economic conditions will worsen, down from 67 percent last quarter. CEOs’ expectations regarding short-term prospects in their own industries over the next six months were also more positive. Now, 23 percent anticipate an improvement in conditions, up from 13 percent last quarter. Those expecting conditions will worsen in the short term declined to 40 percent from 56 percent in Q3.
Last month, the Business Roundtable also released its CEO Economic Outlook Survey for the 4th Quarter of 2019.   Notable excerpts from the December 11 release, titled “Business Roundtable CEO Economic Outlook Dips for Seventh Straight Quarter“:
Business Roundtable today released its Q4 2019 CEO Economic Outlook Survey – a composite of CEO plans for capital spending and hiring and expectations for sales over the next six months. The Index decreased 2.5 points from last quarter to a value of 76.7, which remains below the Index’s historical average of 82.7 – an indication of continued moderation in the pace of economic growth.
The 2.5-point decline, while modest, marks the seventh consecutive quarterly decline and indicates that CEO plans have eased from Q3. CEOs remain cautious in the face of uncertainty over trade policy and an associated slowdown in global growth and the U.S. manufacturing sector, which is currently contracting.
also:
In their first estimate of 2020 U.S. GDP growth, CEOs projected 2.1 percent growth for the year ahead.
Additional details can be seen in the sources mentioned above.
_____
I post various economic forecasts because I believe they should be carefully monitored.  However, as those familiar with this site are aware, I do not necessarily agree with many of the consensus estimates and much of the commentary in these forecast surveys.
_____
The Special Note summarizes my overall thoughts about our economic situation
SPX at 3265.35 as this post is written

Friday, January 10, 2020

Average Hourly Earnings Trends

I have written many blog posts concerning the worrisome trends in income and earnings.
Along these lines, one of the measures showing disconcerting trends is that of hourly earnings.
While the concept of hourly earnings can be defined and measured in a variety of ways, below are a few charts that I believe broadly illustrate problematic trends.
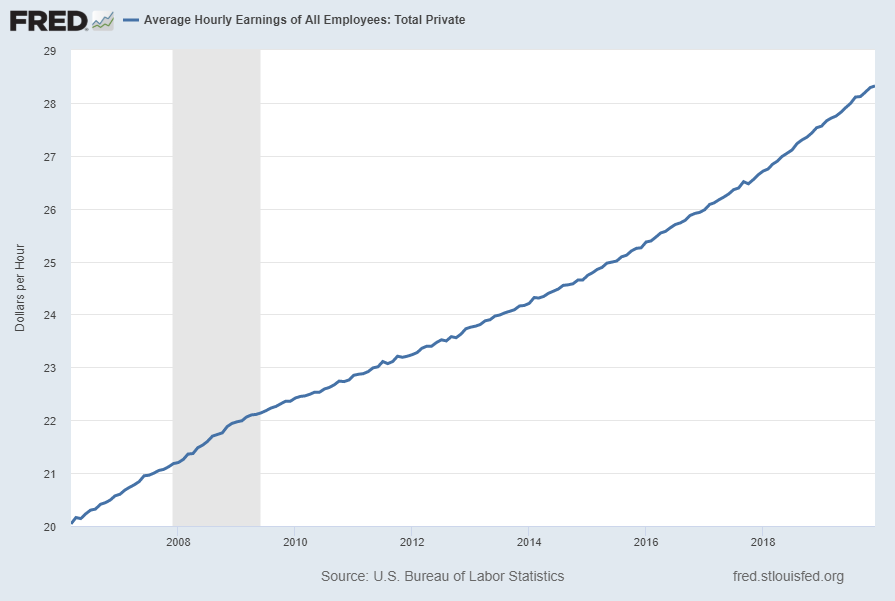
The first chart depicts Average Hourly Earnings Of All Employees: Total Private (FRED series CES0500000003)(current value = $28.32):
(click on chart to enlarge image)(chart last updated 1-10-20)
Average Hourly Earnings Of All Employees: Total Private
Data Source: FRED, Federal Reserve Economic Data, Federal Reserve Bank of St. Louis: Average Hourly Earnings of All Employees:  Total Private [CES0500000003] ; U.S. Department of Labor: Bureau of Labor Statistics; accessed January 10, 2020:
http://research.stlouisfed.org/fred2/series/CES0500000003
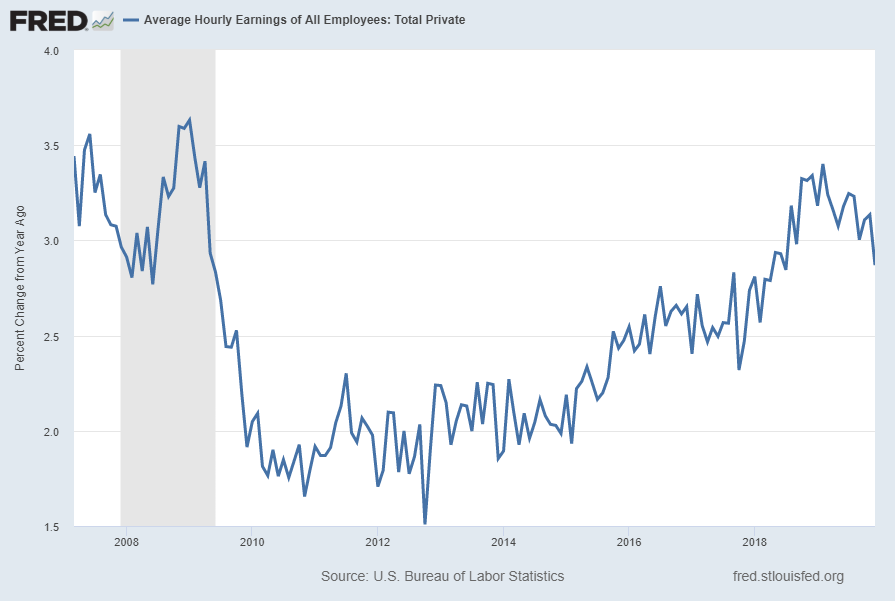
This next chart depicts this same measure on a “Percentage Change From A Year Ago” basis.   While not totally surprising, I find the decline from 2009 and subsequent trend to be disconcerting:
(click on chart to enlarge image)(chart last updated 1-10-20)
Average Hourly Earnings Of All Employees: Total Private Percent Change From Year Ago
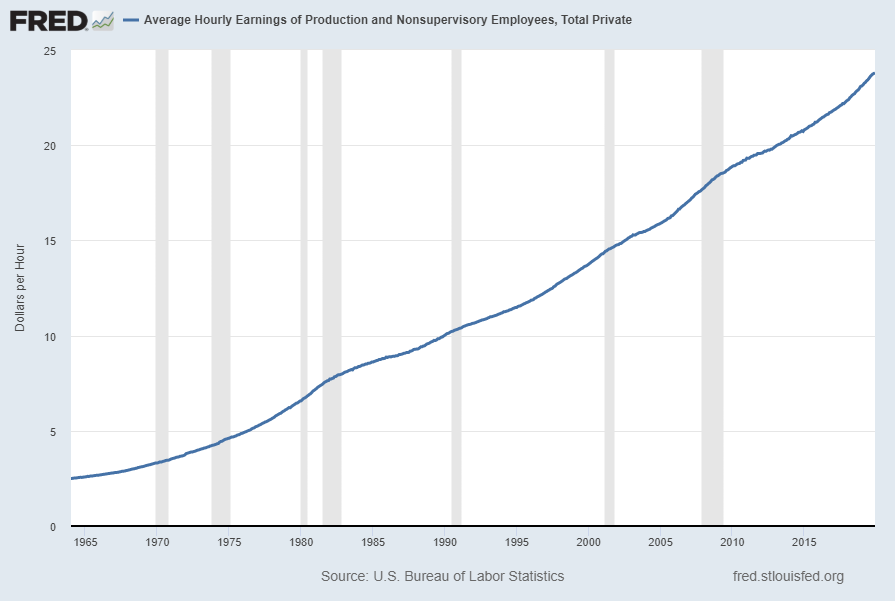
There are slightly different measures available from a longer-term perspective. Pictured below is another measure, the Average Hourly Earnings of Production and Nonsupervisory Employees – Total Private (FRED series AHETPI)(current value = $23.79):
(click on chart to enlarge image)(chart last updated 1-10-20)
Average Hourly Earnings of Production and Nonsupervisory Employees – Total Private
Data Source: FRED, Federal Reserve Economic Data, Federal Reserve Bank of St. Louis: Average Hourly Earnings of Production and Nonsupervisory Employees:  Total Private [AHETPI] ; U.S. Department of Labor: Bureau of Labor Statistics;  accessed January 10, 2020:
http://research.stlouisfed.org/fred2/series/AHETPI
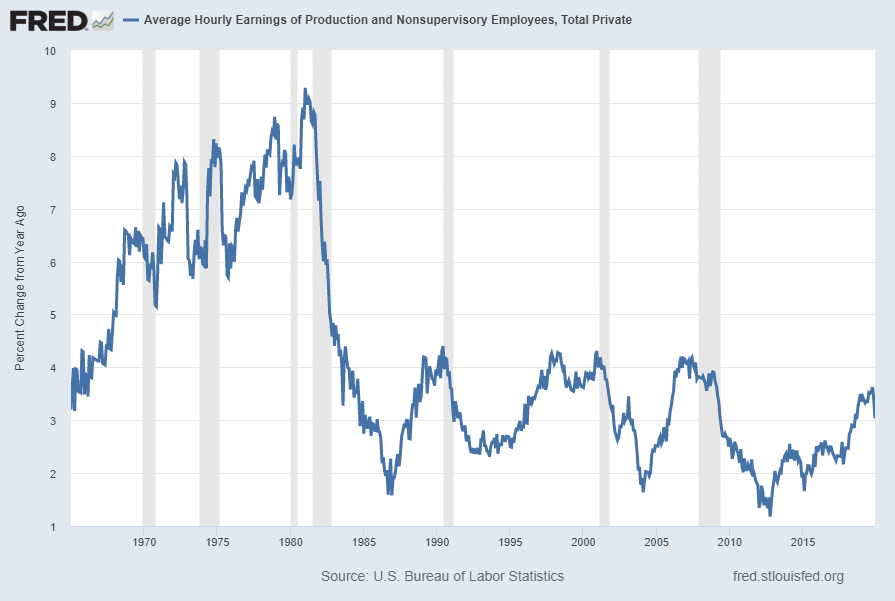
Pictured below is this AHETPI measure on a “Percentage Change From A Year Ago” basis.   While not totally surprising, I find the decline from 2009 and subsequent trend to be disconcerting:
(click on chart to enlarge image)(chart last updated 1-10-20)
Average Hourly Earnings of Production and Nonsupervisory Employees:  Total Private Percent Change From Year Ago
I will continue to actively monitor these trends, especially given the post-2009 dynamics.
_________
I post various economic indicators and indices because I believe they should be carefully monitored.  However, as those familiar with this site are aware, I do not necessarily agree with what they depict or imply.
_____
The Special Note summarizes my overall thoughts about our economic situation
SPX at 3281.51 this post is written

U-3 And U-6 Unemployment Rate Long-Term Reference Charts As Of January 10, 2020

Shortly after each monthly employment report I have been posting a continual series titled “3 Critical Unemployment Charts.”
Of course, there are many other employment charts that can be displayed as well.
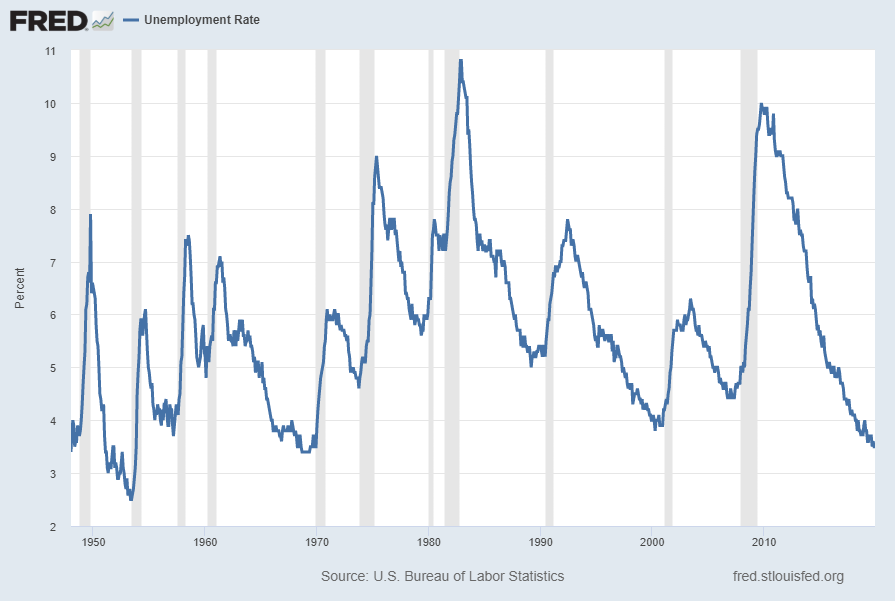
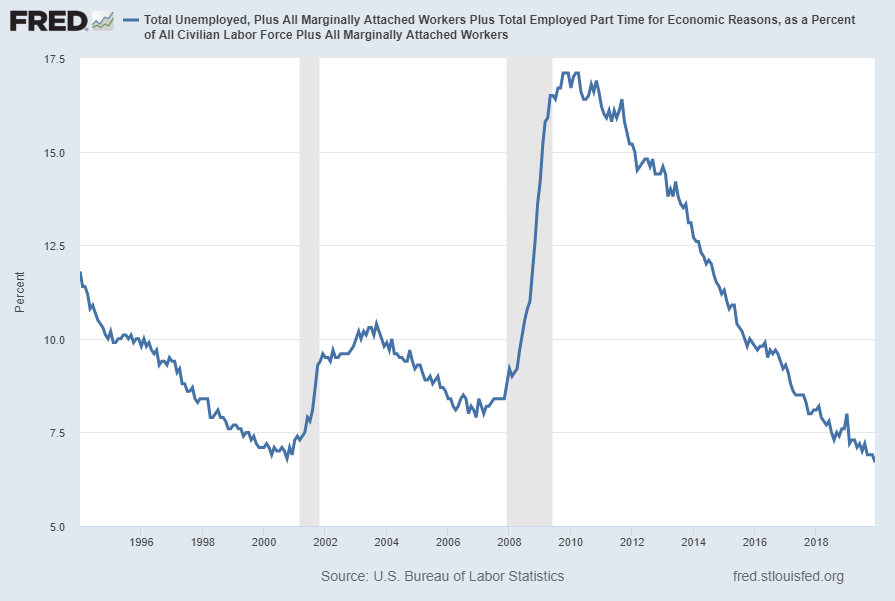
For reference purposes, below are the U-3 and U-6 Unemployment Rate charts from a long-term historical perspective.  Both charts are from the St. Louis Fed site.  The U-3 measure is what is commonly referred to as the official unemployment rate; whereas the U-6 rate is officially (per Bureau of Labor Statistics) defined as:
Total unemployed, plus all persons marginally attached to the labor force, plus total employed part time for economic reasons, as a percent of the civilian labor force plus all persons marginally attached to the labor force
Of note, many economic observers use the U-6 rate as a (closer) proxy of the actual unemployment rate rather than that depicted by the U-3 measure.
Here is the U-3 chart, currently showing a 3.5% unemployment rate:
(click on charts to enlarge images)(charts updated as of 1-10-20)
U-3 Unemployment Rate
Data Source: FRED, Federal Reserve Economic Data, Federal Reserve Bank of St. Louis: Civilian Unemployment Rate [UNRATE] ; U.S. Department of Labor: Bureau of Labor Statistics; accessed January 10, 2020:
http://research.stlouisfed.org/fred2/series/UNRATE
Here is the U-6 chart, currently showing a 6.7% unemployment rate:
U-6 Unemployment Rate
Data Source: FRED, Federal Reserve Economic Data, Federal Reserve Bank of St. Louis: Total unemployed, plus all marginally attached workers plus total employed part time for economic reasons  [U6RATE] ; U.S. Department of Labor: Bureau of Labor Statistics; accessed January 10, 2020: 
http://research.stlouisfed.org/fred2/series/U6RATE
_____
The Special Note summarizes my overall thoughts about our economic situation
SPX at 3281.09 as this post is written

3 Critical Unemployment Charts – January 2020

As I have commented previously, as in the October 6, 2009 post (“A Note About Unemployment Statistics”), in my opinion the official methodologies used to measure the various job loss and unemployment statistics do not provide an accurate depiction; they serve to understate the severity of unemployment.
However, even if one chooses to look at the official statistics, the following charts provide an interesting (and disconcerting) long-term perspective of certain aspects of the officially-stated unemployment (and, in the third chart, employment) situation.
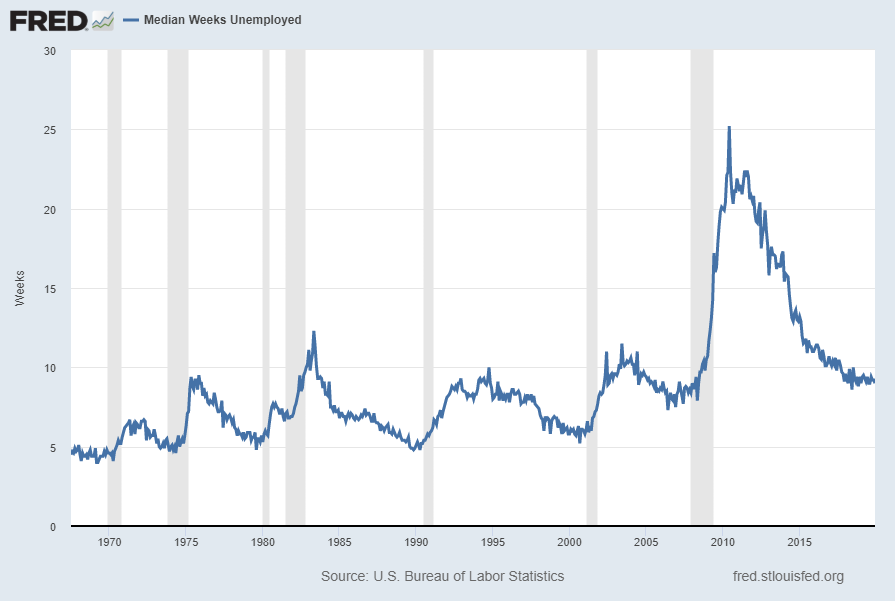
The three charts below are from the St. Louis Fed site.  Here is the Median Duration of Unemployment (current value = 9.0 weeks):
(click on charts to enlarge images)(charts updated as of 1-10-20)

Median Duration of Unemployment

Data Source: FRED, Federal Reserve Economic Data, Federal Reserve Bank of St. Louis: Median Duration of Unemployment [UEMPMED] ; U.S. Department of Labor: Bureau of Labor Statistics; accessed January 10, 2020:
http://research.stlouisfed.org/fred2/series/UEMPMED
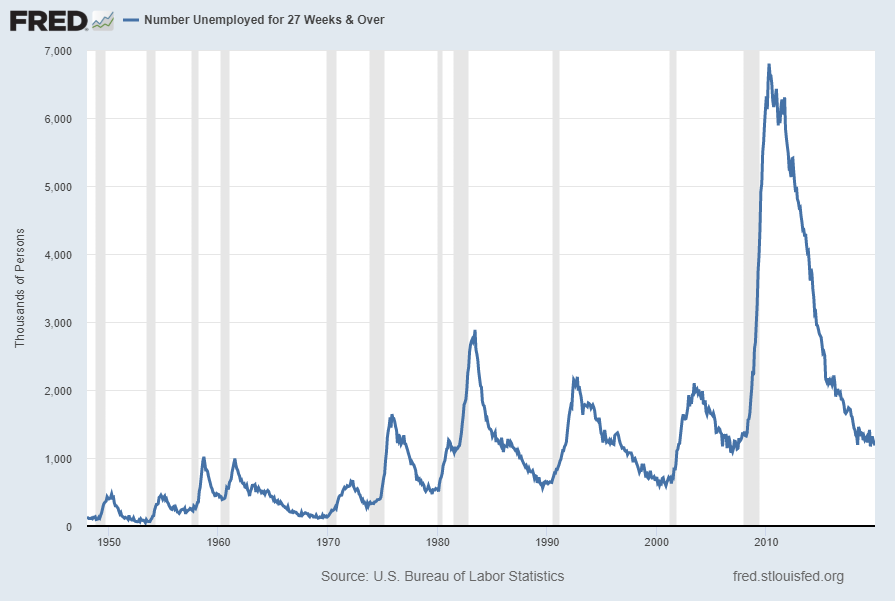
Here is the chart for Unemployed 27 Weeks and Over (current value = 1.186 million):

Unemployed 27 Weeks And Over

Data Source: FRED, Federal Reserve Economic Data, Federal Reserve Bank of St. Louis: Civilians Unemployed for 27 Weeks and Over [UEMP27OV] ; U.S. Department of Labor: Bureau of Labor Statistics; accessed January 10, 2020:
http://research.stlouisfed.org/fred2/series/UEMP27OV
Here is the chart for Total Nonfarm Payroll (current value = 152.383 million):

Total Nonfarm Payroll

Data Source: FRED, Federal Reserve Economic Data, Federal Reserve Bank of St. Louis: All Employees: Total Nonfarm [PAYEMS] ; U.S. Department of Labor: Bureau of Labor Statistics; accessed January 10, 2020:
https://research.stlouisfed.org/fred2/series/PAYEMS
Our unemployment problem is severe.  The underlying dynamics of the current – and especially future – unemployment situation remain exceedingly worrisome.  These dynamics are numerous and complex, and greatly lack recognition and understanding.
My commentary regarding unemployment is generally found in the “Unemployment” label.  This commentary includes the page titled “U.S. Unemployment Trends,” which discusses various problematical issues concerning the present and future employment situation.
_____
The Special Note summarizes my overall thoughts about our economic situation
SPX at 3282.19 as this post is written

Thursday, January 9, 2020

Deflation Probabilities – January 9, 2020 Update

While I do not agree with the current readings of the measure – I think the measure dramatically understates the probability of deflation, as measured by the CPI – the Federal Reserve Bank of Atlanta maintains an interesting data series titled “Deflation Probabilities.”
As stated on the site:
Using estimates derived from Treasury Inflation-Protected Securities (TIPS) markets, described in a technical appendix, this weekly report provides two measures of the probability of consumer price index (CPI) deflation through 2024.
A chart shows the trends of the probabilities.  As one can see in the chart, the readings are volatile.
As for the current weekly reading, the January 9, 2020 update states the following:
The 2019–24 deflation probability was 0 percent on January 8, 2020, where it has remained since December 16, 2019. The 2018–23 deflation probability was also 0 percent on January 8, 2020, where it has remained since July 8, 2019. These deflation probabilities, measuring the likelihoods of net declines in the Consumer Price Index over the five-year periods starting in early 2018 and early 2019, are estimated from prices of the five-year Treasury Inflation-Protected Securities (TIPS) issued in April 2018 and April 2019 and the 10-year TIPS issued in July 2013 and July 2014.
_________
I post various economic indicators and indices because I believe they should be carefully monitored.  However, as those familiar with this site are aware, I do not necessarily agree with what they depict or imply.
_____
The Special Note summarizes my overall thoughts about our economic situation
SPX at 3274.70 as this post is written

Deloitte “CFO Signals” Report Q4 2019 – Notable Aspects

Recently Deloitte released their “CFO Signals” “High-Level Summary” report for the 4th Quarter of 2019.
As seen in page 3 of the report, there were 147 survey respondents.  As stated:
“Each quarter (since 2Q10), CFO Signals has tracked the thinking and actions of CFOs representing many of North America’s largest and most influential companies.
All respondents are CFOs from the US, Canada, and Mexico, and the vast majority are from companies with more than $1 billion in annual revenue. For a summary of this quarter’s response demographics, please see the sidebars and charts on this page. For other information about participation and methodology, please contact nacfosurvey@deloitte.com.”
Here are some of the excerpts that I found notable:
from page 5:

Perceptions

How do you regard the status of the North American, European, and Chinese economies? Perceptions of North America leveled off, with 69% of CFOs rating current conditions as good (68% last quarter), and 23% expecting better conditions in a year (up from 15%). Perceptions of Europe rose, but only to 7% and 6%; China fell to 18% and 11%. Page 7.
What is your perception of the capital markets? Eighty-six percent of CFOs say debt financing is attractive. Equity financing is considered attractive by 43% of public company CFOs and 26% of private company CFOs. Seventy-seven percent say US equity markets are overvalued, up from 63%. Page 8.

Sentiment

What external/internal risks worry you the most? CFOs express ongoing trade policy worries, with growing concern about political turmoil, competition, consumer demand, and upcoming US elections. Internally, talent concerns continued, while concerns around change, costs, and growth rose. Page 9.
Compared to three months ago, how do you feel about the financial prospects for your company? The net optimism index rose from last quarter’s -5 to +11 this quarter, but remains among the lowest levels in three years. Thirty percent of CFOs express rising optimism (26% last quarter), and 19% express declining optimism (31% last quarter). Page 10.

Expectations

What is your company’s business focus for the next year? Although companies continue to focus mostly on growth and investment, their growing focus on cost reduction and returning cash (multi-year highs) may suggest growing defensiveness in anticipation of a downturn. Page 11.
How will your key operating metrics change over the next 12 months? YOY revenue growth expectations slid from 4.3% to 3.7% (three-year low). Earnings rose from 5.6% to 6.0% (but still second-lowest in nine years); capital spending edged up from 3.6% to 3.7% (still near its three-year low). Hiring fell from 1.6% to 1.1% (second-lowest in six years). Dividend growth rose from 3.9% to 4.3%. Page 12.

Special topic: 2020 economic, market, and company expectations

What are your economic expectations? A minority of CFOs expect improvement in the US, Canadian, and Mexican economies; expectations for consumer and business spending declined sharply, and those for labor costs rose. Page 13.
What are the prospects for a US downturn and has your company taken defensive action? Ninety-seven percent of CFOs say a downturn has already begun or will next year; compared to 1Q19, companies appear to be taking more defensive action—especially around spending and headcount. Page 14-15.
What are your expectations for the capital markets? Contrary to this time last year, CFOs expect very low interest rates and 10-year bond yields for the next calendar year; they again expect a strong US dollar. Page 16.
What are your expectations for your company? CFOs are less likely than last year to expect industry revenue and prices to rise; they are mostly unlikely to make major changes to their strategy due to a downturn or upcoming elections. Page 17.
Compared to three years ago, how has your company adjusted its geographic focus? CFOs cite a higher focus on US, European, Chinese, and other Asian markets, and expansion of capacity in the latter three regions. Page 18.

Special topic: Response to climate change

Are you getting pressure from stakeholders to act on climate change? More than 70% of CFOs say their company is under at least moderate pressure to act on climate change from at least one stakeholder group. Page 19.
Is your company taking action in response to climate change? More than 90% of CFOs say their company has taken at least one action in response to climate change, with the average CFO reporting nearly four. Page 20.
Does your company have greenhouse gas reduction targets? Overall, 44% of all responding CFOs (52% of those who know their status) say their company already has or is working on greenhouse gas reduction targets. Page 21.
from page 10:

Sentiment

Optimism regarding own-companies’ prospects

Own-company optimism rebounded from last quarter’s nearly seven-year low, but remains muted. Canada is highest at +27, with the US and Mexico lower at +11 and -33, respectively.
Net optimism peaked in 1Q18 at +54, then declined sharply through the rest of the year. Although it rebounded somewhat in the first part of 2019, it turned negative last quarter for the first time in nearly seven years.
This quarter’s net optimism bounced back from last quarter’s -5 to a better (but still low) +11. Thirty percent of CFOs expressed rising optimism (up from 26%), while 19% cited declining optimism (down from 31%).
Net optimism for the US rebounded from last quarter’s -4 to +11. Likely fueled by its strong second quarter growth (see “Key developments” box on page 4), Canada rose sharply from last quarter’s +10 to +27. Mexico rose from last quarter’s dismal -50 to a still-dismal -33.
Manufacturing is the most pessimistic at -6, with Retail/Wholesale and Healthcare/Pharma also relatively pessimistic at zero. Energy/ Resources and Financial Services both showed marked increases (to +30 and +28, respectively). Technology and Services were also relatively high.
from page 12:

Expectations

Growth in key metrics, year-over-year

All growth expectations sit at or near multiyear lows, with the US showing considerable weakness. Technology, Retail/Wholesale, and Healthcare/Pharma were relative bright spots; Manufacturing and Energy/Resources trailed for most metrics.
Revenue growth fell from 4.3% to 3.7%, a three-year low. The US fell to a three-year low. Canada fell below its two-year average. Mexico fell to a new low. Technology and Healthcare/Pharma lead; Energy/Resources and Manufacturing trail.
Earnings growth rose from 5.6% to 6.0%, but sits at its second-lowest level in survey history. The US rose slightly, but sits at its second-lowest level in nine years. Canada rose again to well above its two-year average. Mexico rose, but sits near its two-year low. Technology and Retail/ Wholesale lead; Energy/Resources and Manufacturing trail.
Capital spending growth rose slightly from 3.6% to 3.7%, remaining near its three-year low. The US slid to a three-year low. Canada fell to well  below its two-year average. Mexico rose sharply, but is still below the two-year average. Technology and Financial Services lead; Manufacturing trails.
Domestic hiring growth slid sharply from 1.6% to 1.1%, the second-lowest level in nearly six years. The US fell to a three-year low. Canada rose, but is well below its two-year average. Mexico fell to a six-year low. Technology leads; Energy/ Resources and Manufacturing trail.
Dividend growth rose from 3.9% to 4.3%, but remains well below the two-year average.
Please see the appendix for industry-specific charts. Note that industry sample sizes vary and that results are volatile for the smallest. Due to a small sample size, T/M/E was not used as a comparison point.
Among the various charts and graphics in the report are graphics depicting trends in “Own Company Optimism” on page 10 and “Economic Optimism” found on page 7.
_____
I post various business and economic surveys because I believe they should be carefully monitored.  However, as those familiar with this site are aware, I do not necessarily agree with many of the consensus estimates and much of the commentary in these surveys.
_____
The Special Note summarizes my overall thoughts about our economic situation
SPX at 3253.05 as this post is written