Thursday, February 6, 2020

Deflation Probabilities – February 6, 2020 Update

While I do not agree with the current readings of the measure – I think the measure dramatically understates the probability of deflation, as measured by the CPI – the Federal Reserve Bank of Atlanta maintains an interesting data series titled “Deflation Probabilities.”
As stated on the site:
Using estimates derived from Treasury Inflation-Protected Securities (TIPS) markets, described in a technical appendix, this weekly report provides two measures of the probability of consumer price index (CPI) deflation through 2024.
A chart shows the trends of the probabilities.  As one can see in the chart, the readings are volatile.
As for the current weekly reading, the February 6, 2020 update states the following:
The 2019–24 deflation probability was 0 percent on February 5, 2020, where it has remained since December 16, 2019. The 2018–23 deflation probability was also 0 percent on February 5, 2020, where it has remained since July 8, 2019. These deflation probabilities, measuring the likelihoods of net declines in the Consumer Price Index over the five-year periods starting in early 2018 and early 2019, are estimated from prices of the five-year Treasury Inflation-Protected Securities (TIPS) issued in April 2018 and April 2019 and the 10-year TIPS issued in July 2013 and July 2014.
_________
I post various economic indicators and indices because I believe they should be carefully monitored.  However, as those familiar with this site are aware, I do not necessarily agree with what they depict or imply.
_____
The Special Note summarizes my overall thoughts about our economic situation
SPX at 3345.78 as this post is written

Wednesday, February 5, 2020

The State of the Union Address – Notable Excerpts

I found President Trump’s State of the Union Address last night (February 4, 2020) to contain some noteworthy comments.  While I could comment extensively on many parts of the speech, for now I will indicate excerpts that I found most relevant with regard to the economic situation, and may comment upon them at a future point.  I am highlighting these excerpts for many reasons; it should be noted that I do not necessarily agree with any or all of them.
Here are the excerpts I found most relevant, in the order they occurred in the speech:
Three years ago, we launched the great American comeback.  Tonight, I stand before you to share the incredible results.  Jobs are booming, incomes are soaring, poverty is plummeting, crime is falling, confidence is surging, and our country is thriving and highly respected again.  (Applause.)  America’s enemies are on the run, America’s fortunes are on the rise, and America’s future is blazing bright.
The years of economic decay are over.  (Applause.)  The days of our country being used, taken advantage of, and even scorned by other nations are long behind us.  (Applause.)  Gone too are the broken promises, jobless recoveries, tired platitudes, and constant excuses for the depletion of American wealth, power, and prestige.
In just three short years, we have shattered the mentality of American decline, and we have rejected the downsizing of America’s destiny.  We have totally rejected the downsizing.  We are moving forward at a pace that was unimaginable just a short time ago, and we are never, ever going back.  (Applause.)
I am thrilled to report to you tonight that our economy is the best it has ever been.  Our military is completely rebuilt, with its power being unmatched anywhere in the world — and it’s not even close.  Our borders are secure.  Our families are flourishing.  Our values are renewed.  Our pride is restored.  And for all of these reasons, I say to the people of our great country and to the members of Congress: The state of our Union is stronger than ever before.  (Applause.)
The vision I will lay out this evening demonstrates how we are building the world’s most prosperous and inclusive society — one where every citizen can join in America’s unparalleled success and where every community can take part in America’s extraordinary rise.
From the instant I took office, I moved rapidly to revive the U.S. economy — slashing a record number of job-killing regulations, enacting historic and record-setting tax cuts, and fighting for fair and reciprocal trade agreements.  (Applause.)  Our agenda is relentlessly pro-worker, pro-family, pro-growth, and, most of all, pro-American.  (Applause.)  Thank you.  We are advancing with unbridled optimism and lifting our citizens of every race, color, religion, and creed very, very high.
Since my election, we have created 7 million new jobs — 5 million more than government experts projected during the previous administration.  (Applause.)
The unemployment rate is the lowest in over half a century.  (Applause.)  And very incredibly, the average unemployment rate under my administration is lower than any administration in the history of our country.  (Applause.)  True.  If we hadn’t reversed the failed economic policies of the previous administration, the world would not now be witnessing this great economic success.  (Applause.)
The unemployment rate for African Americans, Hispanic Americans, and Asian Americans has reached the lowest levels in history.  (Applause.)  African American youth unemployment has reached an all-time low.  (Applause.)  African American poverty has declined to the lowest rate ever recorded.  (Applause.)
The unemployment rate for women reached the lowest level in almost 70 years.  And, last year, women filled 72 percent of all new jobs added.  (Applause.)
The veterans unemployment rate dropped to a record low.  (Applause.)  The unemployment rate for disabled Americans has reached an all-time low.  (Applause.)
Workers without a high school diploma have achieved the lowest unemployment rate recorded in U.S. history.  (Applause.)  A record number of young Americans are now employed.  (Applause.)
Under the last administration, more than 10 million people were added to the food stamp rolls.  Under my administration, 7 million Americans have come off food stamps, and 10 million people have been lifted off of welfare.  (Applause.)
In eight years under the last administration, over 300,000 working-age people dropped out of the workforce.  In just three years of my administration, 3.5 million people — working-age people — have joined the workforce.  (Applause.)
Since my election, the net worth of the bottom half of wage earners has increased by 47 percent — three times faster than the increase for the top 1 percent.  (Applause.)  After decades of flat and falling incomes, wages are rising fast — and, wonderfully, they are rising fastest for low-income workers, who have seen a 16 percent pay increase since my election.  (Applause.)  This is a blue-collar boom.  (Applause.)
Real median household income is now at the highest level ever recorded.  (Applause.)
Since my election, U.S. stock markets have soared 70 percent, adding more than $12 trillion to our nation’s wealth, transcending anything anyone believed was possible.  This is a record.  It is something that every country in the world is looking up to.  They admire.  (Applause.)  Consumer confidence has just reached amazing new highs.
All of those millions of people with 401(k)s and pensions are doing far better than they have ever done before with increases of 60, 70, 80, 90, and 100 percent, and even more.
also:
Likewise, we are restoring our nation’s manufacturing might, even though predictions were, as you all know, that this could never, ever be done.  After losing 60,000 factories under the previous two administrations, America has now gained 12,000 new factories under my administration, with thousands upon thousands of plants and factories being planned or being built.  (Applause.)  Companies are not leaving; they are coming back to the USA.  (Applause.)  The fact is that everybody wants to be where the action is, and the United States of America is indeed the place where the action is.  (Applause.)
One of the biggest promises I made to the American people was to replace the disastrous NAFTA trade deal.  (Applause.)  In fact, unfair trade is perhaps the single biggest reason that I decided to run for President.  Following NAFTA’s adoption, our nation lost one in four manufacturing jobs.  Many politicians came and went, pledging to change or replace NAFTA, only to do so, and then absolutely nothing happened.  But unlike so many who came before me, I keep my promises.  We did our job.  (Applause.)
Six days ago, I replaced NAFTA and signed the brand-new U.S.-Mexico-Canada Agreement into law.  The USMCA will create nearly 100,000 new high-paying American auto jobs, and massively boost exports for our farmers, ranchers, and factory workers.  (Applause.)  It will also bring trade with Mexico and Canada to a much higher level, but also to be a much greater degree of fairness and reciprocity.  We will have that: fairness and reciprocity.  And I say that, finally, because it’s been many, many years that we were treated fairly on trade.  (Applause.)
_____
_____
The Special Note summarizes my overall thoughts about our economic situation
SPX at 3297.59 as this post is written 

Tuesday, February 4, 2020

VIX Weekly And Monthly Charts Since The Year 2000 – February 4, 2020 Update

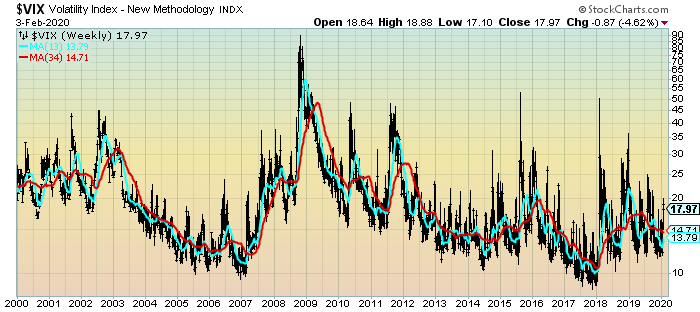
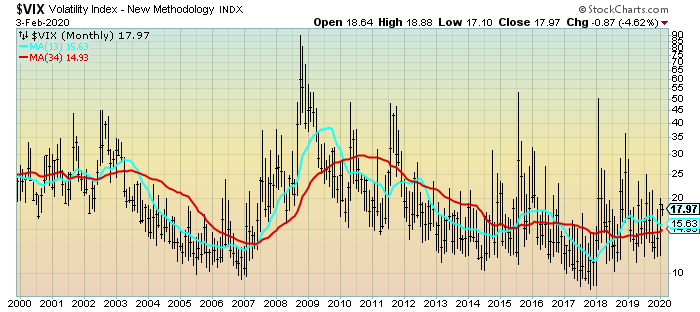
For reference purposes, below are two charts of the VIX from year 2000 through Monday’s (February 3, 2020) close, which had a closing value of 17.97.
Here is the VIX Weekly chart, depicted on a LOG scale, with the 13- and 34-week moving averages, seen in the cyan and red lines, respectively:
(click on chart to enlarge image)(chart courtesy of StockCharts.com; chart creation and annotation by the author)
VIX Weekly LOG
–
Here is the VIX Monthly chart, depicted on a LOG scale, with the 13- and 34-month moving average, seen in the cyan and red lines, respectively:
(click on chart to enlarge image)(chart courtesy of StockCharts.com; chart creation and annotation by the author)
VIX Monthly LOG
____
The Special Note summarizes my overall thoughts about our economic situation
SPX at 3248.92 as this post is written

Charts Of Equities’ Performance Since March 9, 2009 And January 1, 1980 – February 4, 2020 Update

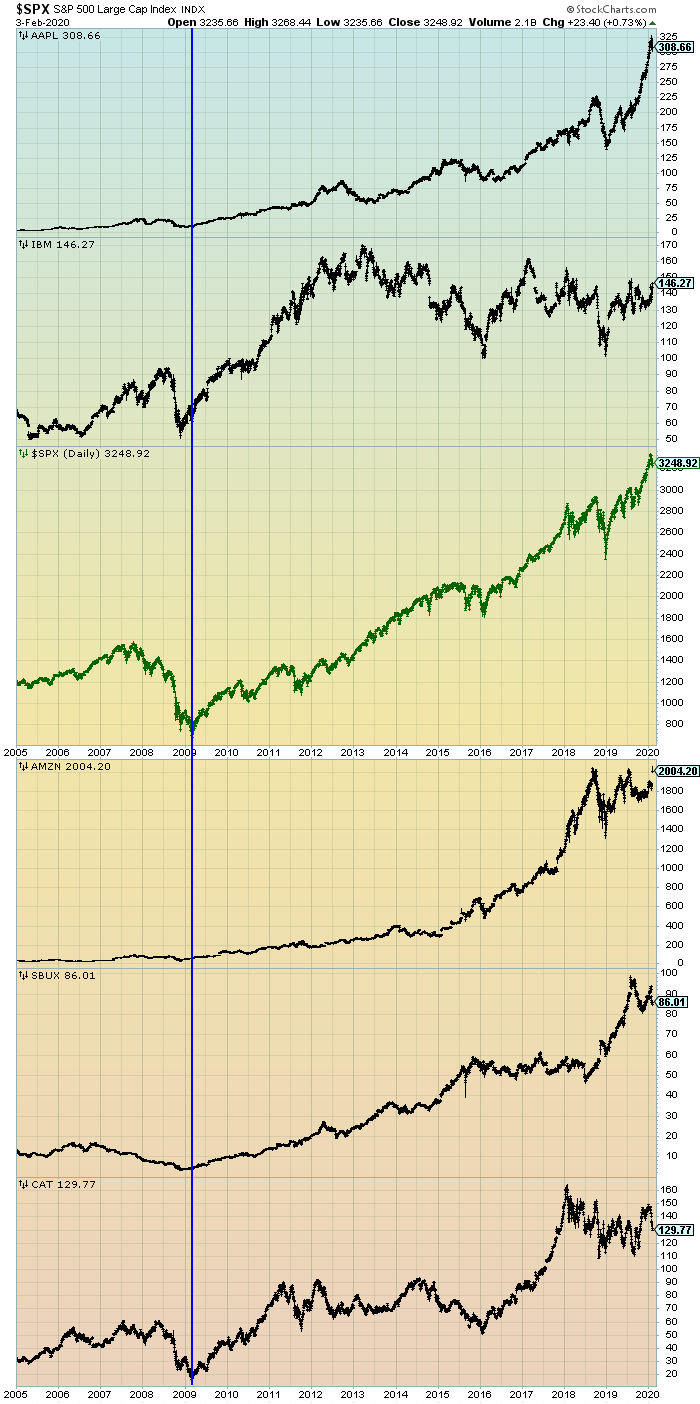
In the March 9, 2012 post (“Charts of Equities’ Performance Since March 9, 2009 And January 1, 1980“) I highlighted two charts for reference purposes.
Below are those two charts, updated through the latest daily closing price.
The first is a daily chart of the S&P500 (shown in green), as well as five prominent (AAPL, IBM, AMZN, SBUX, CAT) individual stocks, since 2005.  There is a blue vertical line that is very close to the March 6, 2009 low.  As one can see, both the S&P500 performance, as well as many stocks including the five shown, have performed strongly since the March 6, 2009 low:
(click on chart to enlarge image)(chart courtesy of StockCharts.com; chart creation and annotation by the author)
S&P500 and prominent stocks since 2005
–
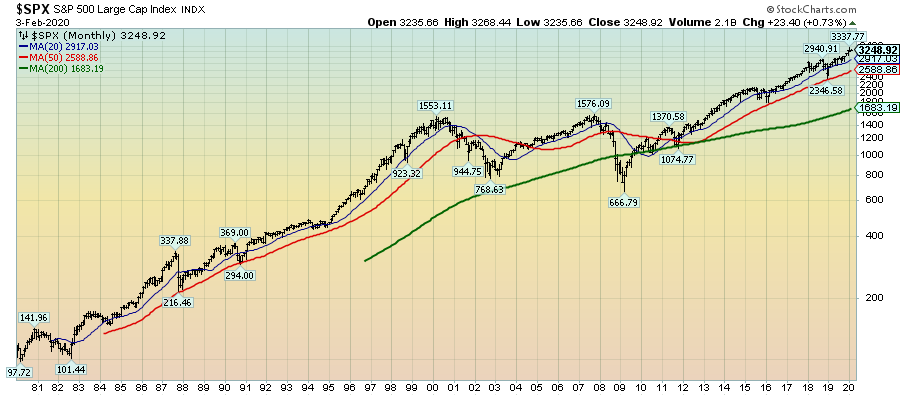
This next chart shows, on a monthly LOG basis, the S&P500 since 1980.  I find this chart notable as it provides an interesting long-term perspective on the S&P500′s performance.  The 20, 50, and 200-month moving averages are shown in blue, red, and green lines, respectively:
(click on chart to enlarge image)(chart courtesy of StockCharts.com; chart creation and annotation by the author)
S&P500 monthly LOG chart since 1980
_____
The Special Note summarizes my overall thoughts about our economic situation
SPX at 3248.92 as this post is written

Monday, February 3, 2020

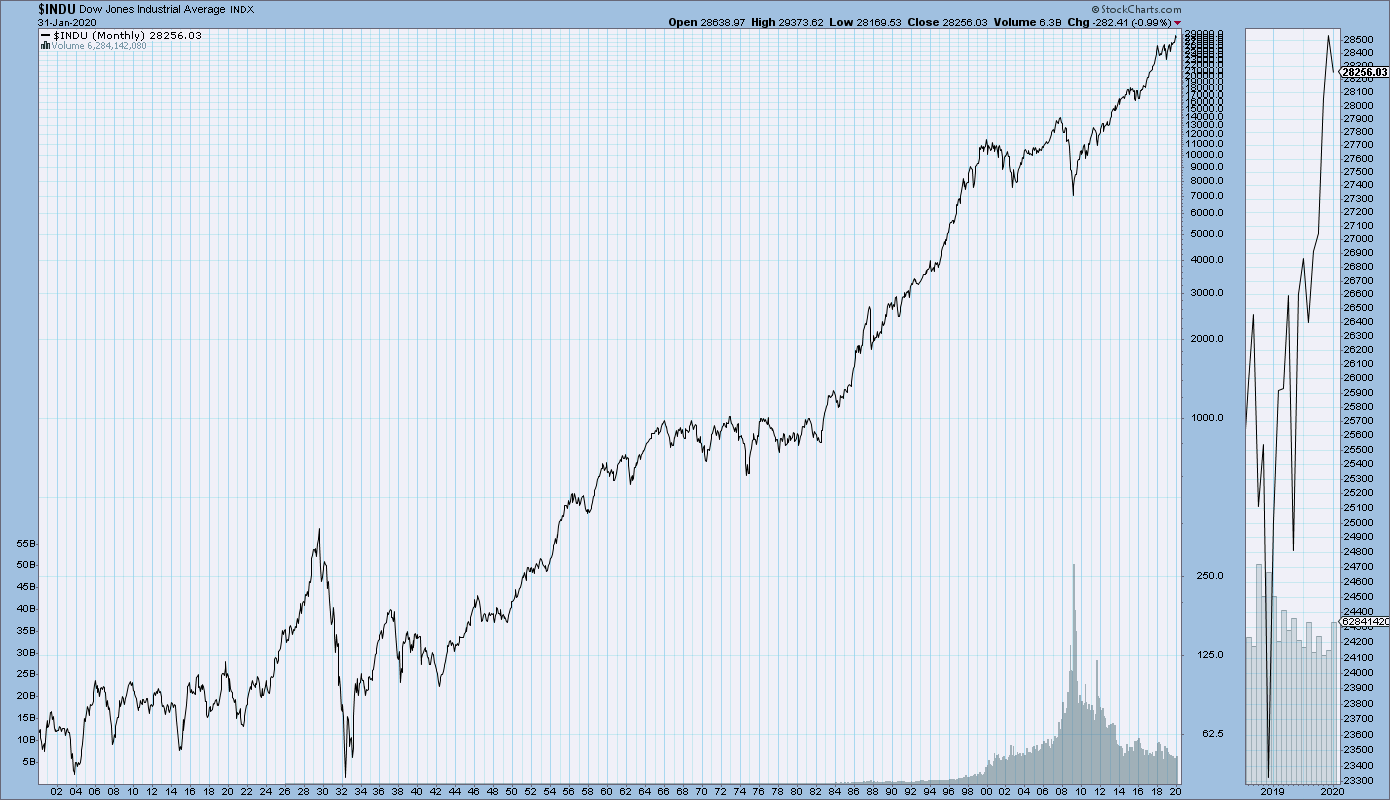
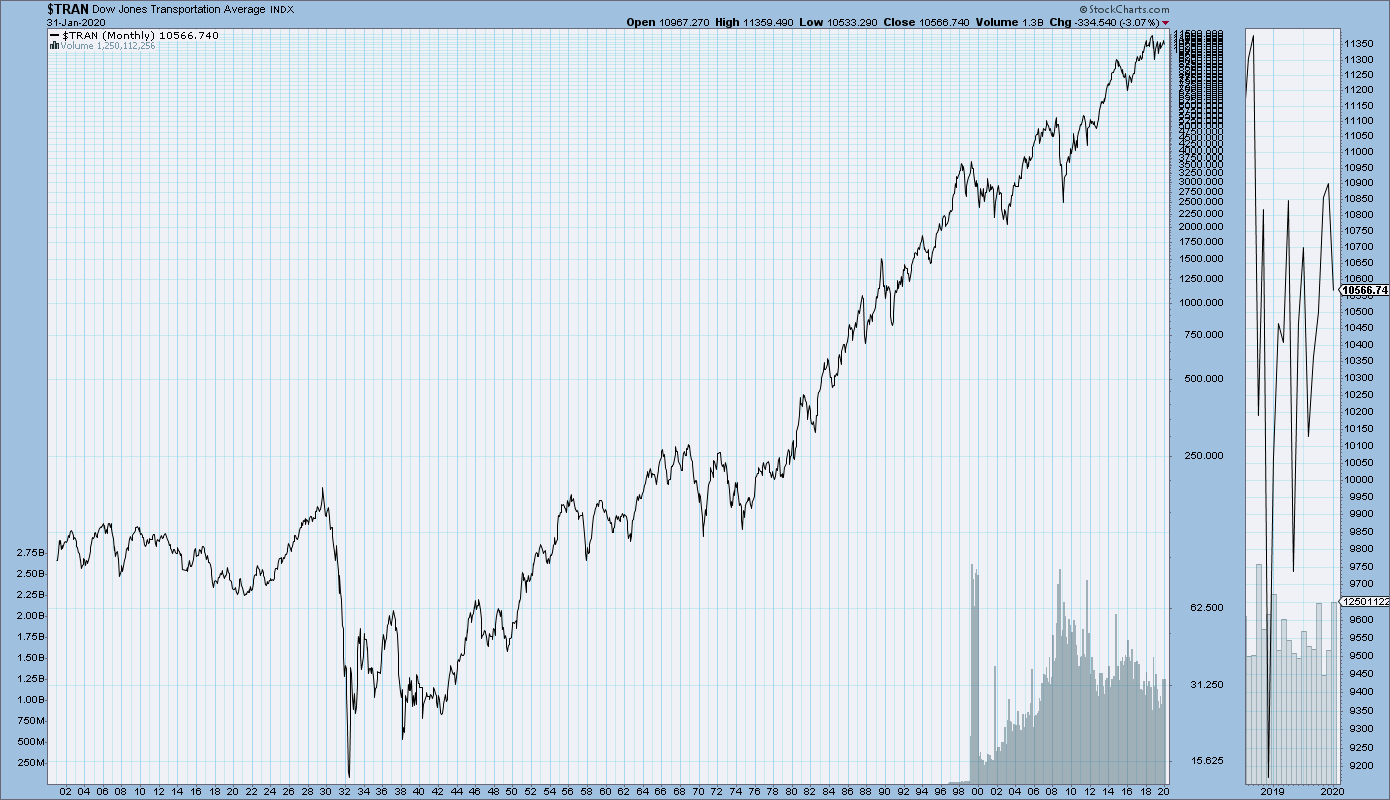
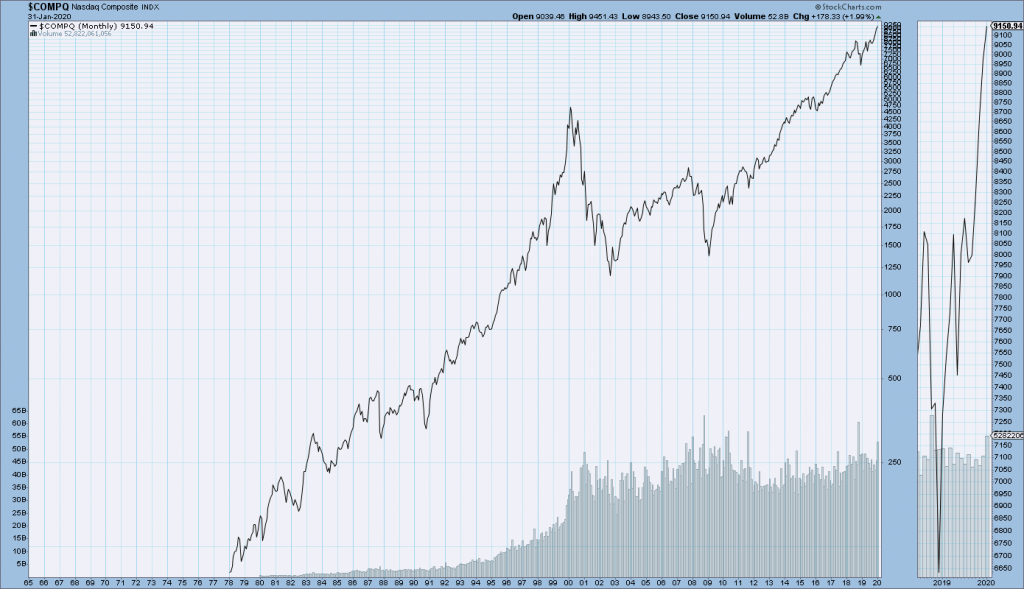
U.S. Stock Indexes – Ultra Long-Term Price Charts

StockCharts.com maintains long-term historical charts of various major stock market indices, interest rates, currencies, commodities, and economic indicators.
As a long-term reference, below are charts depicting various stock market indices for the dates shown.  All charts are depicted on a monthly basis using a LOG scale.
(click on charts to enlarge images)(charts courtesy of StockCharts.com)
The Dow Jones Industrial Average, from 1900 – January 31, 2020:
DJIA Monthly LOG since 1900
–
The Dow Jones Transportation Average, from 1900 – January 31, 2020:
DJTA monthly chart from 1900
–
The S&P500, from 1925 – January 31, 2020:
S&P500 chart since 1925
–
The Nasdaq Composite, from 1978 – January 31, 2020:
Nasdaq Composite chart since 1978
_____
The Special Note summarizes my overall thoughts about our economic situation
SPX at 3225.52 as this post is written

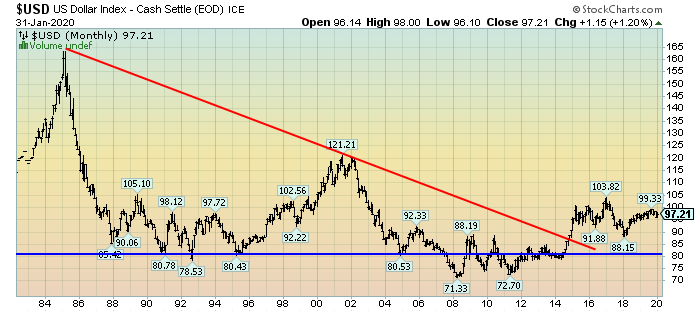
U.S. Dollar Decline – February 3, 2020 Update

U.S. Dollar weakness is a foremost concern of mine.  As such, I have extensively written about it.  I am very concerned that the actions being taken to “improve” our economic situation will dramatically weaken the Dollar.  Should the Dollar substantially decline from here, as I expect, the negative consequences will far outweigh any benefits.  The negative impact of a substantial Dollar decline can’t, in my opinion, be overstated.
The following three charts illustrate various technical analysis aspects of the U.S. Dollar, as depicted by the U.S. Dollar Index.
First, a look at the monthly U.S. Dollar from 1983.  This clearly shows a long-term weakness, with the blue line showing technical support until 2007, and the red line representing a (past) trendline:
(charts courtesy of StockCharts.com; annotations by the author)
(click on charts to enlarge images)
U.S.Dollar Monthly
–
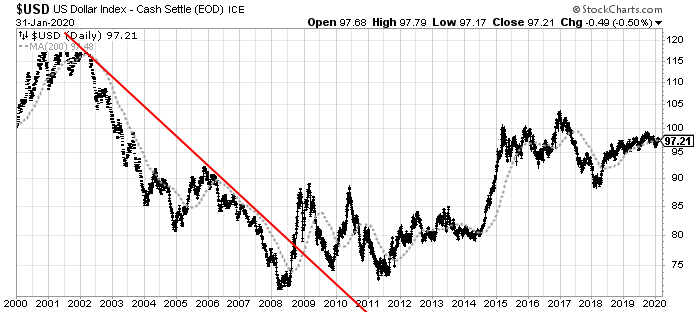
Next, another chart, this one focused on the daily U.S. Dollar since 2000 on a LOG scale.  The red line represents a (past) trendline.  The gray dotted line is the 200-day M.A. (moving average):
U.S. Dollar Daily chart
–
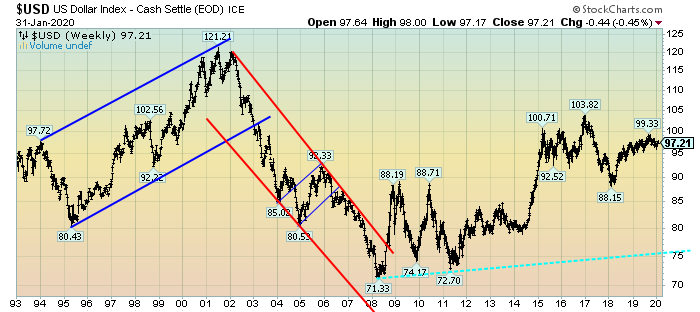
Lastly, a chart of the Dollar on a weekly LOG scale.  There are two clearly marked past channels, with possible technical support depicted by the dashed light blue line:
U.S. Dollar Weekly LOG
–
I will continue providing updates on this U.S. Dollar situation regularly as it deserves very close monitoring…
_____
The Special Note summarizes my overall thoughts about our economic situation
SPX at 3225.52 as this post is written

Future Consequences Stemming From The U.S. Economic Situation

Various surveys, economic growth projections, and market risk indicators continue to indicate U.S. economic growth and financial system stability for the foreseeable future.
However, there are various indications – many of which have been discussed on this site – that this very widely-held consensus is in many ways incorrect.  There are many exceedingly problematical financial conditions that continue to exist, some of which have grown in severity.  As well, numerous economic dynamics continue to be worrisome and many economic indicators portray facets of weak growth or outright decline.
Of paramount importance is the resulting level of risk and the future economic implications.
From an “all things considered” standpoint, I continue to believe the overall level of risk is at a fantastic level, one that is far greater than that experienced at any time in the history of the United States.
Cumulatively, these highly problematical conditions will lead to future upheaval.  The extent of the resolution of these problematical conditions will determine the ongoing viability of the financial system and economy as well as the resultant quality of living.
As I have previously written in “The U.S. Economic Situation” updates:
My analyses continues to indicate that the growing level of financial danger will lead to the next stock market crash that will also involve (as seen in 2008) various other markets as well.  Key attributes of this next crash is its outsized magnitude (when viewed from an ultra-long term historical perspective) and the resulting economic impact.  This next financial crash is of tremendous concern, as my analyses indicate it will lead to a Super Depression – i.e. an economy characterized by deeply embedded, highly complex, and difficult-to-solve problems.
_____
The Special Note summarizes my overall thoughts about our economic situation
SPX at 3225.52 as this post is written

Saturday, February 1, 2020

Another Recession Probability Indicator – Updated Through Q3 2019

Each month I have been highlighting various estimates of U.S. recession probabilities.  The latest update was that of January 8, 2020, titled “Recession Probability Models – January 2020.”
While I don’t agree with the methodologies employed or the probabilities of impending economic weakness as depicted by these and other estimates, I do believe that the results of these models and estimates should be monitored.
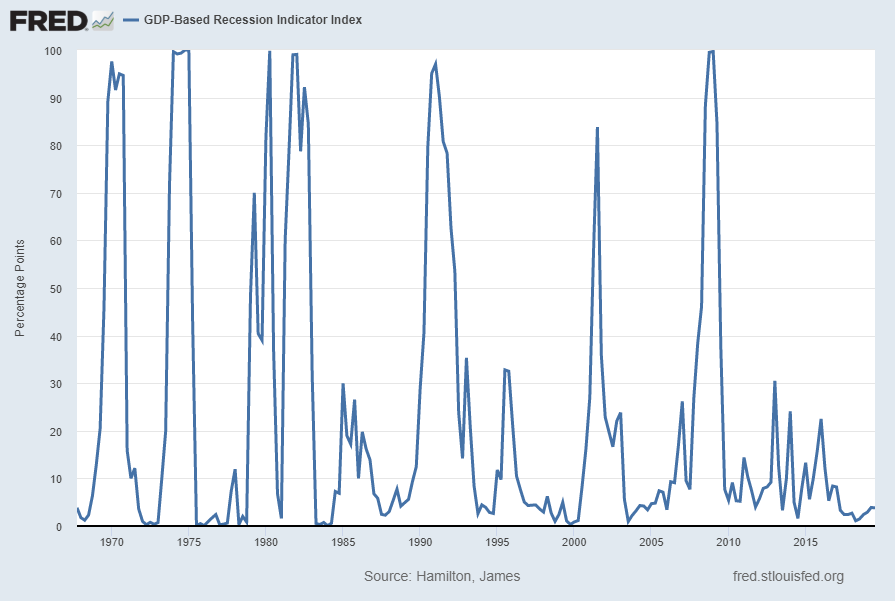
Another probability of recession is provided by James Hamilton, and it is titled “GDP-Based Recession Indicator Index.”  A description of this index, as seen in FRED:
This index measures the probability that the U.S. economy was in a recession during the indicated quarter. It is based on a mathematical description of the way that recessions differ from expansions. The index corresponds to the probability (measured in percent) that the underlying true economic regime is one of recession based on the available data. Whereas the NBER business cycle dates are based on a subjective assessment of a variety of indicators that may not be released until several years after the event , this index is entirely mechanical, is based solely on currently available GDP data and is reported every quarter. Due to the possibility of data revisions and the challenges in accurately identifying the business cycle phase, the index is calculated for the quarter just preceding the most recently available GDP numbers. Once the index is calculated for that quarter, it is never subsequently revised. The value at every date was inferred using only data that were available one quarter after that date and as those data were reported at the time.
If the value of the index rises above 67% that is a historically reliable indicator that the economy has entered a recession. Once this threshold has been passed, if it falls below 33% that is a reliable indicator that the recession is over.
Additional reference sources for this index and its construction can be seen in the Econbrowser post of February 14, 2016 titled “Recession probabilities” as well as on the “The Econbrowser Recession Indicator Index” page.
Below is a chart depicting the most recent value of 3.80%, for the third quarter of 2019, last updated on January 31, 2020 (after the January 30, 2020 Gross Domestic Product, Fourth Quarter 2019 (Advance Estimate) (pdf)):
GDP-Based Recession Indicator Index
source:  Hamilton, James, GDP-Based Recession Indicator Index [JHGDPBRINDX], retrieved from FRED, Federal Reserve Bank of St. Louis on January 31, 2020:
https://research.stlouisfed.org/fred2/series/JHGDPBRINDX
_________
I post various indicators and indices because I believe they should be carefully monitored.  However, as those familiar with this site are aware, I do not necessarily agree with what they depict or imply.
_____
The Special Note summarizes my overall thoughts about our economic situation
SPX at 3225.52 as this post is written