Monday, September 14, 2020

Charts Indicating Economic Weakness – September 2020


U.S. Economic Indicators

Throughout this site there are many discussions of economic indicators.  This post is the latest in a series of posts indicating U.S. economic weakness or a notably low growth rate.

The level and trend of economic growth is especially notable at this time. As seen in various measures and near-term projections, the U.S. economy is undergoing an outsized level of economic contraction. However, most people believe that this historic level of contraction will be temporary in nature and that an economic rebound will start in the third quarter of 2020. 

As seen in the September 2020 Wall Street Journal Economic Forecast Survey the consensus (average estimate) among various economists is for -4.19% GDP growth in 2020, 4.00% GDP growth in 2021, and 3.13% GDP growth in 2022. 

Charts Indicating U.S. Economic Weakness

Below are a small sampling of charts that depict weak growth or contraction, and a brief comment for each:

The Weekly Economic Index (WEI)

A recently-introduced indicator, the Weekly Economic Index, is an economic indicator that is a composite of 10 different weekly indicators. It is (purportedly) designed to provide a timely depiction of the U.S. economic trend. As seen below, it depicts the severity of the recent plunge in economic activity.

The Weekly Economic Index (WEI) with a value of -4.26, updated as of September 10, 2020 (incorporating data through September 5, 2020):
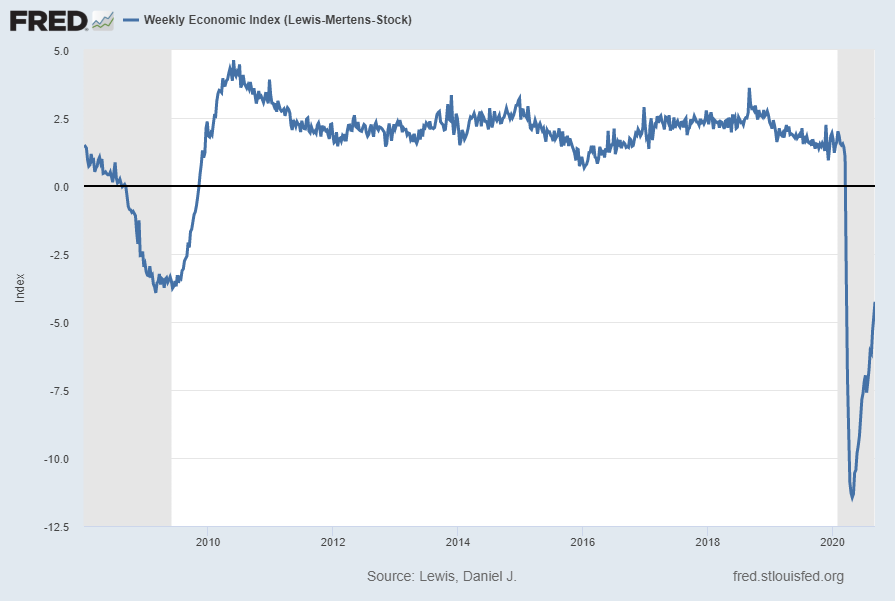
Weekly Economic Index WEI

source:  Lewis, Daniel J., Mertens, Karel and Stock, James H., Weekly Economic Index (Lewis-Mertens-Stock) [WEI], retrieved from FRED, Federal Reserve Bank of St. Louis, accessed September 10, 2020; https://fred.stlouisfed.org/series/WEI

__

Total Transportation Services Index (TSITTL)

“Total Transportation Services Index” (TSITTL), like other transportation measures, is exhibiting recent substantial weakness. Shown below is this measure with last value of 69.3 through June, last updated September 11, 2020:
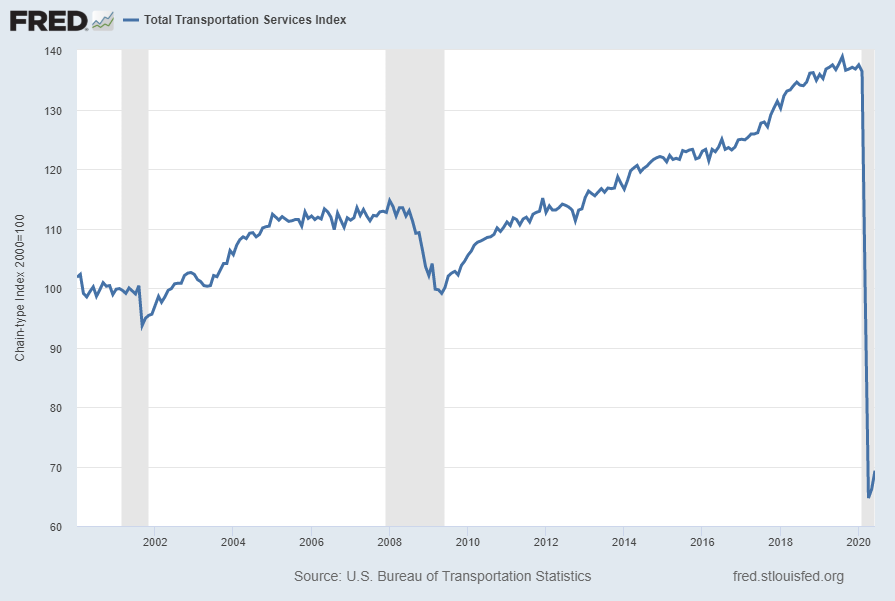
TSITTL

Below is this measure displayed on a “Percent Change From Year Ago” basis with value -49.3%:
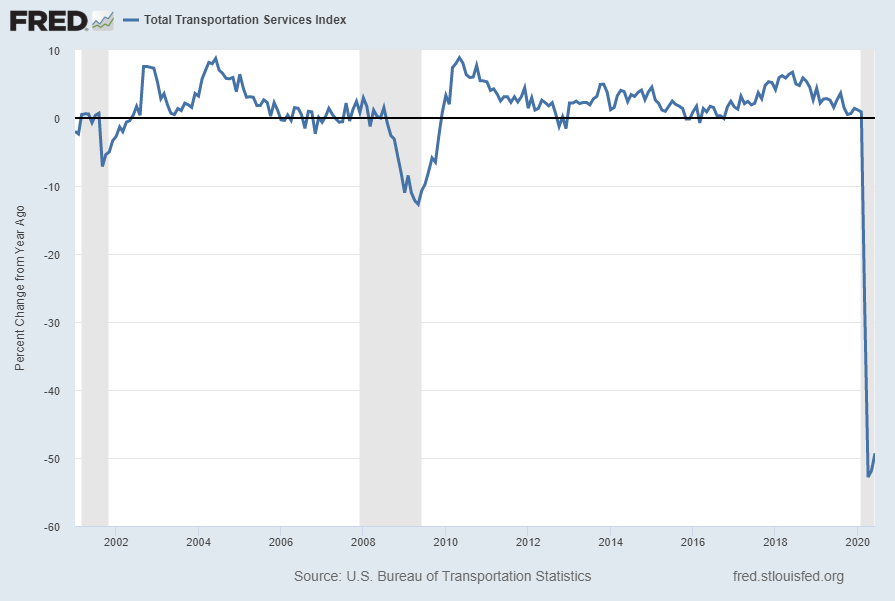
TSITTL Percent Change From Year Ago

source: U.S. Bureau of Transportation Statistics, Total Transportation Services Index [TSITTL], retrieved from FRED, Federal Reserve Bank of St. Louis; accessed September 13, 2020; https://fred.stlouisfed.org/series/TSITTL

__

Truck Tonnage (TRUCKD11)

“Truck Tonnage” (TRUCKD11), like other transportation measures, is exhibiting recent weakness. Shown below is this measure with last value of 111.4 through June, last updated August 18, 2020:
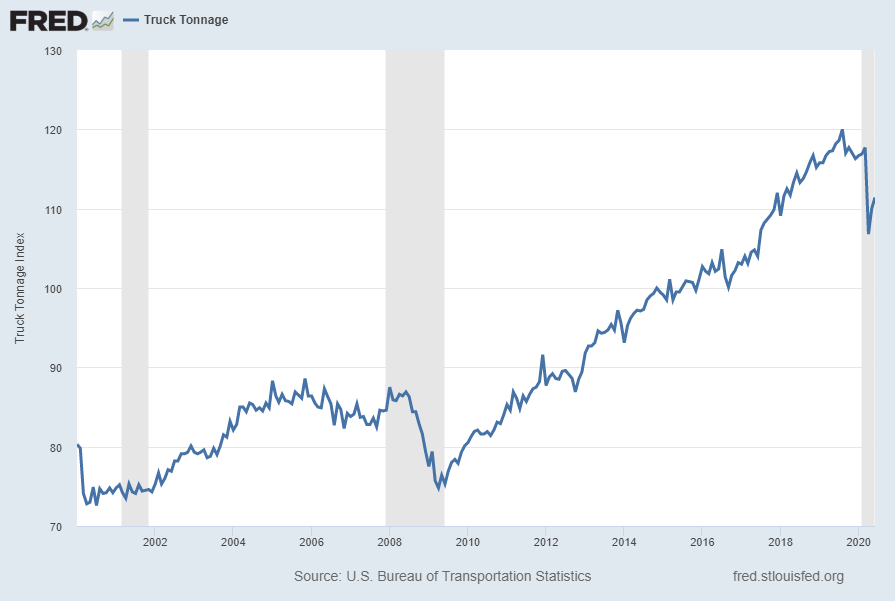
Truck Tonnage chart TRUCKD11

Below is this measure displayed on a “Percent Change From Year Ago” basis with value -5.8%:
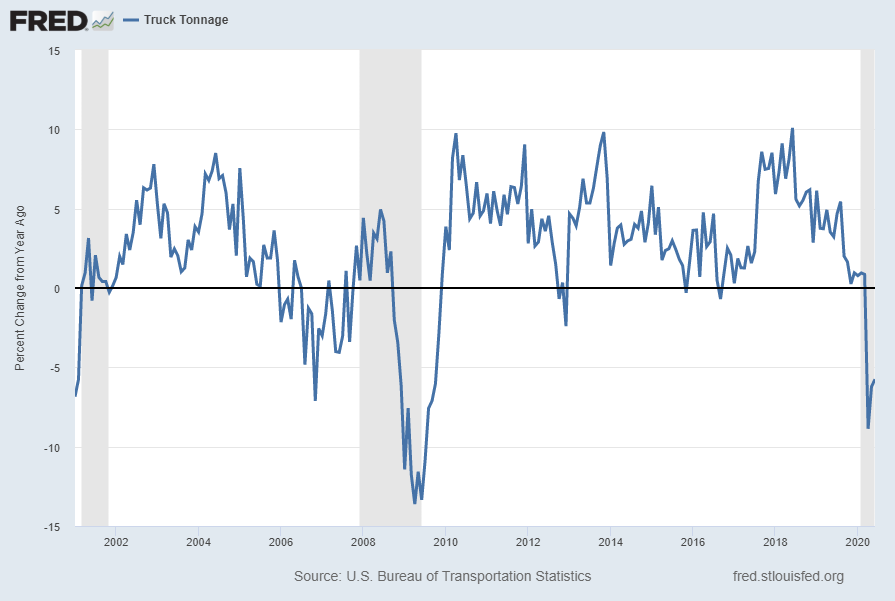
Truck Tonnage chart Percent Change From Year Ago

source: U.S. Bureau of Transportation Statistics, Truck Tonnage [TRUCKD11], retrieved from FRED, Federal Reserve Bank of St. Louis; accessed September 10, 2020: https://fred.stlouisfed.org/series/TRUCKD11

__

Vehicle Miles Traveled (TRFVOLUSM227SFWA)

Another indication of transportation and mobility is the Vehicle Miles Traveled indicator.

Shown below is this measure with last value of 231,305 (Millions of Miles) through June, last updated August 21, 2020:
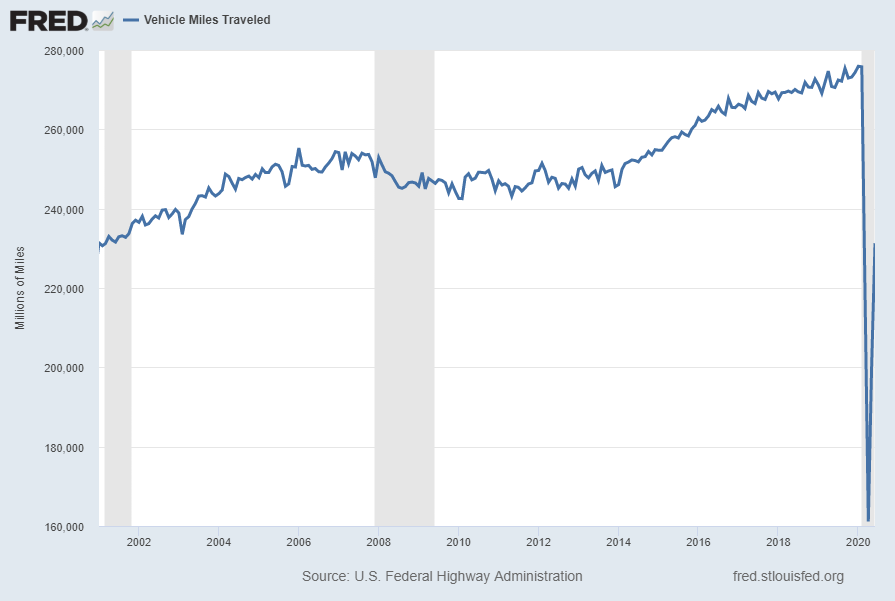
Vehicle Miles Traveled (TRFVOLUSM227SFWA)

Below is this measure displayed on a “Percent Change From Year Ago” basis with value -14.5%:
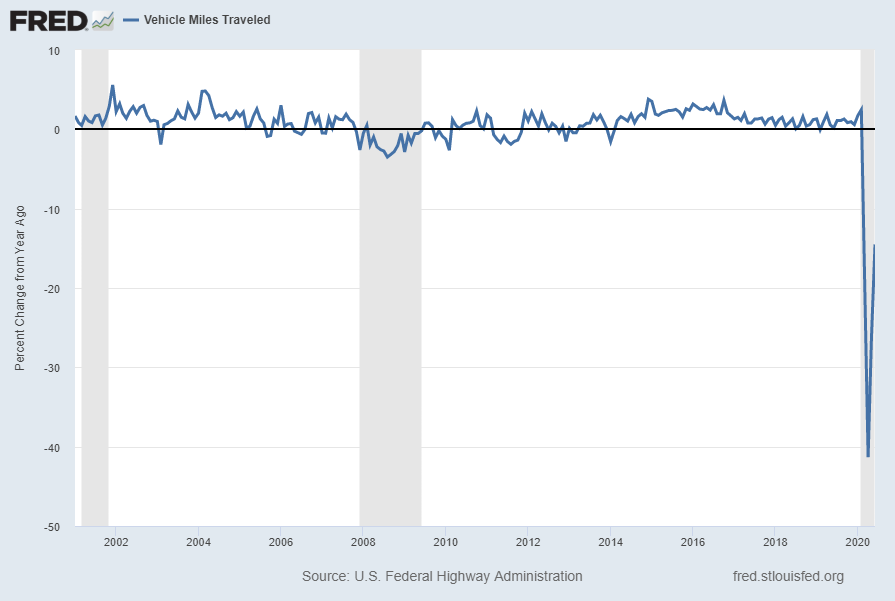
Vehicle Miles Traveled (TRFVOLUSM227SFWA) Percent Change From Year Ago

source: U.S. Federal Highway Administration, Vehicle Miles Traveled [TRFVOLUSM227SFWA], retrieved from FRED, Federal Reserve Bank of St. Louis; accessed September 10, 2020: https://fred.stlouisfed.org/series/TRFVOLUSM227SFWA

__

Unemployment

I have written extensively concerning unemployment, as the current and future unemployment issue is of tremendous importance.

Of note, the current unemployment situation, as depicted by various statistics, is in many ways incomparable to past periods given various dynamics of the current (since early 2020) situation and how these dynamics are being reflected and otherwise portrayed.

However, even given these issues, various metrics indicate that current unemployment is very high from a long-term historical perspective.

My analyses indicate that the underlying dynamics of the unemployment situation remain exceedingly worrisome, especially with regard to the future.  These dynamics are numerous and complex, and greatly lack recognition and understanding, especially as how from an “all-things-considered” standpoint they will evolve in an economic and societal manner.  Further discussion of the long-term U.S. employment situation can be seen on the “U.S. Employment Trends” page.

While there are many charts that can be shown, one that depicts a worrisome trend is the Employment-Population Ratio for those ages 25 – 54 years.  [The Employment-Population Ratio is the Civilian Employed divided by the Civilian Noninstitutional Population].  Among disconcerting aspects of this measure is the recent plunge as well as the long-term (most notably the post-2000) trend, especially given this demographic segment.

The current value as of the September 4, 2020 update (reflecting data through the August employment report) is 75.3%:
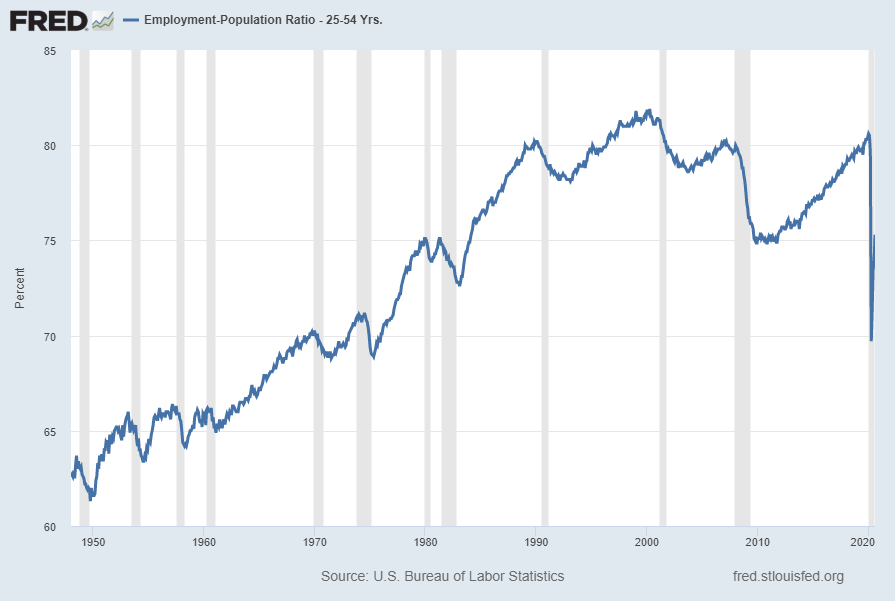
Employment-Population Ratio ages 25-54 years LNS12300060

Data Source:  U.S. Bureau of Labor Statistics, Employment Population Ratio: 25 – 54 years [LNS12300060], retrieved from FRED, Federal Reserve Bank of St. Louis, accessed July 11, 2020: https://fred.stlouisfed.org/series/LNS12300060

__

Other Indicators

As mentioned previously, many other indicators discussed on this site indicate economic weakness or economic contraction, if not outright (gravely) problematical economic conditions.

_____

The Special Note summarizes my overall thoughts about our economic situation

SPX at 3340.97 as this post is written

Thursday, September 10, 2020

The September 2020 Wall Street Journal Economic Forecast Survey

The September 2020 Wall Street Journal Economic Forecast Survey was published on September 10, 2020. The headline is “WSJ Survey: Overall Economy Is Recovering Faster Than Economists Expected.”

I found numerous items to be notable – although I don’t necessarily agree with them – both within the article and in the “Economist Q&A” section.

An excerpt:

The projected rebound for the third quarter would recoup about half of the output lost in the first half of the year. To return to the previous peak recorded in the final quarter of last year, the economy would need to grow at a roughly 24% rate again in the fourth quarter of this year. Economists see that as unlikely: Their forecast for fourth-quarter growth is for a 4.9% annual rate, suggesting the recovery will be protracted.

The average forecast called for GDP to shrink 4.2% this year, measured from the fourth quarter of 2019, an improvement from the 5.3% contraction predicted in last month’s survey.

Nonetheless, the U.S. economy would still be on track to contract in 2020 by the most since contemporary records began in 1948, as measured from the fourth quarter of the prior year. By comparison, in the fourth quarter of 2008—during the financial crisis—GDP contracted just 2.8% from the prior year.

As seen in the “Recession Probability” section, the average response as to whether the economy will be in a recession within the next 12 months was 36.93%. The individual estimates, of those who responded, ranged from 0% to 100%.  For reference, the average response in August’s survey was 37.04%.

As stated in the article, the survey’s 62 respondents were academic, financial and business economists.  The survey was conducted September 4 – September 8. Not every economist answered every question.

Economic Forecasts

The current average forecasts among economists polled include the following:

GDP:

full-year 2020:  -4.19%

full-year 2021:  4.00%

full-year 2022:  3.13%

full-year 2023:  2.53%

Unemployment Rate:

December 2020: 8.05%

December 2021: 6.34%

December 2022: 5.20%

December 2023: 4.69%

10-Year Treasury Yield:

December 2020: .77%

December 2021: 1.13%

December 2022: 1.54%

December 2023: 1.89%

CPI:

December 2020:  .93%

December 2021:  1.98%

December 2022:  2.06%

December 2023:  2.17%

Crude Oil  ($ per bbl):

for 12/31/2020: $41.54

for 12/31/2021: $46.92

for 12/31/2022: $51.37

(note: I highlight this WSJ Economic Forecast survey each month; commentary on past surveys can be found under the “Economic Forecasts” label)

_____

I post various economic forecasts because I believe they should be carefully monitored.  However, as those familiar with this site are aware, I do not necessarily agree with many of the consensus estimates and much of the commentary in these forecast surveys.

_____

The Special Note summarizes my overall thoughts about our economic situation

SPX at 3387.50 as this post is written

Wednesday, September 9, 2020

Recession Probability Models – September 2020

While there has been an official declaration of U.S. recession on June 8, 2020 (as discussed in the “Recession Declared For The United States By The NBER BCDC” post), the following discussion is warranted for many reasons. Among the reasons is that two of the measures mentioned below are “forward-looking” in nature.

There are a variety of economic models that are supposed to predict the probabilities of recession.

While I don’t agree with the methodologies employed or probabilities of impending economic weakness as depicted by the following two models, I think the results of these models should be monitored.

Please note that each of these models is updated regularly, and the results of these – as well as other recession models – can fluctuate significantly.

The first is the “Yield Curve as a Leading Indicator” from the New York Federal Reserve.  I wrote a post concerning this measure on March 1, 2010, titled “The Yield Curve as a Leading Indicator.”

Currently (last updated September 3, 2020 using data through August 2020) this “Yield Curve” model shows a 18.9279% probability of a recession in the United States twelve months ahead.  For comparison purposes, it showed a 19.981% probability through July 2020, and a chart going back to 1960 is seen at the “Probability Of U.S. Recession Predicted by Treasury Spread.” (pdf)

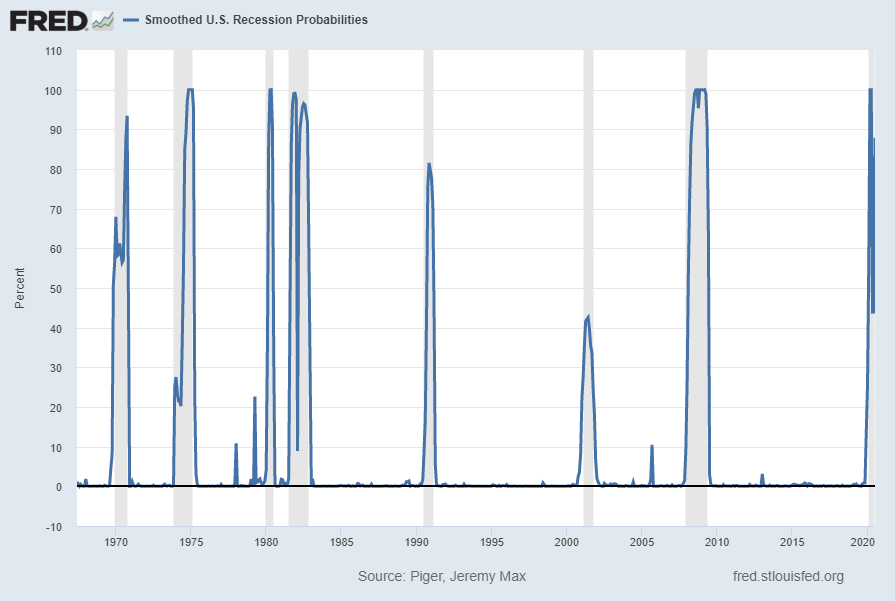
The second model is from Marcelle Chauvet and Jeremy Piger.  This model is described on the St. Louis Federal Reserve site (FRED) as follows:

Smoothed recession probabilities for the United States are obtained from a dynamic-factor markov-switching model applied to four monthly coincident variables: non-farm payroll employment, the index of industrial production, real personal income excluding transfer payments, and real manufacturing and trade sales. This model was originally developed in Chauvet, M., “An Economic Characterization of Business Cycle Dynamics with Factor Structure and Regime Switching,” International Economic Review, 1998, 39, 969-996. (http://faculty.ucr.edu/~chauvet/ier.pdf)

Additional details and explanations can be seen on the “U.S. Recession Probabilities” page.

This model, last updated on September 1, 2020 currently shows a 87.85% probability using data through July 2020.

Here is the FRED chart (last updated September 1, 2020):

Smoothed recession probabilities for the United States

Data Source:  Piger, Jeremy Max and Chauvet, Marcelle, Smoothed U.S. Recession Probabilities [RECPROUSM156N], retrieved from FRED, Federal Reserve Bank of St. Louis, accessed September 9, 2020:  
http://research.stlouisfed.org/fred2/series/RECPROUSM156N

The two models featured above can be compared against measures seen in recent posts.  For instance, as seen in the August 14, 2020 post titled “The August 2020 Wall Street Journal Economic Forecast Survey“ economists surveyed averaged a 37.04% probability of a U.S. recession within the next 12 months.

_____

The Special Note summarizes my overall thoughts about our economic situation

SPX at 3398.96 as this post is written

Tuesday, September 8, 2020

NFIB Small Business Optimism – August 2020

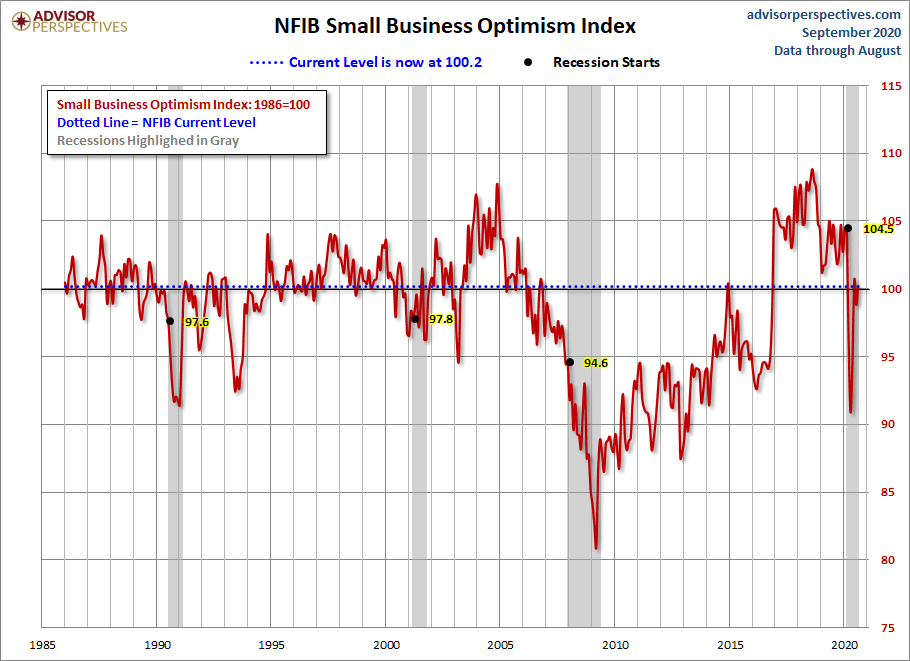
The August NFIB Small Business Optimism report was released today, September 8, 2020. The headline of the Economic Trends report is “Small Business Optimism Index Rebounds, Exceeding Historical Average.”

The Index of Small Business Optimism increased by 1.4 points to 100.2.

Here is an excerpt that I find particularly notable (but don’t necessarily agree with):

Twenty-one percent of owners selected “finding qualified labor” as their top business problem, with 41% in construction where the unavailability of qualified workers is slowing new home production.

The frequency of reports of positive profit trends rose 7 points to a net negative 25% reporting quarter on quarter profit improvement. Among owners reporting weaker profits, 55% blamed weak sales, 8% cited price changes, 4% cited material costs, and 3% cited labor costs. For owners reporting higher profits, 65% credited sales volumes.

Three percent of owners reported that all their borrowing needs were not satisfied. Thirty-one percent reported all credit needs were met and 53% said they were not interested in a loan. A net 1% reported their last loan was harder to get than in previous attempts.

Here is a chart of the NFIB Small Business Optimism chart, from the Advisor Perspectives’ September 8 post titled “NFIB Small Business Survey…“:

Further details regarding small business conditions can be seen in the full August 2020 NFIB Small Business Economic Trends (pdf) report.

_____

The Special Note summarizes my overall thoughts about our economic situation

SPX at 3331.84 as this post is written

Building Financial Danger – September 8, 2020 Update

My overall analysis indicates a continuing elevated and growing level of financial danger which contains many worldwide and U.S.-specific “stresses” of a very complex nature. I have written numerous posts on this site concerning both ongoing and recent “negative developments.”  These developments, as well as other exceedingly problematical conditions, have presented a highly perilous economic environment that endangers the overall financial system.

Also of ongoing immense importance is the existence of various immensely large asset bubbles, a subject of which I have extensively written.  While all of these asset bubbles are wildly pernicious and will have profound adverse future implications, hazards presented by the bond market bubble are especially notable.
Predicting the specific timing and extent of a stock market crash is always difficult, and the immense complexity of today’s economic situation makes such a prediction even more challenging. With that being said, my analyses continue to indicate that a near-term exceedingly large (from an ultra long-term perspective) stock market crash – that would also involve (as seen in 2008) various other markets – will occur. [note: the “next crash” and its aftermath has paramount significance and implications, as discussed in the post of January 6, 2012 titled “The Next Crash And Its Significance“ and various subsequent posts in the “Economic Depression” label]

As reference, below is a daily chart since 2008 of the S&P500 (through September 4, 2020 with a last price of 3426.96), depicted on a LOG scale, indicating both the 50dma and 200dma as well as price labels:

(click on chart to enlarge image)(chart courtesy of StockCharts.com; chart creation and annotation by the author)

S&P500 Daily LOG Since 2008

_____

The Special Note summarizes my overall thoughts about our economic situation

SPX at 3357.15 as this post is written

“Not In Labor Force” Statistic – As Of September 2020

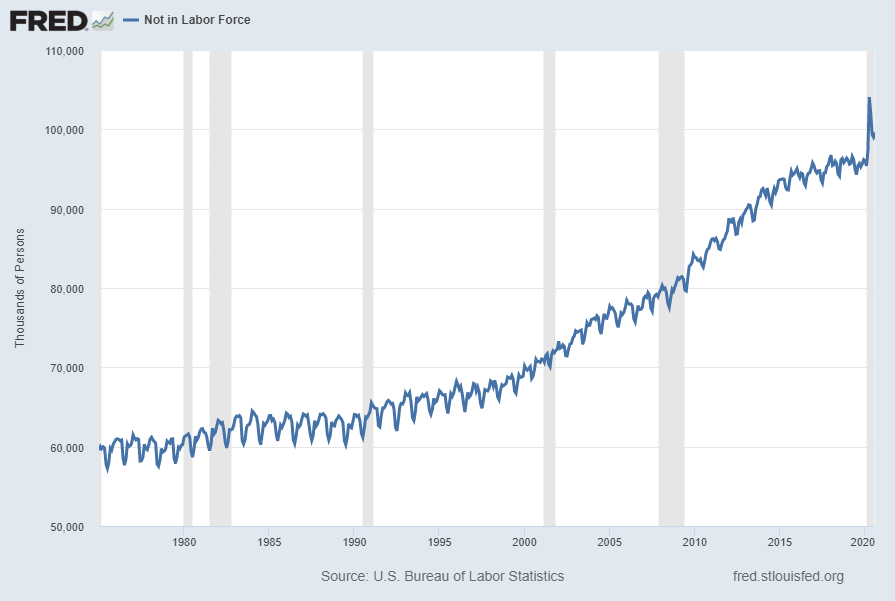
In the November 13, 2013 post (“Not In Labor Force Statistic“) I featured editorial commentary from the Wall Street Journal, as well as an accompanying long-term chart, with regard to the number of people not working.

Also, on February 9, 2015 I wrote another post titled “Unemployment And The ‘Not In Labor Force’ Statistic,” in which I discussed various facets of this measure.

Below is an updated chart regarding this statistic.  The current figure, last updated on September 4, 2020 depicting data through August 2020, is 99.592 million people (Not Seasonally Adjusted):

Not In Labor Force

Data Source: U.S. Bureau of Labor Statistics, Not in Labor Force [LNU05000000], retrieved from FRED, Federal Reserve Bank of St. Louis; accessed September 8, 2020: 
https://fred.stlouisfed.org/series/LNU05000000

_____

The Special Note summarizes my overall thoughts about our economic situation

SPX at 3357.15 as this post is written


Friday, September 4, 2020

Average Hourly Earnings Trends

I have written many blog posts concerning the worrisome trends in income and earnings.

Along these lines, one of the measures showing disconcerting trends is that of hourly earnings.

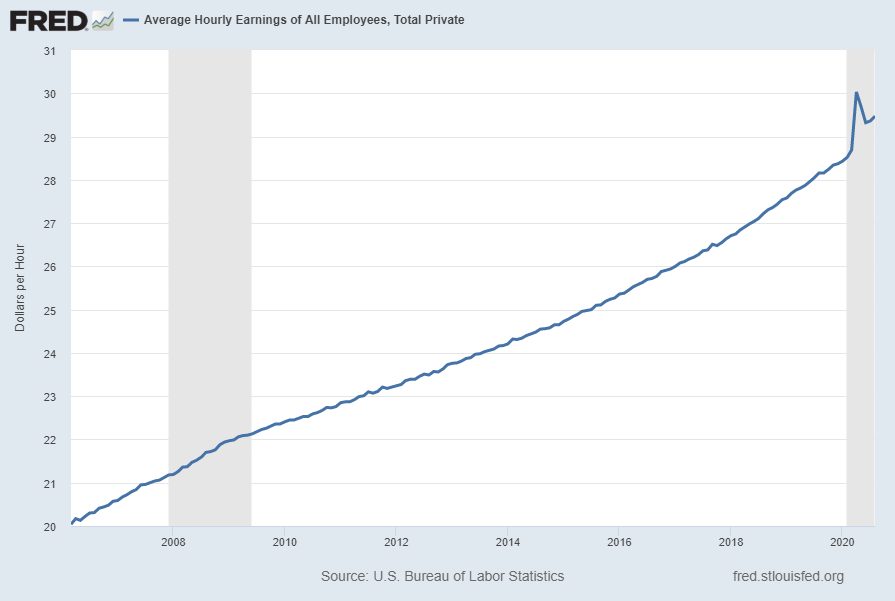
While the concept of hourly earnings can be defined and measured in a variety of ways, below are a few charts that I believe broadly illustrate problematic trends.

The first chart depicts Average Hourly Earnings Of All Employees: Total Private (FRED series CES0500000003)(current value = $29.47):

(click on chart to enlarge image)(chart last updated 9-4-20)

Average Hourly Earnings

Data Source: FRED, Federal Reserve Economic Data, Federal Reserve Bank of St. Louis: Average Hourly Earnings of All Employees:  Total Private [CES0500000003] ; U.S. Department of Labor: Bureau of Labor Statistics; accessed September 4, 2020: 
http://research.stlouisfed.org/fred2/series/CES0500000003

This next chart depicts this same measure on a “Percentage Change From A Year Ago” basis.   While not totally surprising, I find the decline from 2009 and subsequent trend to be disconcerting:

(click on chart to enlarge image)(chart last updated 9-4-20)

Average Hourly Earnings percent change from year ago

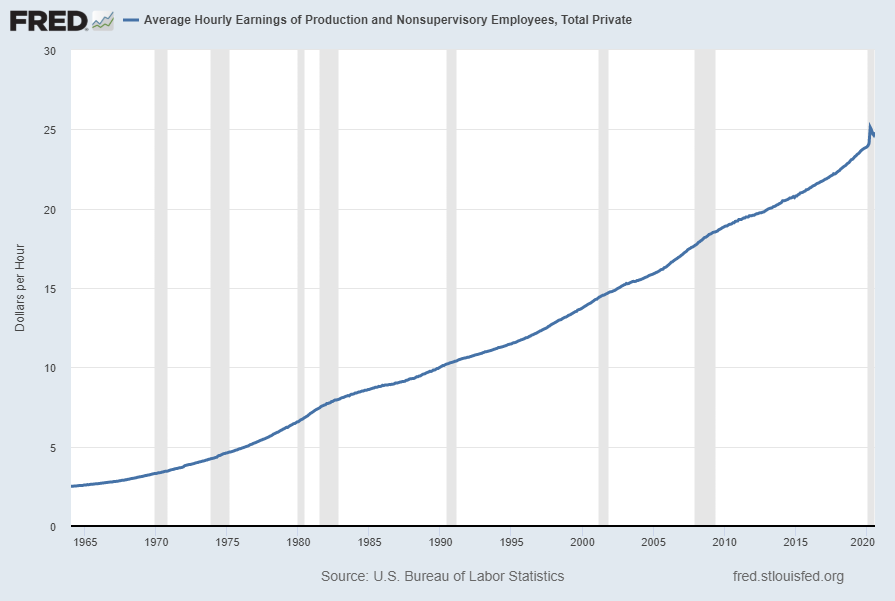
There are slightly different measures available from a longer-term perspective. Pictured below is another measure, the Average Hourly Earnings of Production and Nonsupervisory Employees – Total Private (FRED series AHETPI)(current value = $24.81):

(click on chart to enlarge image)(chart last updated 9-4-20)

AHETPI Average Hourly Earnings

Data Source: FRED, Federal Reserve Economic Data, Federal Reserve Bank of St. Louis: Average Hourly Earnings of Production and Nonsupervisory Employees:  Total Private [AHETPI] ; U.S. Department of Labor: Bureau of Labor Statistics;  accessed September 4, 2020: 
http://research.stlouisfed.org/fred2/series/AHETPI

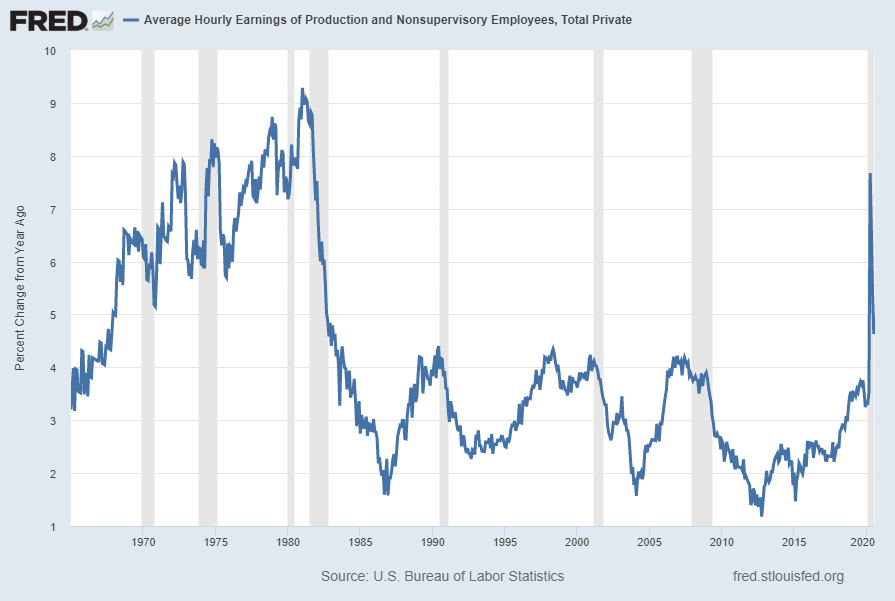
Pictured below is this AHETPI measure on a “Percentage Change From A Year Ago” basis.   While not totally surprising, I find the decline from 2009 and subsequent trend to be disconcerting:

(click on chart to enlarge image)(chart last updated 9-4-20)

AHETPI Average Hourly Earnings percent change from Year Ago

I will continue to actively monitor these trends, especially given the post-2009 dynamics.

_________

I post various economic indicators and indices because I believe they should be carefully monitored.  However, as those familiar with this site are aware, I do not necessarily agree with what they depict or imply.

_____

The Special Note summarizes my overall thoughts about our economic situation

SPX at 3406.58 this post is written