Monday, May 1, 2023

VIX Weekly And Monthly Charts Since The Year 2000 – May 1, 2023 Update

For reference purposes, below are two charts of the VIX from year 2000 through the May 1, 2023 close, which had a value of 16.08.

Here is the VIX Weekly chart, depicted on a LOG scale, with the 13- and 34-week moving averages, seen in the cyan and red lines, respectively:

(click on chart to enlarge image)(chart courtesy of StockCharts.com; chart creation and annotation by the author)

VIX Weekly LOG 16.08

–

Here is the VIX Monthly chart, depicted on a LOG scale, with the 13- and 34-month moving average, seen in the cyan and red lines, respectively:

(click on chart to enlarge image)(chart courtesy of StockCharts.com; chart creation and annotation by the author)
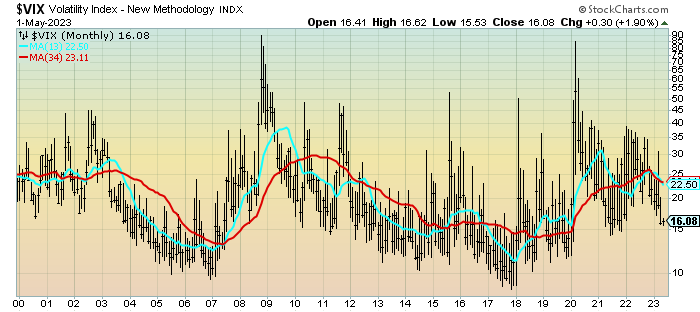
VIX Monthly LOG 16.08

____

The Special Note summarizes my overall thoughts about our economic situation

SPX at 4167.87 as this post is written

S&P500 Charts Since 2009 And 1980 – May 1, 2023 Update

In the March 9, 2012 post (“Charts of Equities’ Performance Since March 9, 2009 And January 1, 1980“) I highlighted two charts for reference purposes.

Below are those two charts, updated through the latest daily closing price.

The first is a daily chart of the S&P500 (shown in green), as well as five prominent (AAPL, IBM, AMZN, SBUX, CAT) individual stocks, since 2005.  There is a blue vertical line that is very close to the March 6, 2009 low.  As one can see, both the S&P500 performance, as well as many stocks including the five shown, have performed strongly since the March 6, 2009 low:

(click on chart to enlarge image)(chart courtesy of StockCharts.com; chart creation and annotation by the author)

S&P500 and prominent stocks since 2005

–

This next chart shows, on a monthly LOG basis, the S&P500 since 1980.  I find this chart notable as it provides an interesting long-term perspective on the S&P500′s performance.  The 20, 50, and 200-month moving averages are shown in blue, red, and green lines, respectively:

(click on chart to enlarge image)(chart courtesy of StockCharts.com; chart creation and annotation by the author)

S&P500 Monthly Since 1980

_____

The Special Note summarizes my overall thoughts about our economic situation

SPX at 4167.87 as this post is written

U.S. Deflation Probability Chart Through April 2023

For reference, below is a chart of the St. Louis Fed Price Pressures Measures – Deflation Probability [FRED STLPPMDEF] through April 2023.

While I do not necessarily agree with the current readings of the measure, I view this as a proxy of U.S. deflation probability.

A description of this measure, as seen in FRED:

This series measures the probability that the personal consumption expenditures price index (PCEPI) inflation rate (12-month changes) over the next 12 months will fall below zero.

The chart, on a monthly basis from January 1990 – April 2023, with a last reading of .00004, last updated on May 1, 2023:

Deflation Probability .00004

Here is this same U.S. deflation probability measure since 2008:

Deflation Probability since 2008

source:  Federal Reserve Bank of St. Louis, Deflation Probability [STLPPMDEF], retrieved from FRED, Federal Reserve Bank of St. Louis; accessed May 1, 2023: https://fred.stlouisfed.org/series/STLPPMDEF

_________

I post various economic indicators and indices because I believe they should be carefully monitored.  However, as those familiar with this site are aware, I do not necessarily agree with what they depict or imply.

_____

The Special Note summarizes my overall thoughts about our economic situation

SPX at 4167.87 as this post is written

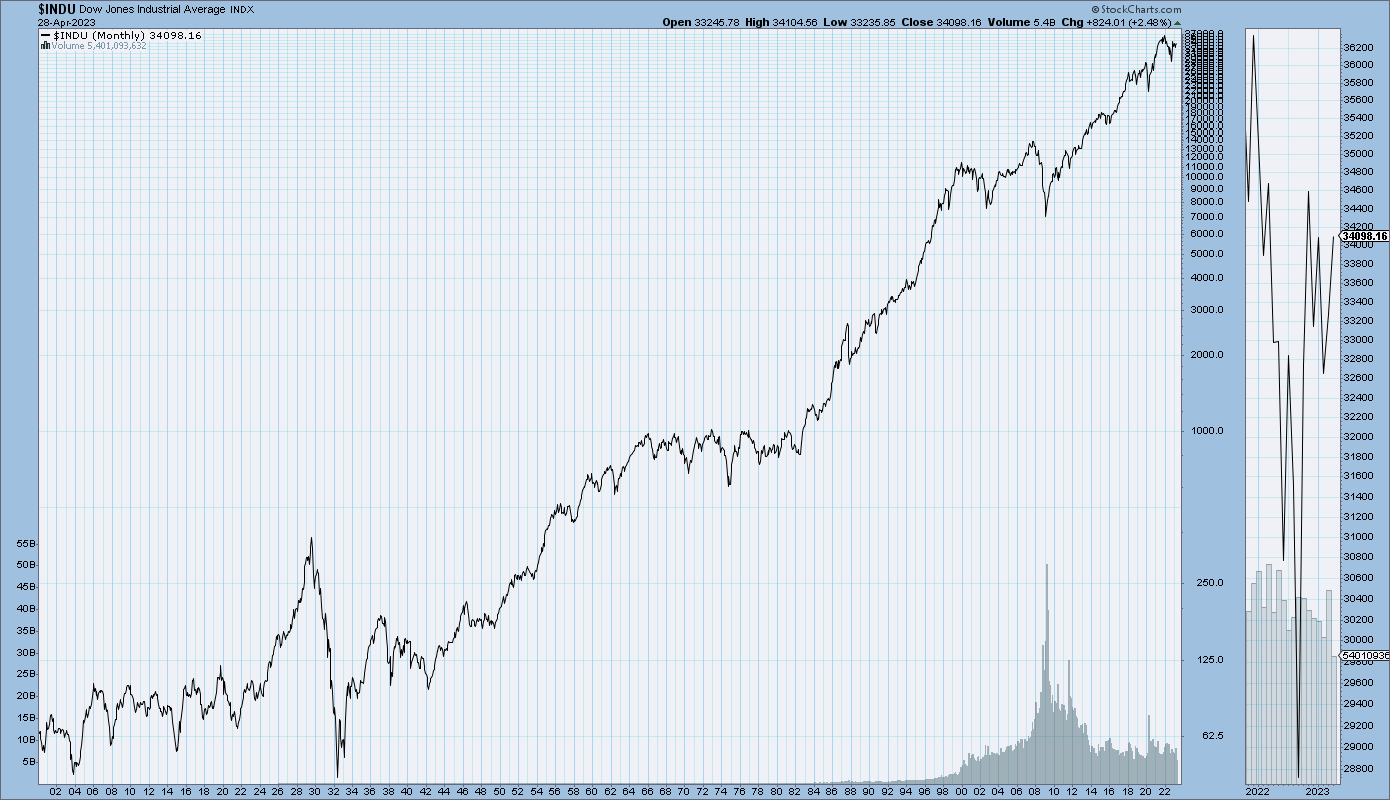
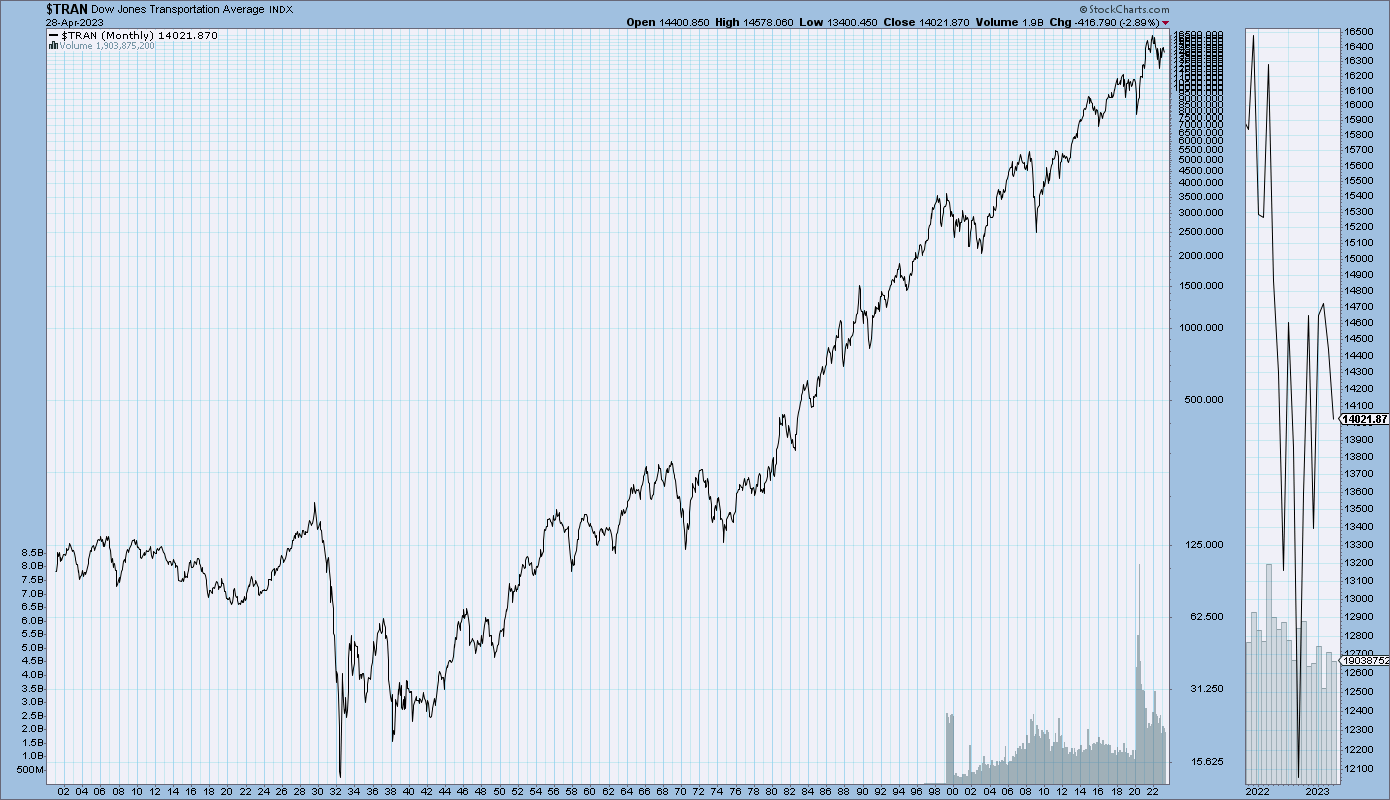
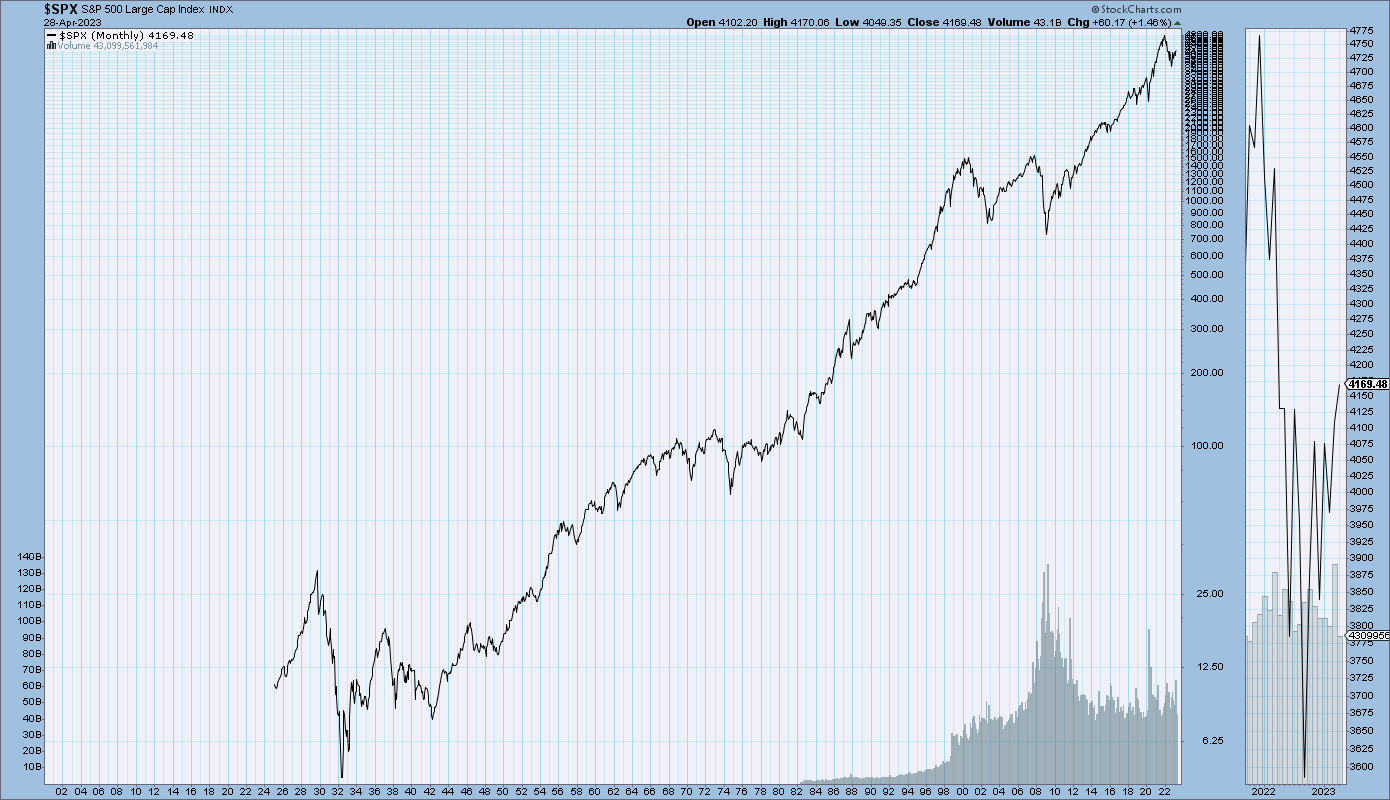
U.S. Stock Market Index Charts Since 1900, 1925, And 1978

StockCharts.com maintains long-term historical charts of various major stock market indices, interest rates, currencies, commodities, and economic indicators.

As a long-term reference, below are charts depicting various stock market indices for the dates shown.  All charts are depicted on a monthly basis using a LOG scale.

(click on charts to enlarge images)(charts courtesy of StockCharts.com)

The Dow Jones Industrial Average, from 1900 – April 28, 2023:

DJIA Since 1900

–

The Dow Jones Transportation Average, from 1900 – April 28, 2023:

DJTA

–

The S&P500, from 1925 – April 28, 2023:

S&P500 Since 1925

–

The Nasdaq Composite, from 1978 – April 28, 2023:

Nasdaq Composite

_____

The Special Note summarizes my overall thoughts about our economic situation

SPX at 4172.85 as this post is written
U.S. Dollar Decline – May 1, 2023 Update

U.S. Dollar weakness is a foremost concern of mine.  As such, I have extensively written about it, including commentary on the “A Substantial U.S. Dollar Decline And Consequences” page.  I am very concerned that the actions being taken to “improve” our economic situation will dramatically weaken the Dollar.  Should the Dollar substantially decline from here, as I expect, the negative consequences will far outweigh any benefits.  The negative impact of a substantial Dollar decline can’t, in my opinion, be overstated.

The following three charts illustrate various technical analysis aspects of the U.S. Dollar, as depicted by the U.S. Dollar Index.

First, a look at the monthly U.S. Dollar from 1983.  This clearly shows a long-term weakness, with the blue line showing technical support until 2007, and the red line representing a (past) trendline:

(charts courtesy of StockCharts.com; annotations by the author)

(click on charts to enlarge images)

U.S. Dollar Monthly 101.40

–

Next, another chart, this one focused on the daily U.S. Dollar since 2000 on a LOG scale.  The red line represents a (past) trendline.  The gray dotted line is the 200-day M.A. (moving average):

U.S. Dollar Daily 101.40

–

Lastly, a chart of the Dollar on a weekly LOG scale.  There are two clearly marked past channels, with possible technical support depicted by the dashed light blue line:

U.S. Dollar Monthly 101.40

–

I will continue providing updates on this U.S. Dollar situation regularly as it deserves very close monitoring…

_____

The Special Note summarizes my overall thoughts about our economic situation

SPX at 4169.48 as this post is written

Problematic Conditions Within The Economic Situation

Various surveys, economic growth projections, and market risk indicators indicate sustained economic growth and financial stability for the foreseeable future.

However, there are various indications – many of which have been discussed on this site – that this very widely-held consensus is in many ways incorrect.  There are many exceedingly problematical financial conditions that have existed prior to 2020, and continue to exist.  As well, numerous economic dynamics continue to be exceedingly worrisome and many economic indicators have portrayed facets of weak growth or outright decline currently as well as prior to 2020.

Of paramount importance is the resulting level of risk and the future economic implications.

From an “all things considered” standpoint, I continue to believe the overall level of risk remains at a fantastic level – one that is far greater than that experienced at any time in the history of the United States.

Cumulatively, these highly problematical conditions will lead to future upheaval.  The extent of the resolution of these problematical conditions will determine the ongoing viability of the financial system and economy as well as the resultant quality of living.

As I have previously written in “The U.S. Economic Situation” updates:

My analyses continues to indicate that the growing level of financial danger will lead to the next stock market crash that will also involve (as seen in 2008) various other markets as well.  Key attributes of this next crash is its outsized magnitude (when viewed from an ultra-long term historical perspective) and the resulting economic impact.  This next financial crash is of tremendous concern, as my analyses indicate it will lead to a Super Depression – i.e. an economy characterized by deeply embedded, highly complex, and difficult-to-solve problems.

_____

The Special Note summarizes my overall thoughts about our economic situation

SPX at 4169.48 as this post is written 

Friday, April 28, 2023

Broad-Based Indicators Of Economic Activity

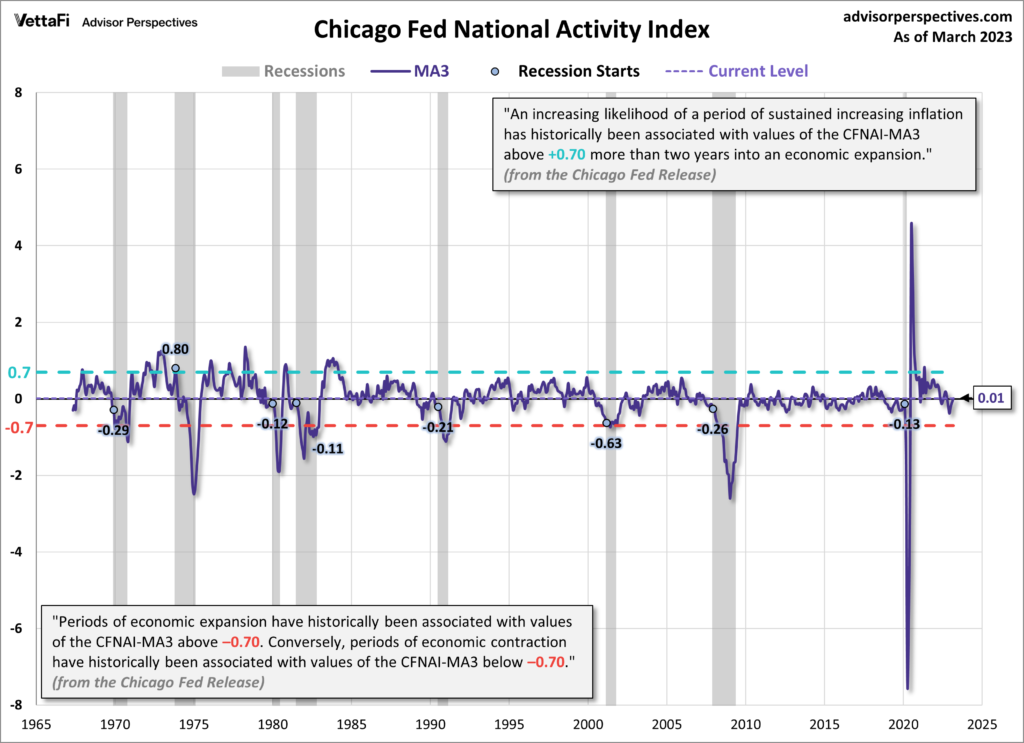
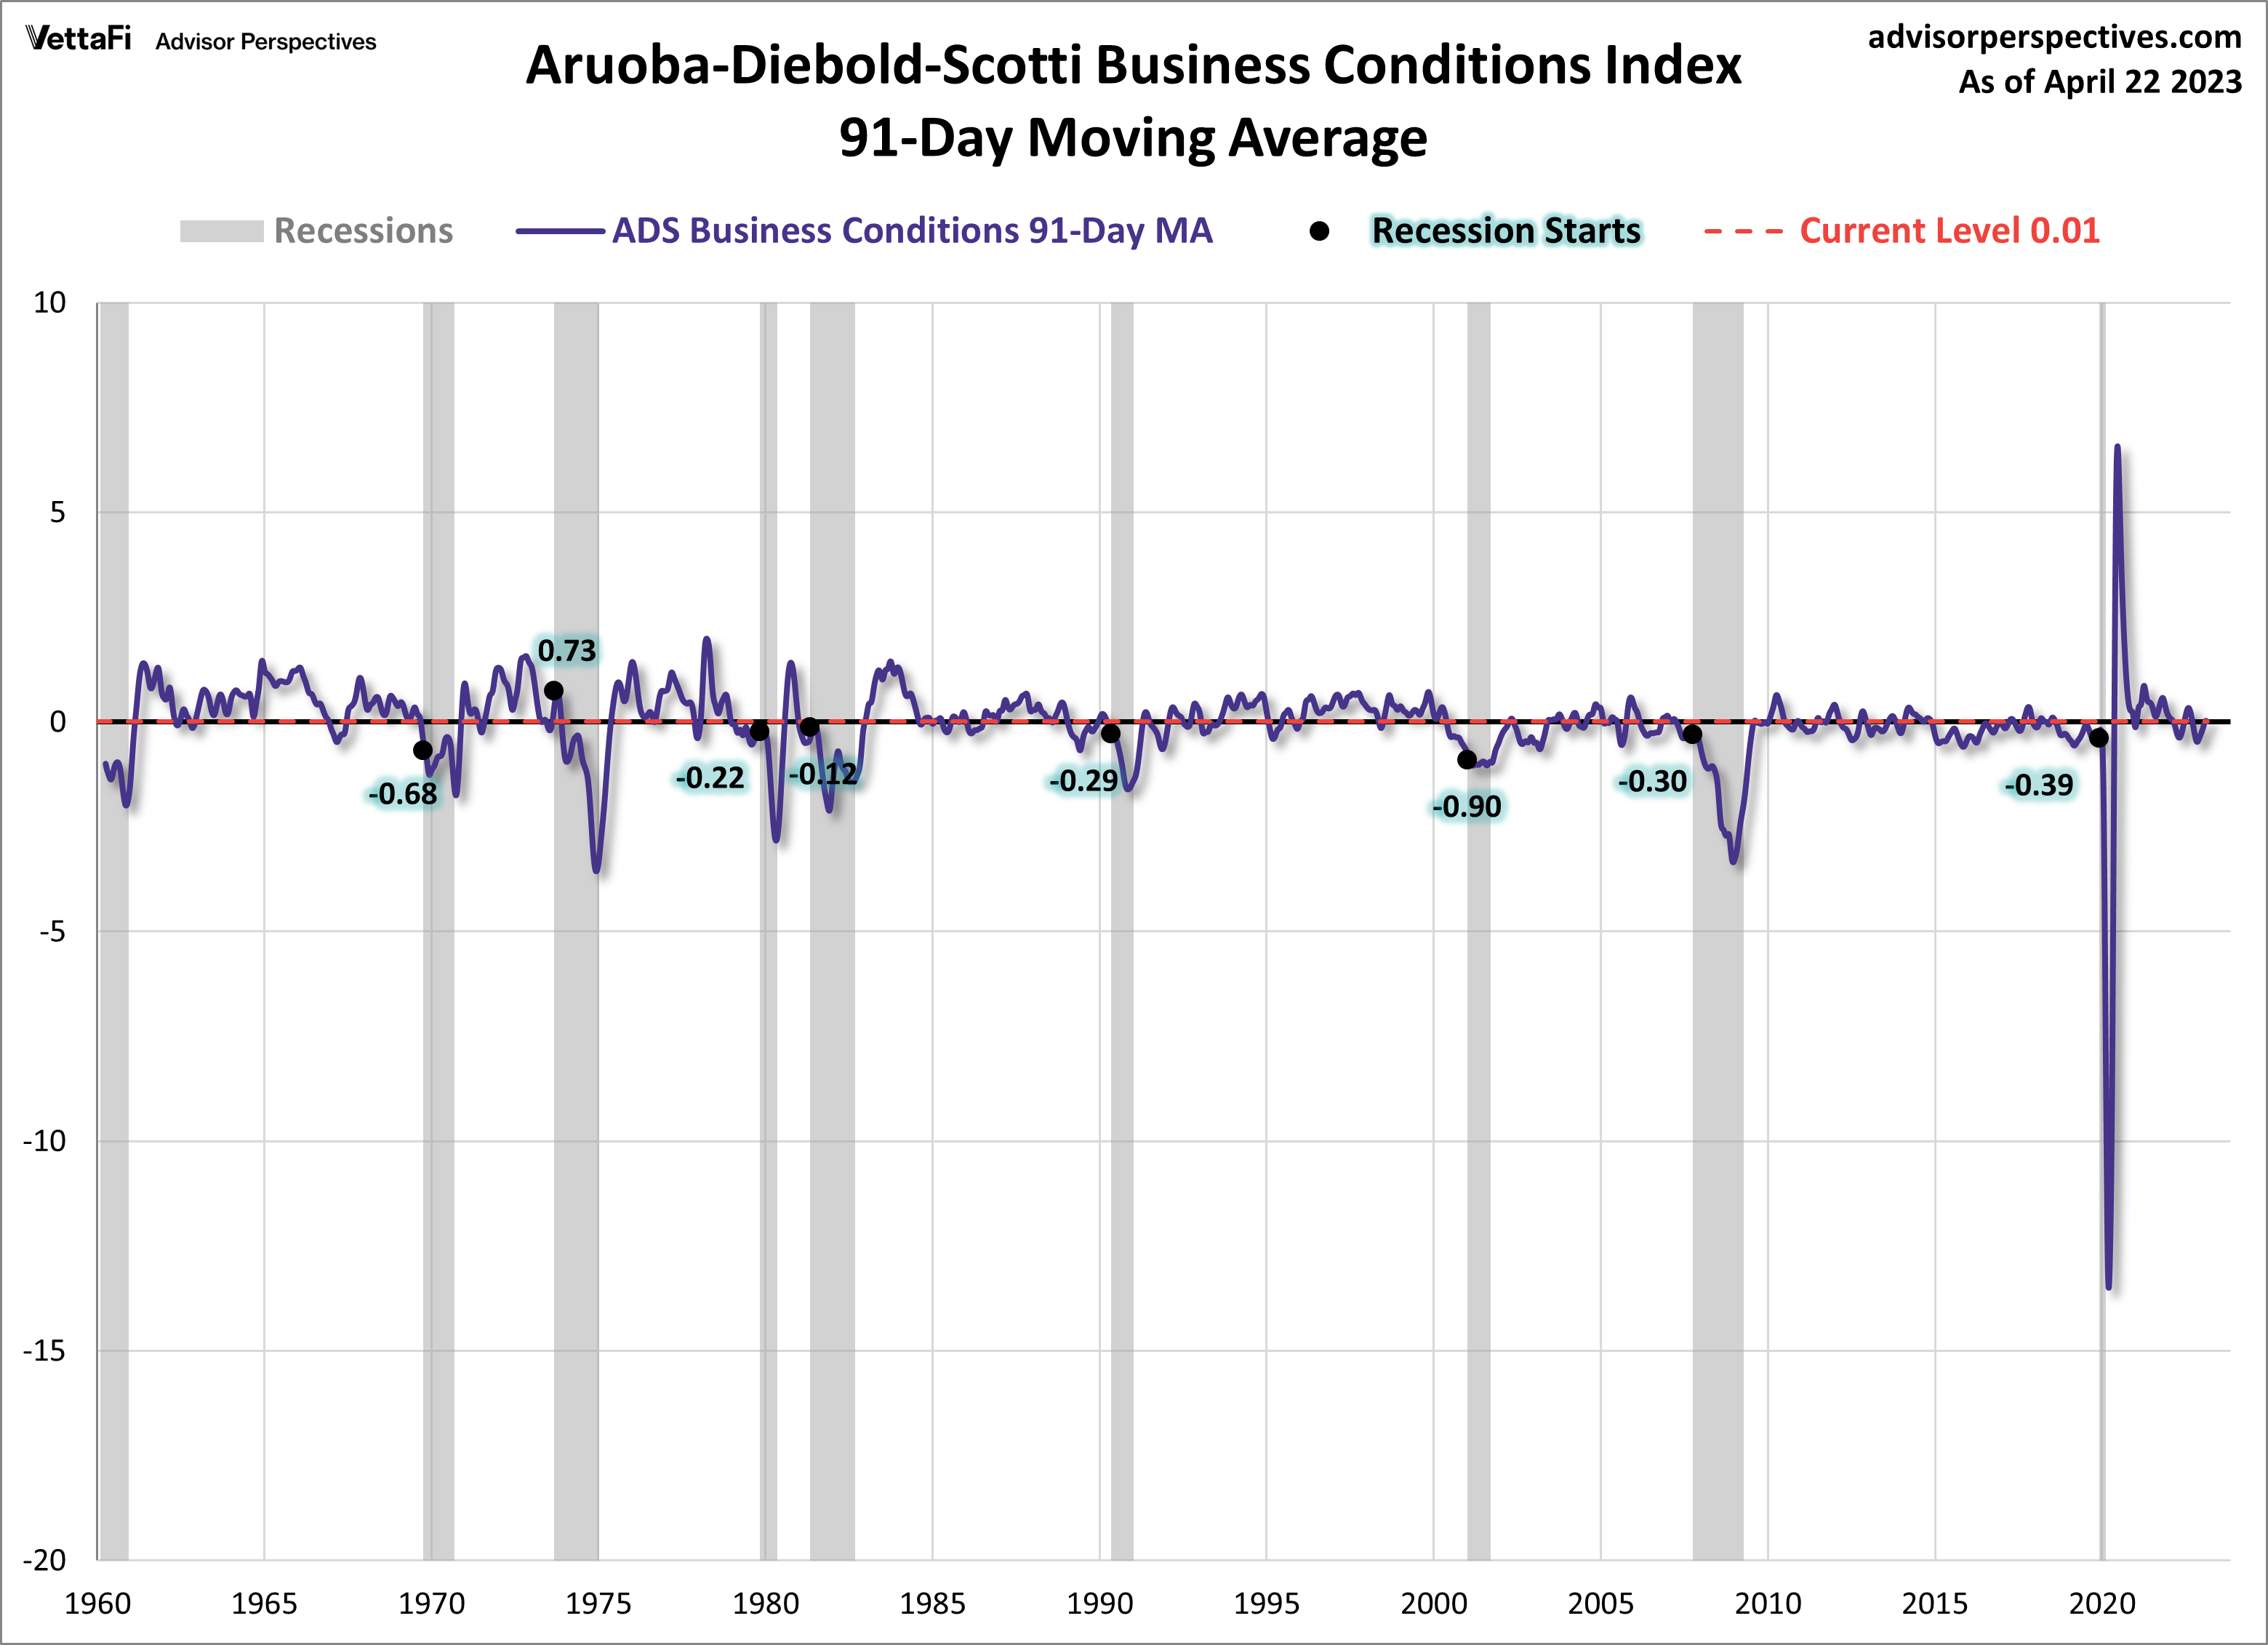
The Chicago Fed National Activity Index (CFNAI) and the Aruoba-Diebold-Scotti Business Conditions Index (ADS Index) are two broad-based economic indicators that I regularly feature in this site.

The short-term and long-term trends of each continue to be notable.

The Advisor Perspectives’ post of April 28, 2023, titled “The Philly Fed ADS Index Business Conditions Index Update” displays both the CFNAI MA-3 (CFNAI on a 3-month Moving Average) and ADS Index (91-Day Moving Average) from a variety of perspectives.

Of particular note, two of the charts, shown below, denote where the current levels of each reading is relative to the beginning of recessionary periods, as depicted by the as-noted dots.

The CFNAI MA-3:

(click on charts to enlarge images)

CFNAIMA3

–

The ADS Index, 91-Day MA:

ADS Index 91-Day Moving Average

–

Also shown in the aforementioned post is a chart of each with a long-term trendline (linear regression) as well as a chart depicting GDP for comparison purposes.

_________

I post various indicators and indices because I believe they should be carefully monitored.  However, as those familiar with this site are aware, I do not necessarily agree with what they depict or imply.

_____

The Special Note summarizes my overall thoughts about our economic situation

SPX at 4162.18 as this post is written

Consumer Confidence Surveys – As Of April 28, 2023

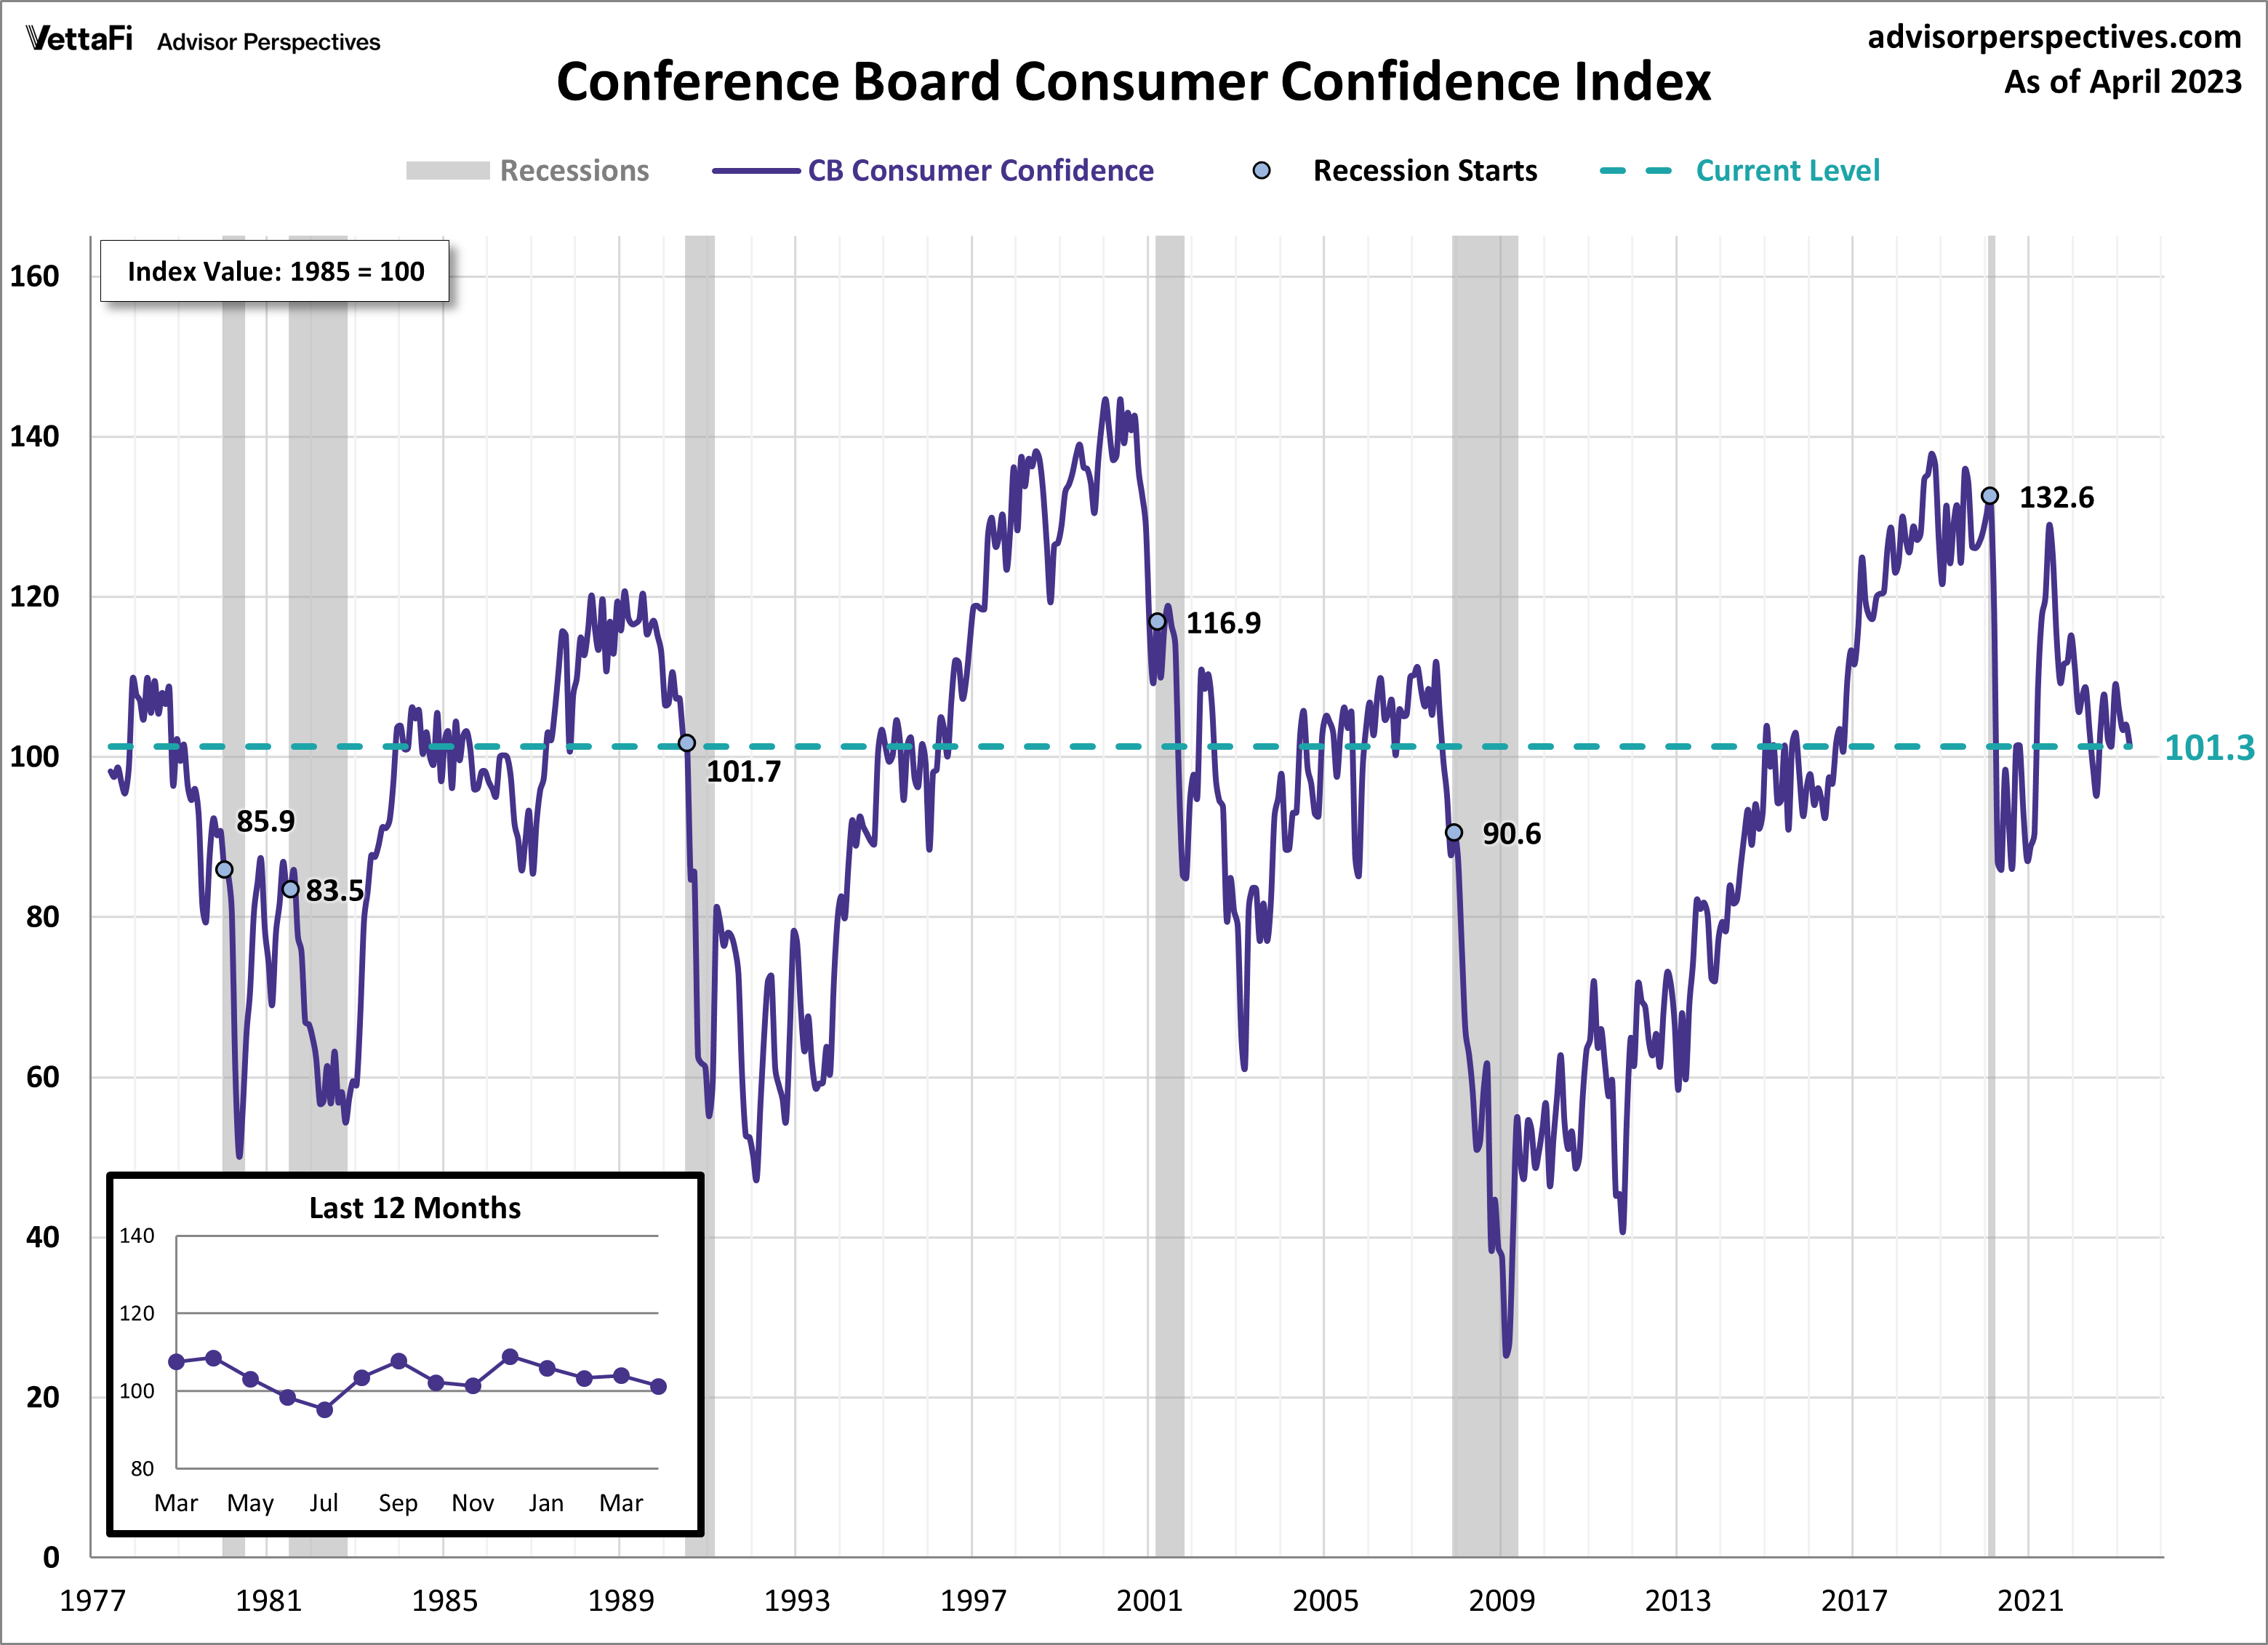
Advisor Perspectives had a post of April 28, 2023 (“Michigan Consumer Sentiment Inches Up in April, Consistent with Forecast“) that displays the latest Conference Board Consumer Confidence and University of Michigan Consumer Sentiment Index charts.  They are presented below:

(click on charts to enlarge images)

Conference Board Consumer Confidence Index 101.3

–

University of Michigan Consumer Sentiment Index 63.5

–

While I don’t believe that confidence surveys should be overemphasized, I find these readings and trends to be notable, especially in light of a variety of other highly disconcerting measures highlighted throughout this site.

_____

The Special Note summarizes my overall thoughts about our economic situation

SPX at 4164.04 as this post is written