Friday, May 5, 2023

3 Critical Unemployment Charts – May 2023

As I have commented previously, as in the October 6, 2009 post (“A Note About Unemployment Statistics”), in my opinion the official methodologies used to measure the various job loss and unemployment statistics do not provide an accurate depiction; they serve to understate the severity of unemployment.

However, even if one chooses to look at the official statistics, the following charts provide an interesting (and disconcerting) long-term perspective of certain aspects of the officially-stated unemployment (and, in the third chart, employment) situation.

The three charts below are from the St. Louis Fed site.  Here is the Median Duration of Unemployment (current value = 8.4 weeks):

(click on charts to enlarge images)(charts updated as of 5-5-23)

Median Weeks Unemployed

Data Source: FRED, Federal Reserve Economic Data, Federal Reserve Bank of St. Louis: Median Duration of Unemployment [UEMPMED] ; U.S. Department of Labor: Bureau of Labor Statistics; accessed May 5, 2023:  
http://research.stlouisfed.org/fred2/series/UEMPMED

–

Here is the chart for Unemployed 27 Weeks and Over (current value = 1.156 million):

Number Unemployed for 27 Weeks And  Over

Data Source: FRED, Federal Reserve Economic Data, Federal Reserve Bank of St. Louis: Civilians Unemployed for 27 Weeks and Over [UEMP27OV] ; U.S. Department of Labor: Bureau of Labor Statistics; accessed May 5, 2023: 
http://research.stlouisfed.org/fred2/series/UEMP27OV

–

Here is the chart for Total Nonfarm Payroll (current value = 155.673 million):

All Employees, Total Nonfarm

Data Source: FRED, Federal Reserve Economic Data, Federal Reserve Bank of St. Louis: All Employees: Total Nonfarm [PAYEMS] ; U.S. Department of Labor: Bureau of Labor Statistics; accessed May 5, 2023:  
https://research.stlouisfed.org/fred2/series/PAYEMS

–

Our unemployment problem is severe.  The underlying dynamics of the current – and especially future – unemployment situation remain exceedingly worrisome.  These dynamics are numerous and complex, and greatly lack recognition and understanding.

My commentary regarding unemployment is generally found in the “Unemployment” category.  This commentary includes the page titled “U.S. Unemployment Trends,” which discusses various problematical issues concerning the present and future employment situation.

_____

The Special Note summarizes my overall thoughts about our economic situation

SPX at 4061.22 as this post is written

Thursday, May 4, 2023

Jerome Powell’s May 3, 2023 Press Conference – Notable Aspects

On Wednesday, May 3, 2023 FOMC Chair Jerome Powell gave his scheduled May 2023 FOMC Press Conference. (link of video and related materials)

Below are Jerome Powell’s comments I found most notable – although I don’t necessarily agree with them – in the order they appear in the transcript.  These comments are excerpted from the “Transcript of Chairman Powell’s Press Conference“ (preliminary)(pdf) of May 3, 2023, with the accompanying “FOMC Statement.”

Excerpts from Chairman Powell’s opening comments:

Good afternoon. Before discussing today’s meeting, let me comment briefly on recent developments in the banking sector.  Conditions in that sector have broadly improved since early March, and the U.S banking system is sound and resilient.  We will continue to monitor conditions in this sector.  We are committed to learning the right lessons from this episode and will work to prevent events like these from happening again.  As a first step in that process, last week we released Vice Chair for Supervision Barr’s Review of the Federal Reserve’s Supervision and Regulation of Silicon Valley Bank.  The review’s findings underscore the need to address our rules and supervisory practices to make for a stronger and more resilient banking system, and I am confident that we will do so.

also:

Today, the FOMC raised its policy interest rate by 1/4 percentage point.  Since early last year, we have raised interest rates by a total of 5 percentage points in order to attain a stance of monetary policy that is sufficiently restrictive to return inflation to 2 percent over time.  We are also continuing to reduce our securities holdings.  Looking ahead, we will take a data-dependent approach in determining the extent to which additional policy firming may be appropriate.  I will have more to say about today’s monetary policy actions after briefly reviewing economic developments.

also:

At today’s meeting the Committee raised the target range for the federal funds rate by 1/4 percentage point, bringing the target range to 5 to 5-1/4 percent.  And we are continuing the process of significantly reducing our securities holdings.  

With today’s action, we have raised interest rates by 5 percentage points in a little more than a year.  We are seeing the effects of our policy tightening on demand in the most interestrate-sensitive sectors of the economy, particularly housing and investment.  It will take time, however, for the full effects of monetary restraint to be realized, especially on inflation.  

also:

We remain committed to bringing inflation back down to our 2 percent goal and to keep longer-term inflation expectations well anchored.  Reducing inflation is likely to require a period of below-trend growth and some softening of labor market conditions.  Restoring price stability is essential to set the stage for achieving maximum employment and stable prices over the longer run.

Excerpts of Jerome Powell’s responses as indicated to various questions:

STEVE LIESMAN.  Oh, thank you. Steve Liesman, CNBC. Can you tell us what the Federal Reserve Board did in the wake of that February presentation where you informed that Silicon Valley Bank and other banks were experiencing interest rate risks? And can you tell me what supervisory actions you’ve done in the wake of the recent bank failures to make sure that banks are currently appropriately managing interest rate risk. And kind of part 3 but it’s all the same question here, do you still think this separation principle that monetary policy and supervision can be handled with different tools? Thank you. 

CHAIR POWELL.  Sure. So, the February 14 presentation, I didn’t remember it very well. But now, of course, I’ve gone back and looked at it very carefully. I did remember it. And what it was, was a general presentation. It was an informational briefing of the whole board, the entire board. I think all members were there. And it was about interest rate risk in the banks and lots of data. And there was one page on Silicon Valley Bank, which talked about, you know, the amount of losses they — mark to market losses they had in their portfolio. There was nothing in it about — that I recall, anyway, about the risk of a bank run. So, it was — I think the takeaway was they were going away to do an assessment, a vertical — sorry, horizontal assessment of banks. It wasn’t — it wasn’t presented as an urgent or alarming situation. It was presented as an informational non-decisional kind of a thing. And I thought it was a good presentation and, as I said, did remember it. In terms of what we’re doing, of course, I think banks themselves are — many, many banks are now attending to liquidity and taking opportunity now, really, since the events of early March, to build liquidity. And you asked about the separation principle. I — you know, like so many things, it’s very useful. But, you know, ultimately, it has its limits. I mean, I think in this particular case, we have found that the monetary policy tools and the financial stability tools are not in conflict. They’re both — they’re working well together. We’ve used our financial stability tools to support banks through our lending facilities. And, at the same time, we’ve been able to use our monetary policy tools to foster maximum employment and price stability. 

STEVE LIESMAN.  Mr. Chairman, I’m sorry. I don’t mean to be argumentative, but the staff report said SVB has significant interest rate risk. It said, interest rate risk measurements failed at SVB. And it said, Banks with large unrealized losses face significant safety and soundness risks. Why was that not alarming? 

CHAIR POWELL.  Well, I mean, I didn’t say it wasn’t alarming. It was — they’re pointing out something that they’re working on and that they’re on the case, that — that, you know, that I’m not sure whether they mentioned — I think they did, actually. They mentioned that they had taken regulatory action matter or supervisory action in the form of matters requiring attention. So I think that was also in the presentation. I think it was to say, yes. This is a bank and there are many other banks that are experiencing this — these things, and we’re on the case. 

also:

EDWARD LAWRENCE. Thank you very much, Chair Powell. Edward Lawrence with Fox Business. So, if the Federal Reserve gets down to the 3 percent inflation as the projections show at the end of this year or close to it, would it be okay for you for a prolonged period of 3 percent inflation and hoping for some outside event to move down to 2 percent target?

CHAIR POWELL.  Look. I think we’re always going to have 2 percent as our target, and we’re always going to be focusing on getting there. You would be okay with a prolonged 3 percent. You know, it’s — let me just say that’s not what we’re looking for. We’re looking for inflation going down to 2 percent over time. I mean, we — that’s not a question that’s in front of us, and it would depend on so many other things. But ultimately, we’re not looking to get to 3 percent and then drop our tools. We have a goal of getting to 2 percent. We think it’s going to take some time. We don’t think it’ll be a smooth process. And, you know, I think we’re going to – we’re going to need to stay at this for a while. 

EDWARD LAWRENCE.  How does the other side of the mandate, the jobs side, once you get to 3 percent, going from 3 to 2, how does the other side of the mandate balance? 

CHAIR POWELL. I think they — you know, they will both matter equally at that point. Right now, you have a labor market that’s still extraordinarily tight. You still got 1.6 job openings, even with the lower job openings number for every unemployed person. We do see some evidence of softening in labor market conditions. But, overall, you’re near a 50-year low in unemployment. Wages, you all will have seen that the wage number from late last week, and it’s — whenever it was. And, you know, it’s a couple of percentage points above what would be — what would be consistent with 2 percent inflation over time. So, we do see some softening, we see new labor supply coming in. These are very positive developments. But the labor market is very, very strong, whereas inflation is, you know, running high, well above our — well above our goal. And right now, we need to be focusing on bringing inflation down. Fortunately, we’ve been able to do that so far without unemployment going up.

_____

_____

The Special Note summarizes my overall thoughts about our economic situation

SPX at 4060.13 as this post is written

Monday, May 1, 2023

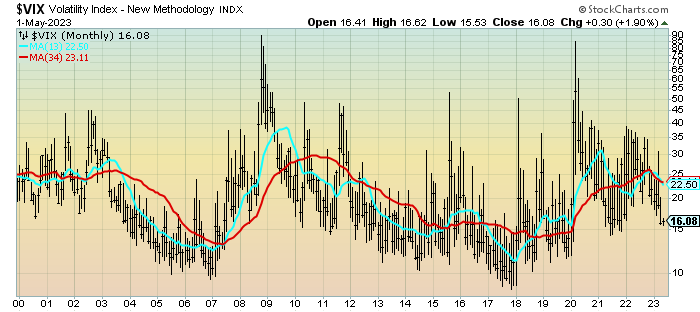
VIX Weekly And Monthly Charts Since The Year 2000 – May 1, 2023 Update

For reference purposes, below are two charts of the VIX from year 2000 through the May 1, 2023 close, which had a value of 16.08.

Here is the VIX Weekly chart, depicted on a LOG scale, with the 13- and 34-week moving averages, seen in the cyan and red lines, respectively:

(click on chart to enlarge image)(chart courtesy of StockCharts.com; chart creation and annotation by the author)

VIX Weekly LOG 16.08

–

Here is the VIX Monthly chart, depicted on a LOG scale, with the 13- and 34-month moving average, seen in the cyan and red lines, respectively:

(click on chart to enlarge image)(chart courtesy of StockCharts.com; chart creation and annotation by the author)

VIX Monthly LOG 16.08

____

The Special Note summarizes my overall thoughts about our economic situation

SPX at 4167.87 as this post is written

S&P500 Charts Since 2009 And 1980 – May 1, 2023 Update

In the March 9, 2012 post (“Charts of Equities’ Performance Since March 9, 2009 And January 1, 1980“) I highlighted two charts for reference purposes.

Below are those two charts, updated through the latest daily closing price.

The first is a daily chart of the S&P500 (shown in green), as well as five prominent (AAPL, IBM, AMZN, SBUX, CAT) individual stocks, since 2005.  There is a blue vertical line that is very close to the March 6, 2009 low.  As one can see, both the S&P500 performance, as well as many stocks including the five shown, have performed strongly since the March 6, 2009 low:

(click on chart to enlarge image)(chart courtesy of StockCharts.com; chart creation and annotation by the author)

S&P500 and prominent stocks since 2005

–

This next chart shows, on a monthly LOG basis, the S&P500 since 1980.  I find this chart notable as it provides an interesting long-term perspective on the S&P500′s performance.  The 20, 50, and 200-month moving averages are shown in blue, red, and green lines, respectively:

(click on chart to enlarge image)(chart courtesy of StockCharts.com; chart creation and annotation by the author)

S&P500 Monthly Since 1980

_____

The Special Note summarizes my overall thoughts about our economic situation

SPX at 4167.87 as this post is written

U.S. Deflation Probability Chart Through April 2023

For reference, below is a chart of the St. Louis Fed Price Pressures Measures – Deflation Probability [FRED STLPPMDEF] through April 2023.

While I do not necessarily agree with the current readings of the measure, I view this as a proxy of U.S. deflation probability.

A description of this measure, as seen in FRED:

This series measures the probability that the personal consumption expenditures price index (PCEPI) inflation rate (12-month changes) over the next 12 months will fall below zero.

The chart, on a monthly basis from January 1990 – April 2023, with a last reading of .00004, last updated on May 1, 2023:

Deflation Probability .00004

Here is this same U.S. deflation probability measure since 2008:

Deflation Probability since 2008

source:  Federal Reserve Bank of St. Louis, Deflation Probability [STLPPMDEF], retrieved from FRED, Federal Reserve Bank of St. Louis; accessed May 1, 2023: https://fred.stlouisfed.org/series/STLPPMDEF

_________

I post various economic indicators and indices because I believe they should be carefully monitored.  However, as those familiar with this site are aware, I do not necessarily agree with what they depict or imply.

_____

The Special Note summarizes my overall thoughts about our economic situation

SPX at 4167.87 as this post is written

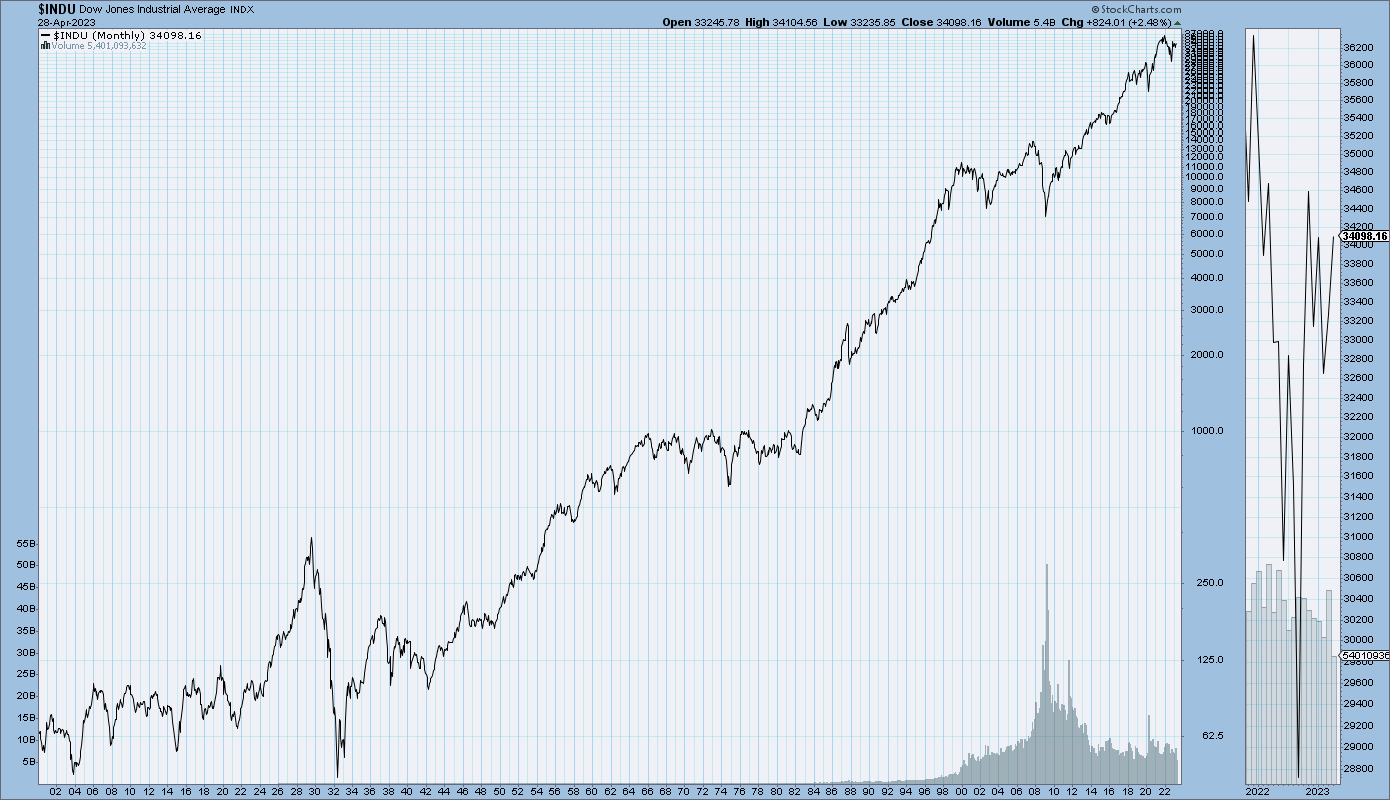
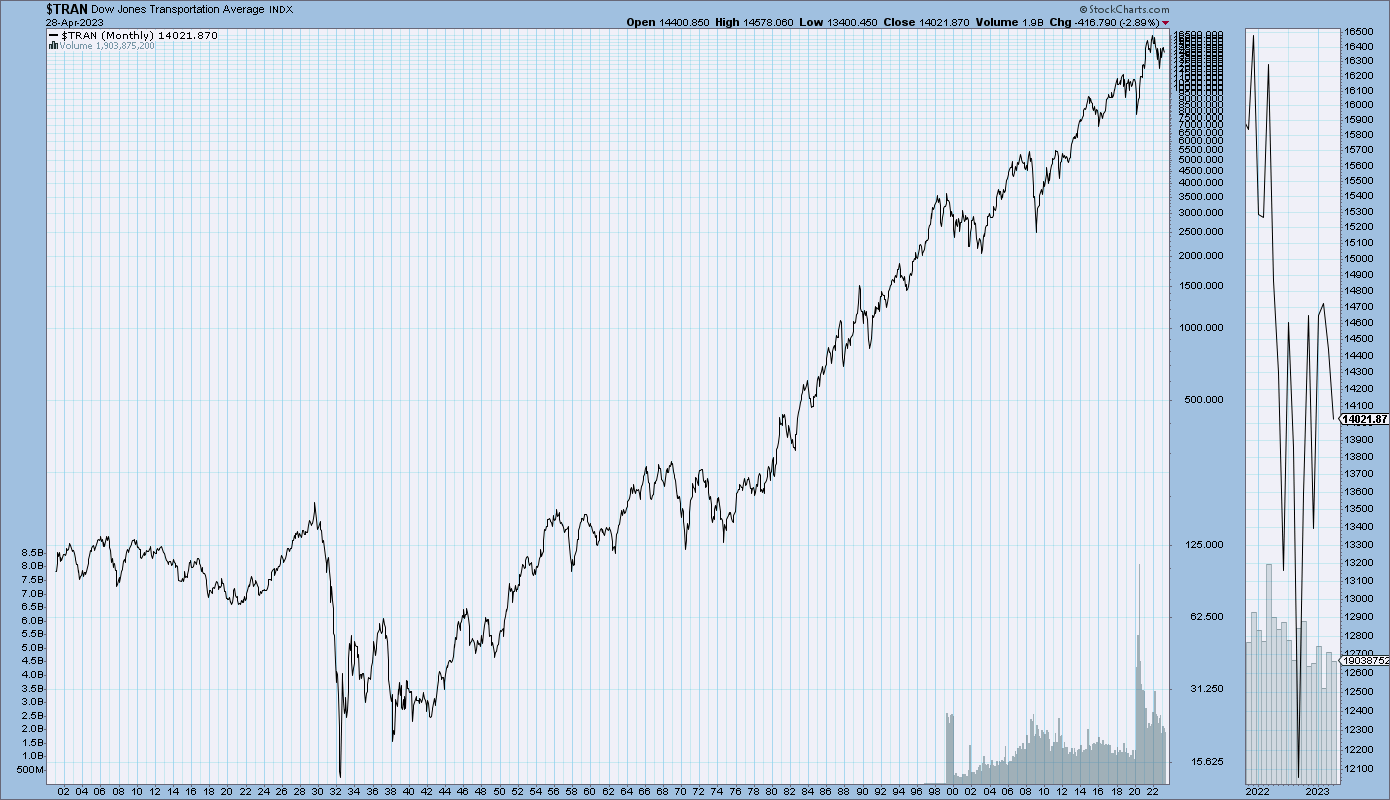
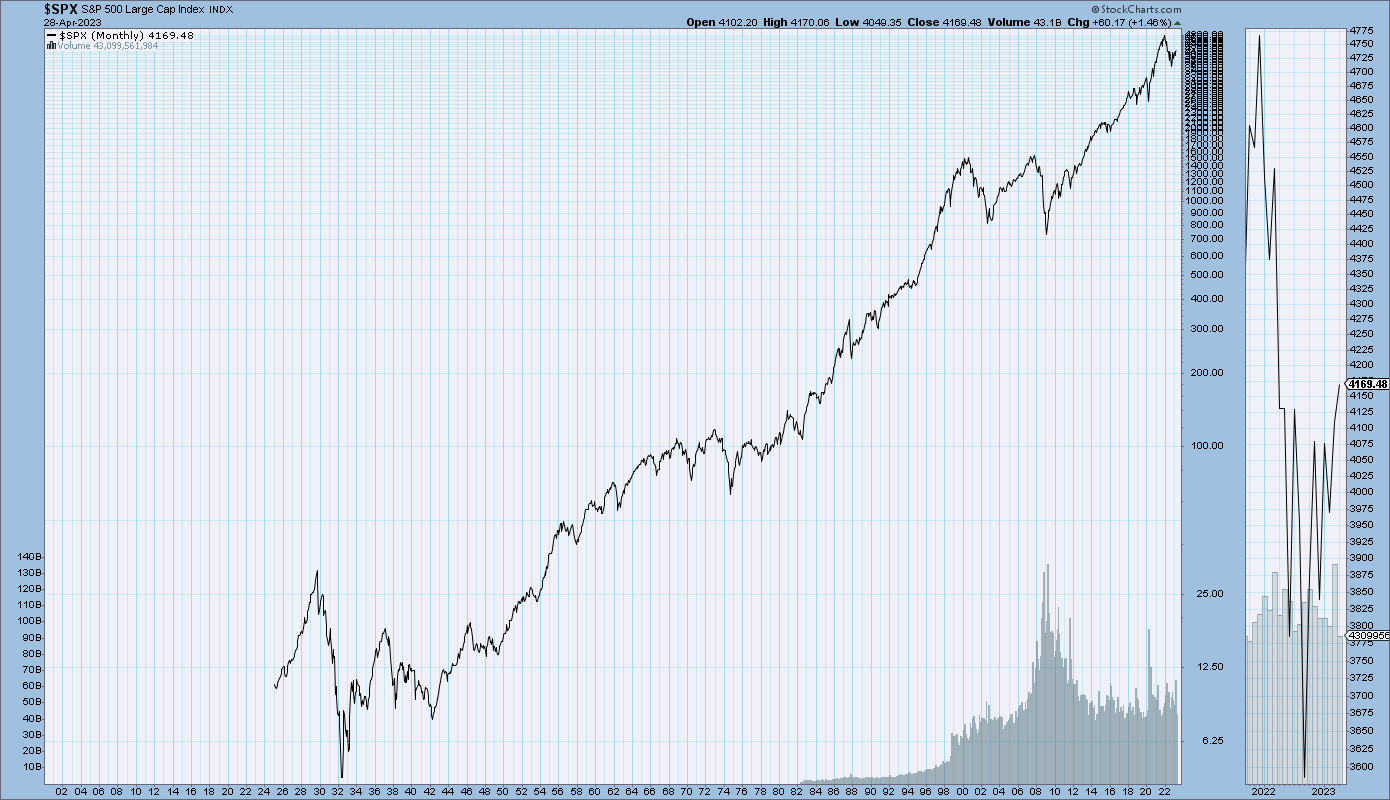
U.S. Stock Market Index Charts Since 1900, 1925, And 1978

StockCharts.com maintains long-term historical charts of various major stock market indices, interest rates, currencies, commodities, and economic indicators.

As a long-term reference, below are charts depicting various stock market indices for the dates shown.  All charts are depicted on a monthly basis using a LOG scale.

(click on charts to enlarge images)(charts courtesy of StockCharts.com)

The Dow Jones Industrial Average, from 1900 – April 28, 2023:

DJIA Since 1900

–

The Dow Jones Transportation Average, from 1900 – April 28, 2023:

DJTA

–

The S&P500, from 1925 – April 28, 2023:

S&P500 Since 1925

–

The Nasdaq Composite, from 1978 – April 28, 2023:

Nasdaq Composite

_____

The Special Note summarizes my overall thoughts about our economic situation

SPX at 4172.85 as this post is written

U.S. Dollar Decline – May 1, 2023 Update

U.S. Dollar weakness is a foremost concern of mine.  As such, I have extensively written about it, including commentary on the “A Substantial U.S. Dollar Decline And Consequences” page.  I am very concerned that the actions being taken to “improve” our economic situation will dramatically weaken the Dollar.  Should the Dollar substantially decline from here, as I expect, the negative consequences will far outweigh any benefits.  The negative impact of a substantial Dollar decline can’t, in my opinion, be overstated.

The following three charts illustrate various technical analysis aspects of the U.S. Dollar, as depicted by the U.S. Dollar Index.

First, a look at the monthly U.S. Dollar from 1983.  This clearly shows a long-term weakness, with the blue line showing technical support until 2007, and the red line representing a (past) trendline:

(charts courtesy of StockCharts.com; annotations by the author)

(click on charts to enlarge images)

U.S. Dollar Monthly 101.40

–

Next, another chart, this one focused on the daily U.S. Dollar since 2000 on a LOG scale.  The red line represents a (past) trendline.  The gray dotted line is the 200-day M.A. (moving average):

U.S. Dollar Daily 101.40

–

Lastly, a chart of the Dollar on a weekly LOG scale.  There are two clearly marked past channels, with possible technical support depicted by the dashed light blue line:

U.S. Dollar Monthly 101.40

–

I will continue providing updates on this U.S. Dollar situation regularly as it deserves very close monitoring…

_____

The Special Note summarizes my overall thoughts about our economic situation

SPX at 4169.48 as this post is written

Problematic Conditions Within The Economic Situation

Various surveys, economic growth projections, and market risk indicators indicate sustained economic growth and financial stability for the foreseeable future.

However, there are various indications – many of which have been discussed on this site – that this very widely-held consensus is in many ways incorrect.  There are many exceedingly problematical financial conditions that have existed prior to 2020, and continue to exist.  As well, numerous economic dynamics continue to be exceedingly worrisome and many economic indicators have portrayed facets of weak growth or outright decline currently as well as prior to 2020.

Of paramount importance is the resulting level of risk and the future economic implications.

From an “all things considered” standpoint, I continue to believe the overall level of risk remains at a fantastic level – one that is far greater than that experienced at any time in the history of the United States.

Cumulatively, these highly problematical conditions will lead to future upheaval.  The extent of the resolution of these problematical conditions will determine the ongoing viability of the financial system and economy as well as the resultant quality of living.

As I have previously written in “The U.S. Economic Situation” updates:

My analyses continues to indicate that the growing level of financial danger will lead to the next stock market crash that will also involve (as seen in 2008) various other markets as well.  Key attributes of this next crash is its outsized magnitude (when viewed from an ultra-long term historical perspective) and the resulting economic impact.  This next financial crash is of tremendous concern, as my analyses indicate it will lead to a Super Depression – i.e. an economy characterized by deeply embedded, highly complex, and difficult-to-solve problems.

_____

The Special Note summarizes my overall thoughts about our economic situation

SPX at 4169.48 as this post is written