From Chairman Powell’s opening comments:
Turning to today’s meeting, my colleagues and I decided to leave our policy rate unchanged, after lowering it a total of 3/4 of a percentage point at the previous three meetings. As always, we base our decisions on judgment of how best to achieve the goals Congress has given us—maximum employment and price stability. Our economic outlook remains a favorable one despite global developments and ongoing risks. With our decisions through the course of the past year, we believe that monetary policy is well positioned to serve the American people by supporting continued economic growth, a strong job market, and inflation near our symmetric 2 percent goal.
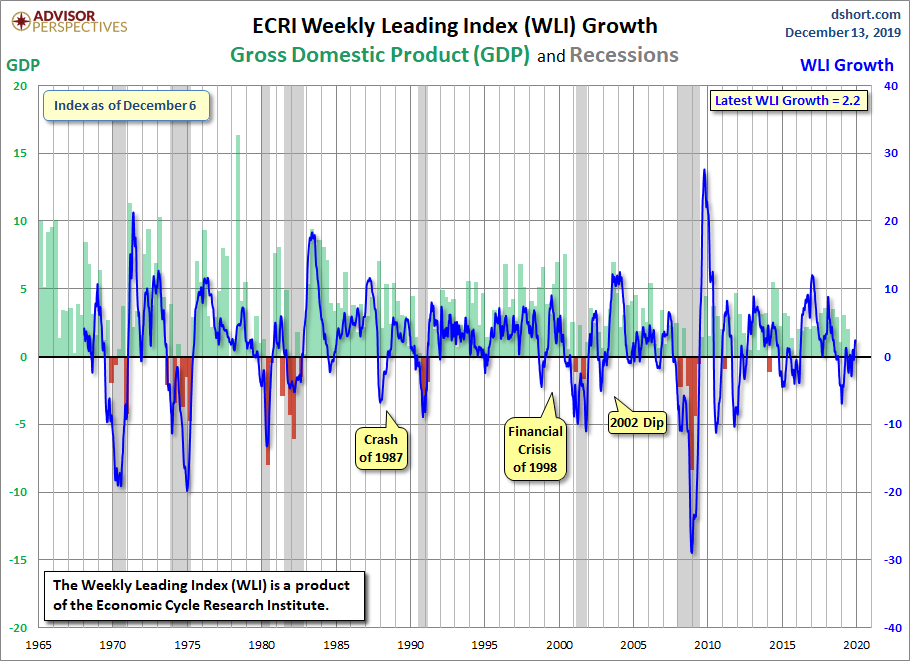
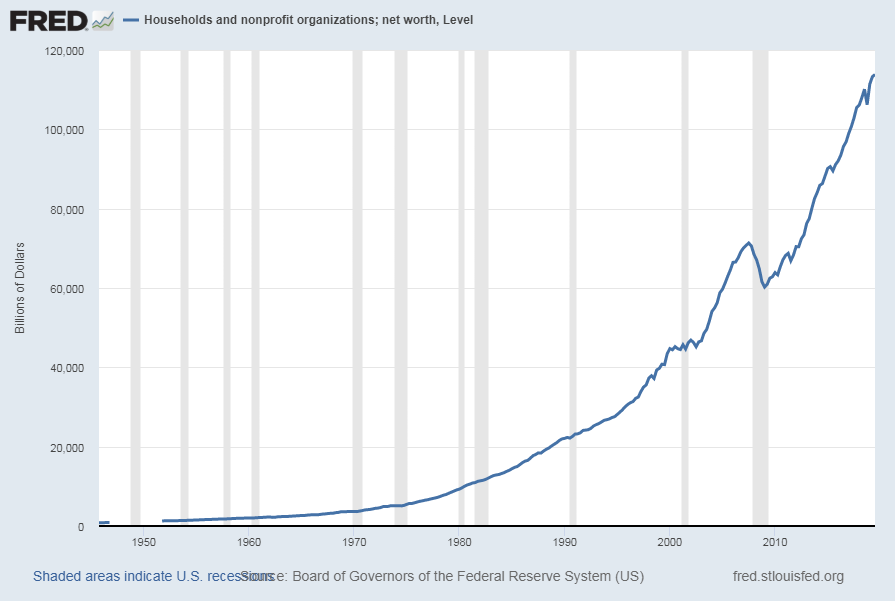
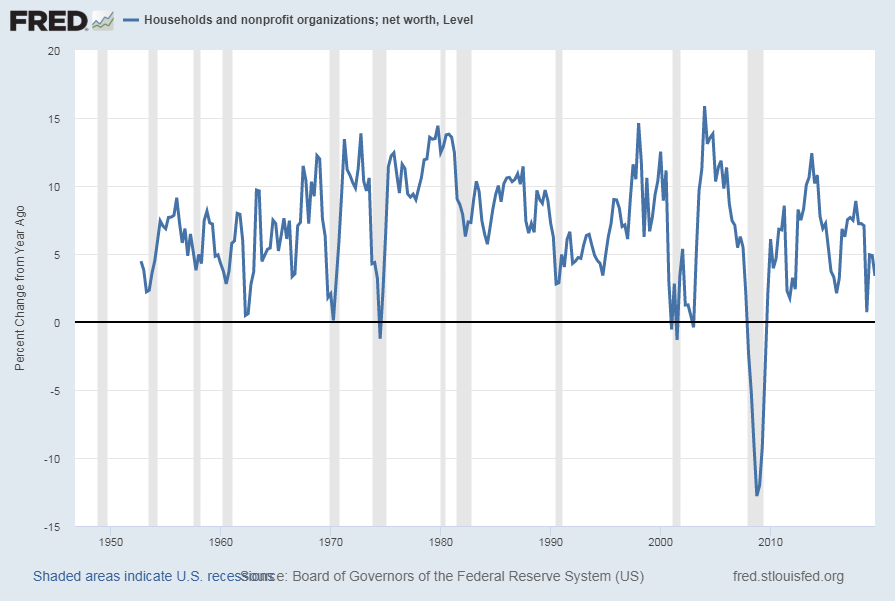
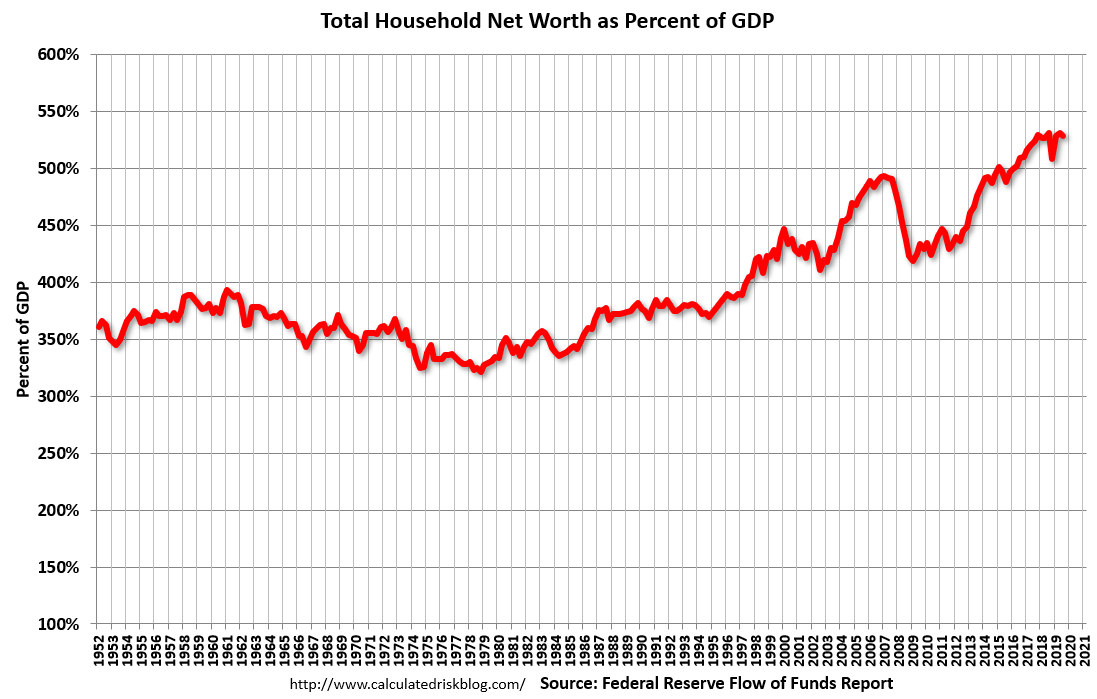
The economic expansion is in its 11th year, the longest on record. Household spending has been strong—supported by a healthy job market, rising incomes, and solid consumer confidence. In contrast, business investment and exports remain weak, and manufacturing output has declined over the past year. As has been the case for some time, sluggish growth abroad and trade developments have been weighing on those sectors. Even so, the overall economy has been growing moderately. And with a strong household sector and supportive monetary and financial conditions, we expect moderate growth to continue. As seen from FOMC participants’ most recent projections, the median expectation for real GDP growth slows slightly over the next few years but remains near 2 percent.
also:
Finally, I wanted to note that we have been purchasing Treasury bills and conducting repurchase operations consistent with the plan we announced in December.[1] These technical operations are aimed at maintaining an ample level of reserves and addressing money market pressures that could adversely affect the implementation of monetary policy. Our operations have gone well so far; pressures in money markets over recent weeks have been subdued. To address possible pressures in money markets over the year-end, we have been conducting term repo operations spanning year-end. We stand ready to adjust the details of our operations as appropriate to keep the federal funds rate in the target range.
[1] Chair Powell intended to say the repurchase operations were announced in October.
Jerome Powell’s responses as indicated to the various questions:
MICHAEL MCKEE. May I ask, concluded in, I did the same thing as Howard, Michael McKee Bloomberg radio and television. The BIS concluded in September that the repo spike was not a one off confluence of random events but reflected structural and regulatory issues that could lead to a recurrence, I’d like to ask you if you agree with the BIS findings and given that we are approaching year-end for the markets will you be taking any extra steps to ensure that funding is available in the repo and FX swaps markets. There was a report yesterday, Credit Suisse suggesting there’s a good chance that we will see disruptions and one of the reasons they put it forward is that the Fed is at this point buying only T-bills and the market wants to sell coupons, do you have any plans to sell coupons?
CHAIR POWELL. So, I’m going to take a little step back and I will get to your specific questions on the year-end and on T-bills. So I guess I want to start by stressing that these are very important operational matters, but that are not likely to have any macroeconomic implications. We’ve decided back in January to remain in an ample reserves regime, and that means we’ll be setting the federal funds rate, the range for the federal funds rate, through our administered rates and not to active management of the level of reserves. We’re committed to robustly implementing that framework as you can see by our actions. And the purpose of all this, let’s remember, is to assure that our monetary policy decisions will be transmitted to the federal funds rate, which in turn affects other short-term rates. We have the tools to accomplish that and we will use them. The purpose of all of this is not to eliminate all volatility particularly in the repo market. So taking you back this as you know we had, very gradually allowed the balance sheet to shrink, we slowed that gradual paced by half in March, and then we ended it in July. Meanwhile we had surveyed all of the banks, and particularly the large banks who hold a lot of the reserves and said what’s your lowest comfortable level of reserves? We got those numbers, we added them up, we added a buffer and it came out sort of at a level that was well below when we were in September. And yet we saw actually in September that reserves– the markets acted as though reserves had become scarce. So what had happened was that liquidity which actually existed didn’t flow into the repo market and that had effects on the federal funds rate. So the question is, why did that happen? And we’ve been very carefully looking at the reasons why that might have happened there are payments issues, there have been a number of supervisory and regulatory issues raised, we’re looking carefully at those. We’re open to ideas for modifying supervisory and regulatory practice in ways that don’t undermine safety and soundness and the number of ideas, are under examination there. To go through with sort of like in time, we started off really on September 17th with overnight operations, by October 11th we had created and put into effect to plan, that plan is in effect. It’s working. I think for the last couple of months, repo markets have been functioning well, short-term rates are stable, markets are functioning. So you asked about year-end, temporary upward pressure is on short-term, money market rates are not unusual around year-end. And our– both our repo operations and Treasury bill purchases are intended to mitigate the risks that such pressures pose to our control of the federal funds rate. We think that the pressures appear manageable and we stand ready to adjust the details of our operations as necessary to keep the federal funds rate in the target range. Our strategy has been– essentially the key to our strategy is to supply reserves in the near term through both overnight and term repo. And at the same time we’re raising the underlying level of reserves through bill purchases. I’ll take that now. We’ve said bills– bill purchases, so we’ve also said that we were willing to adopt our strategy. We’re not at this place but if it does become appropriate for us to purchase other short-term coupon securities, then we would be prepared to do that if the need arises. So, but we don’t– we’re not in that place it looks– it very much looks like the bill. So those bill purchases are going well just according to expectations. I mean, the other thing I’ll say is that we’re in, you know, very regular contact with market participants all the time. We’ll be providing, we’ll be continuing that and we’re prepared to adjust our tactics. We’re focused on year-end as well and prepared to adjust our operations as appropriate.
also:
CHRISTOPHER RUGABER. Well, just to follow up real quick on the material reassessment aspect, are you worried that that has set too high a bar for potential cuts next year? We were talking about rate hikes but no Fed policymakers seems to foresee any cuts next year. Some economist do. Does the material reassessment mean you need to see data actually worsen?Does it reduce your ability to act preemptively the way arguably you did this year?
CHAIR POWELL. So, one thing that we’re mindful of is that we’ve cut rates three times since July. That’s 75 basis points worth of cuts. And we do believe that monetary policy operates with long and variable lags and that it will take some time before the full effects of those actions are seen in the economy. So that will take some time. So, that’s one reason to hold back and wait. And we thought, I think we took strong measures. In fact, if you look at more broadly at the Treasury yield curve, it has moved more than 75 basis points. So, you’ve had quite a significant move in the direction higher accommodation.
In terms of what’s, you know, what is the material at the end of the day? Well, I would just say whether or not a change in the outlook merits a policy response will be a collective judgment of the FOMC. There isn’t any single factor that will determine our decisions. We’ll look at a full range of data and other information varying on economic outlook.
also:
NANCY MARSHALL-GENZER. I’m Nancy Marshall-Genzer from Marketplace. Chair Powell, why aren’t we seeing stronger wage gains? Wages are growing more slowly now than they were toward the beginning of the year. Why is that?
CHAIR POWELL. Well, wage gains have moved up a bit. If you look back 3, 4 years, you’ll see wages are going around 2 percent. Now, you see them moving up, you know, more three, three and a half percent. So, why aren’t they growing higher, at a faster rate? And it’s a couple of things. I think there are a range of explanations. For instance, one would be that productivity has just been low. So, wages should go up to cover inflation and productivity. Productivity has been low and that is very likely to be holding back wages. I also think there are other possible potential explanations such as, you know, globalization can be– the idea that you can make, manufacture, or even provide services anywhere in the world to anywhere in the world. I think that hangs over the wage setting process, and everywhere pretty much. You don’t see– there isn’t the kind of traction in the wage market that even in a tight labor market. Another thing is though that the labor market may not be as tight as we had thought it was. And, you know, I think there are many, many possible explanations. I will say though if you look for example at nonsupervisory employees in the labor report, there are– their wages are going up at 3.7 percent. And so, you do see. And wages are going up the most for people at the lower-end of the– that’s been true for the last couple of years, lower-end of the wage spectrum. So you do see wages moving up. It just– they’re not moving up at very high rates. And again– at the end of the day that probably has most to do with productivity.
NANCY MARSHALL-GENZER. Can I have just a quick follow-up? Just as far as the market not being as tight as you thought, are you saying there are still more people on the sidelines who could join the labor force?
CHAIR POWELL. Yes. And I would also say that we– if you ask people, and we did ask people, what do you think the natural rate of unemployment is? People were writing down numbers in the fives and then they were writing their numbers in the fours. And now, unemployment has been in the threes for a year and a half. And we still see wage inflation as you mentioned. The level of wage inflation has actually moved down. Although, there may be compositional effects in that number that may be to some extent about younger workers coming in at lower wages that– than retiring workers, but you wouldn’t– that shouldn’t have much of an effect actually. So why is it? It may just be that that there’s more slack in the economy. And I think we are seeing that. We’re seeing– really it showed up through higher participation. For many years, we thought that there’s a trend decline in participation. Notwithstanding that, against that trend we’ve seen prime age participation moving up pretty steadily over the last 2 or 3 years. And that’s a very positive thing but it does sort of provide more labor supply, meaning a less tight labor market.
also:
BRIAN CHEUNG. Hi there. Brian Cheung with Yahoo Finance. So before the July meeting, you said something kind of colorful. You said, “To call something hot, you would need to see some heat,” referring to the labor market. So to extend a bit, I guess on Nancy’s question, seems like the wage Phillips curve has been pretty well explored already but what would you need to see to call the labor market hot in that case? Would it be a contract or rather some sort of change in either the headline number of gains or in the unemployment rate?
CHAIR POWELL. Really, wages– I mean, we’ve– There’s so many other measures that suggest that the labor market is– I like to say labor market is strong. I don’t really want to say that it’s tight. Someone asked me a question about a hot labor market that was in the HumphreyHawkins hearings. And so, I’ll say that the labor market is strong. I don’t know that it’s tight because you’re not seeing wage increases, you know. Ultimately if it’s tight, those should be reflected in higher wage increases, so it does come down to that. You know, we look at countless measures of labor market, you know, labor utilization and there’s so many– it’s too many to count. But the one that has– that is kind of suggesting that you’re– it’s a healthy number that, you know, that sort of 3.1 percent average hourly earnings number is a decent number, 3.7 percent for production, nonsupervisory workers is more healthy. Ultimately though, we’d like to see– to call it hot, you’d want to see heat. You’d want to see, you know, higher wages. Thanks.
_____
_____
The Special Note summarizes my overall thoughts about our economic situation
SPX at 3166.37 as this post is written