Many people place emphasis on Durable Goods New Orders as a prominent economic indicator and/or leading economic indicator.
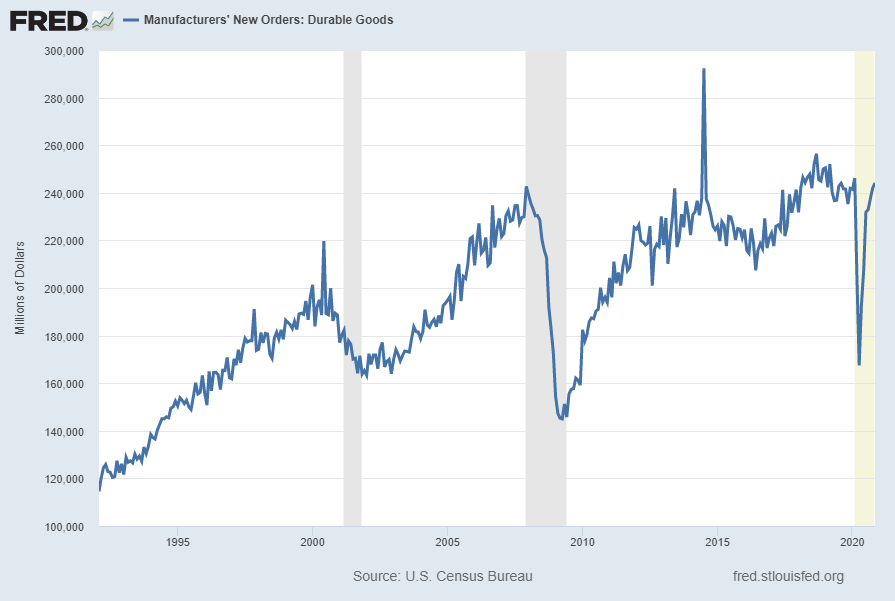
For reference, below are two charts depicting this measure.
First, from the St. Louis Fed site (FRED), a chart through November 2020, updated on December 23, 2020. This value is $244,161 ($ Millions):
(click on charts to enlarge images)
–
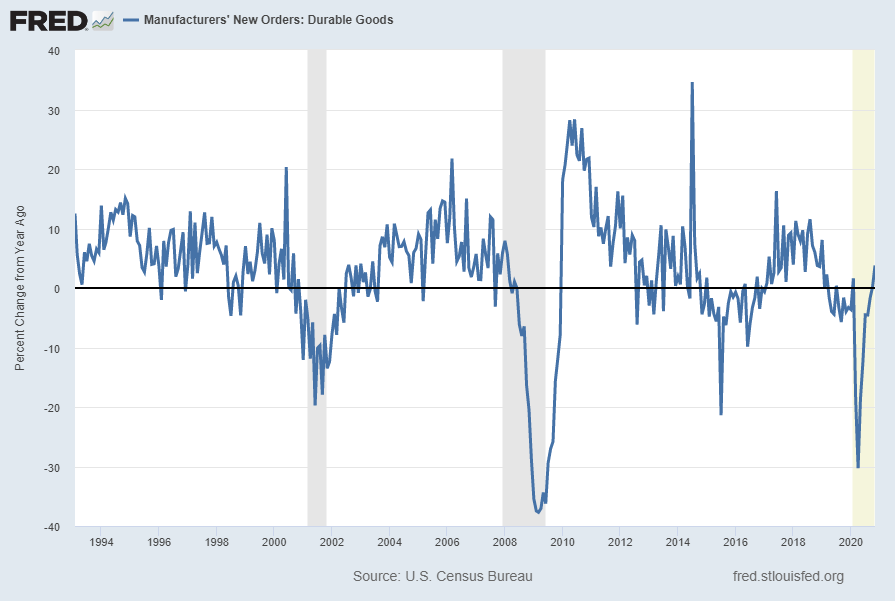
Second, here is the chart depicting this measure on a “Percentage Change from a Year Ago” basis, with a last value of 3.8%:
Data Source: FRED, Federal Reserve Economic Data, Federal Reserve Bank of St. Louis: Manufacturers’ New Orders: Durable Goods [DGORDER]; U.S. Department of Commerce: Census Bureau; accessed December 23, 2020; http://research.stlouisfed.org/fred2/series/DGORDER
_________
I post various indicators and indices because I believe they should be carefully monitored. However, as those familiar with this site are aware, I do not necessarily agree with what they depict or imply.
_____
The Special Note summarizes my overall thoughts about our economic situation
Perhaps the main reason that I write of our economic situation is that I continue to believe, based upon various analyses, that our economic situation is in many ways misunderstood. While no one likes to contemplate a future rife with economic adversity, current and future economic problems must be properly recognized and rectified if high-quality, sustainable long-term economic vitality is to be realized.
There are an array of indications and other “warning signs” – many readily apparent – that current economic activity and financial market performance is accompanied by exceedingly perilous dynamics.
I have written extensively about this peril, including in the following:
My analyses continues to indicate that the growing level of financial danger will lead to the next stock market crash that will also involve (as seen in 2008) various other markets as well. Key attributes of this next crash is its outsized magnitude (when viewed from an ultra-long term historical perspective) and the resulting economic impact. This next financial crash is of tremendous concern, as my analyses indicate it will lead to a Super Depression – i.e. an economy characterized by deeply embedded, highly complex, and difficult-to-solve problems.
For long-term reference purposes, here is a chart of the Dow Jones Industrial Average since 1900, depicted on a monthly basis using a LOG scale (updated through December 18, 2020, with a last value of 30179.05):
(click on chart to enlarge image)(chart courtesy of StockCharts.com)
_____
The Special Note summarizes my overall thoughts about our economic situation
On December 22, 2020 the latest CFO Survey (formerly called the “Duke/CFO Global Business Outlook”) was released. It contains a variety of statistics regarding how CFOs view business and economic conditions.
In this CFO Survey press release, I found the following to be the most notable excerpts – although I don’t necessarily agree with them:
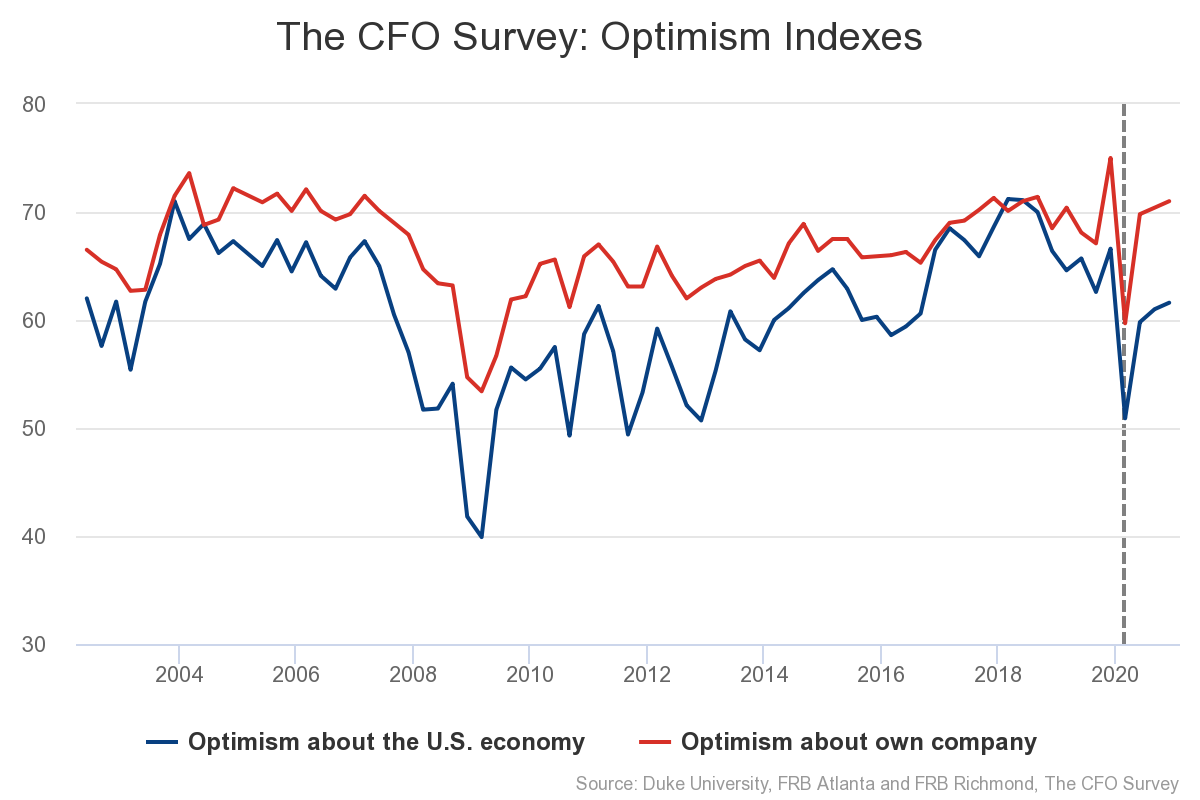
The survey was fielded from November 30 to December 11, 2020. In terms of the outlook for their own firms, CFOs rated the average optimism at 71 on a scale of 0 to 100 — slightly above the third-quarter reading of 70.4. When asked to rate their optimism about the overall U.S. economy, the average rating was 61.6, also above the third-quarter reading.
Respondents expressed considerable uncertainty about revenue expectations, however. When asked for the highest and lowest possible percentage changes in revenue for 2021, the average respondent’s forecast ranged from -1.6 percent to 13.7 percent. Also, the CFOs who are most uncertain about 2021 revenues are also least optimistic about the economy, and, particularly, the financial prospects of their own firms. This indicates that the still-uncertain environment is affecting financial decisions.
This CFO Survey contains an Optimism Index chart, with the blue line showing U.S. Optimism (with regard to the economy) at 61.6, as seen below:
[Note: The dashed vertical line denotes a moderate change in the question wording and presentation. Please see The CFO Survey Methodology for further information.]
—
It should be interesting to see how well the CFOs predict business and economic conditions going forward. I discussed past various aspects of this, and the importance of these predictions, in the July 9, 2010 post titled “The Business Environment”.
I post various economic forecasts because I believe they should be carefully monitored. However, as those familiar with this site are aware, I do not necessarily agree with many of the consensus estimates and much of the commentary in these forecast surveys.
_____
The Special Note summarizes my overall thoughts about our economic situation
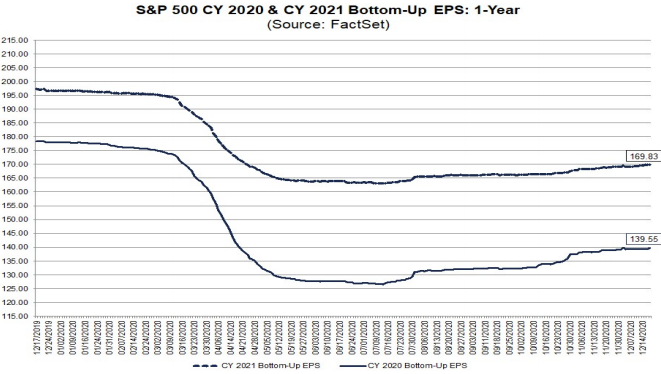
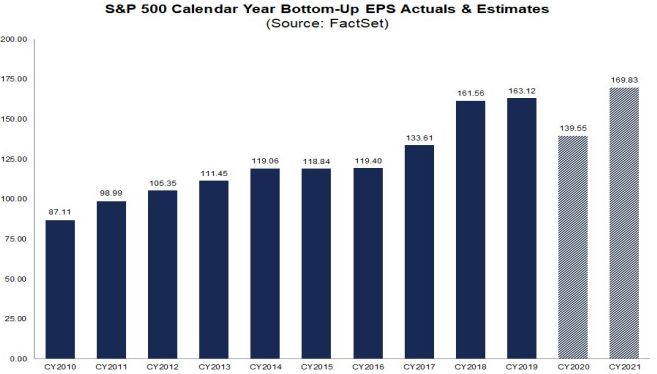
FactSet publishes a report titled “Earnings Insight” that contains a variety of information including the trends and expectations of S&P500 earnings.
For reference purposes, here are two charts as seen in the “Earnings Insight” report of December 18, 2020:
from page 26:
(click on charts to enlarge images)
from page 27:
_____
I post various economic forecasts because I believe they should be carefully monitored. However, as those familiar with this site are aware, I do not agree with many of the consensus estimates and much of the commentary in these forecast surveys.
_____
The Special Note summarizes my overall thoughts about our economic situation
As many are aware, Refinitiv publishes earnings estimates for the S&P500. (My other posts concerning S&P earnings estimates can be found under the S&P500 Earnings label)
The following estimates are from Exhibit 24 of the “S&P500 Earnings Scorecard” (pdf) of December 16, 2020, and represent an aggregation of individual S&P500 component “bottom up” analyst forecasts. For reference, the Year 2014 value is $118.78/share; the Year 2015 value is $117.46/share; the Year 2016 value is $118.10/share; the Year 2017 value is $132.00/share; the Year 2018 value is $161.93/share; and the Year 2019 value is $162.93/share:
Year 2020 estimate:
$138.17/share
Year 2021 estimate:
$169.46/share
Year 2022 estimate:
$197.62/share
_____
I post various economic forecasts because I believe they should be carefully monitored. However, as those familiar with this site are aware, I do not agree with many of the consensus estimates and much of the commentary in these forecast surveys.
_____
The Special Note summarizes my overall thoughts about our economic situation
As many are aware, Standard & Poor’s publishes earnings estimates for the S&P500. (My posts concerning their estimates can be found under the S&P500 Earnings tag)
For reference purposes, the most current estimates are reflected below, and are as of December 17, 2020:
Year 2020 estimates add to the following:
-From a “bottom up” perspective, operating earnings of $120.81/share
-From a “top down” perspective, operating earnings of N/A
-From a “bottom up” perspective, “as reported” earnings of $93.36/share
Year 2021 estimates add to the following:
-From a “bottom up” perspective, operating earnings of $166.63/share
-From a “top down” perspective, operating earnings of N/A
-From a “bottom up” perspective, “as reported” earnings of $144.00/share
_____
I post various economic forecasts because I believe they should be carefully monitored. However, as those familiar with this site are aware, I do not agree with many of the consensus estimates and much of the commentary in these forecast surveys.
_____
The Special Note summarizes my overall thoughts about our economic situation
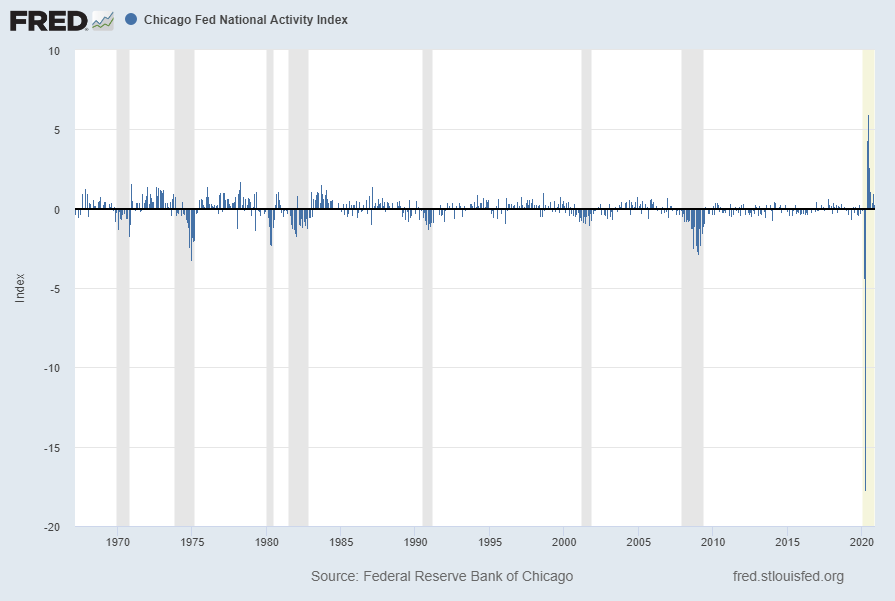
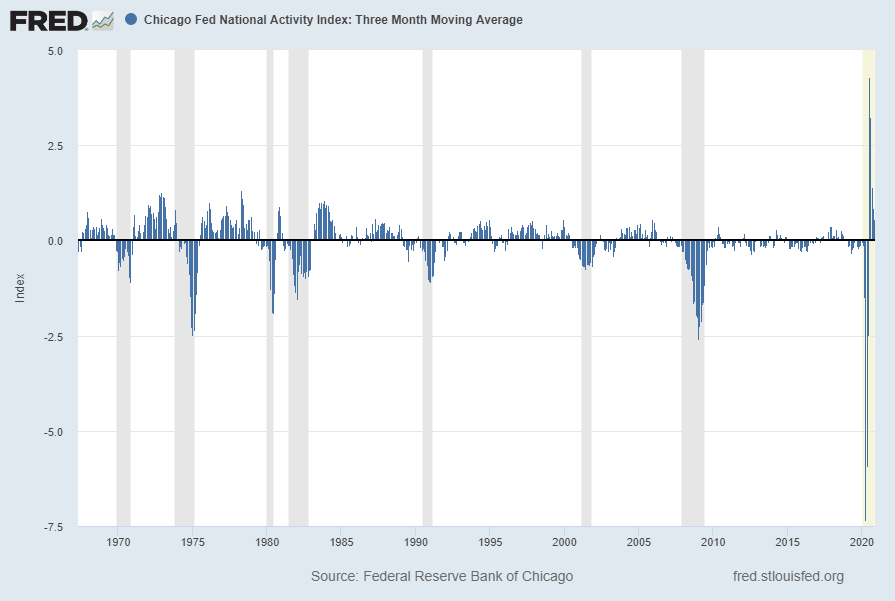
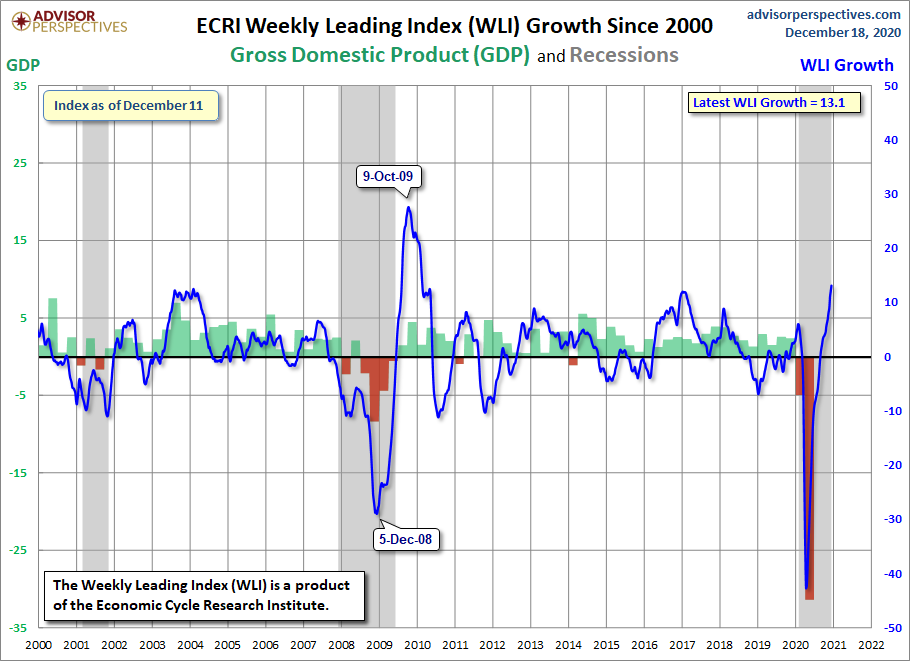
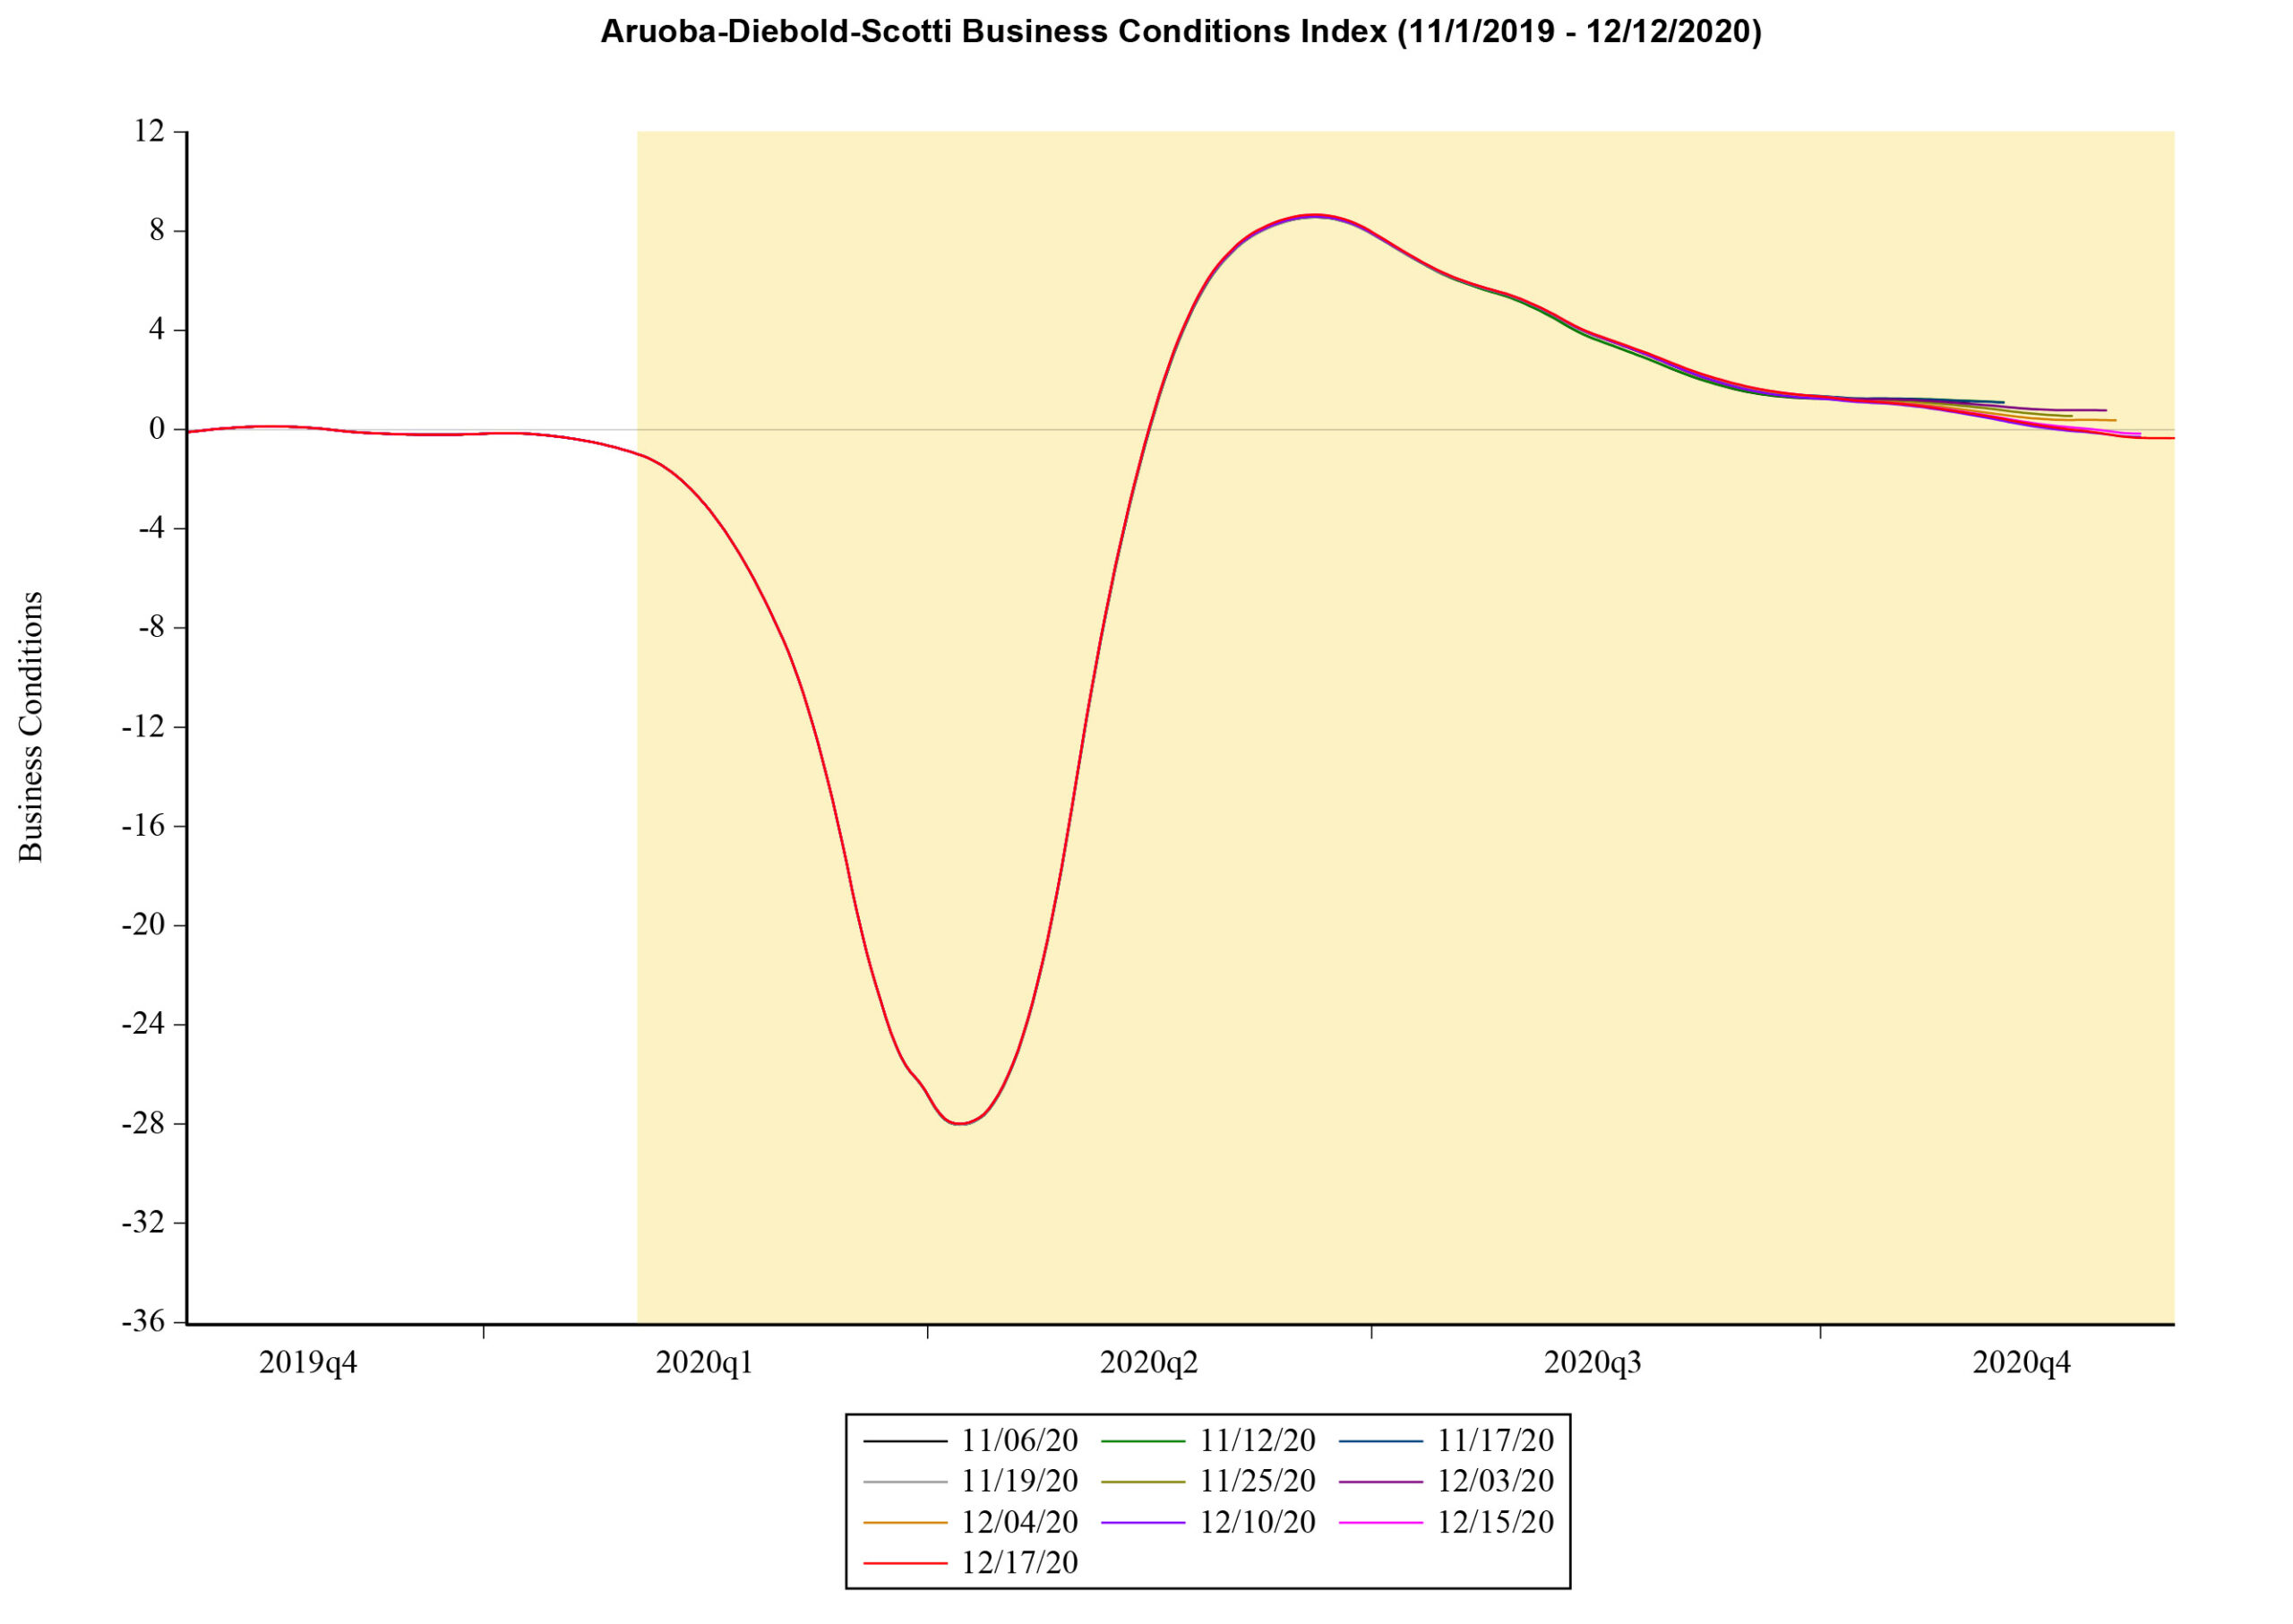
The following is an update of various indicators that are supposed to predict and/or depict economic activity. These indicators have been discussed in previous blog posts:
source: Federal Reserve Bank of Chicago, Chicago Fed National Activity Index [CFNAI], retrieved from FRED, Federal Reserve Bank of St. Louis, December 21, 2020; https://fred.stlouisfed.org/series/CFNAI
The CFNAI-MA3, with a current reading of .56:
source: Federal Reserve Bank of Chicago, Chicago Fed National Activity Index: Three Month Moving Average [CFNAIMA3], retrieved from FRED, Federal Reserve Bank of St. Louis, December 21, 2020; https://fred.stlouisfed.org/series/CFNAIMA3
The Conference Board Leading Economic Index (LEI), Coincident Economic Index (CEI), and Lagging Economic Index (LAG):
As per the December 18, 2020 Conference Board press release, titled “The Conference Board Leading Economic Index (LEI) for the U.S. Increased in November” the LEI was at 109.1, the CEI was at 103.2, and the LAG was 106.9 in November.
An excerpt from the release:
“The US LEI continued rising in November, but its pace of improvement has been decelerating in recent months, suggesting a significant moderation in growth as the US economy heads into 2021,” said Ataman Ozyildirim, Senior Director of Economic Research at The Conference Board. “Initial claims for unemployment insurance, new orders for manufacturing, residential construction permits, and stock prices made the largest positive contributions to the LEI. However, falling average working hours in manufacturing and consumers’ worsening outlook underscore the downside risks to growth from a second wave of COVID-19 and high unemployment.”
I post various indicators and indices because I believe they should be carefully monitored. However, as those familiar with this site are aware, I do not necessarily agree with what they depict or imply.
_____
The Special Note summarizes my overall thoughts about our economic situation
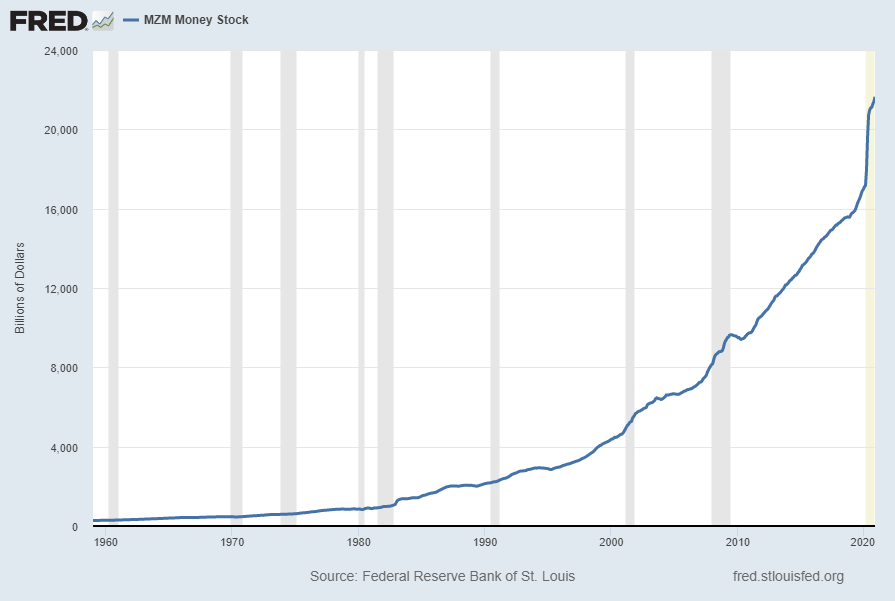
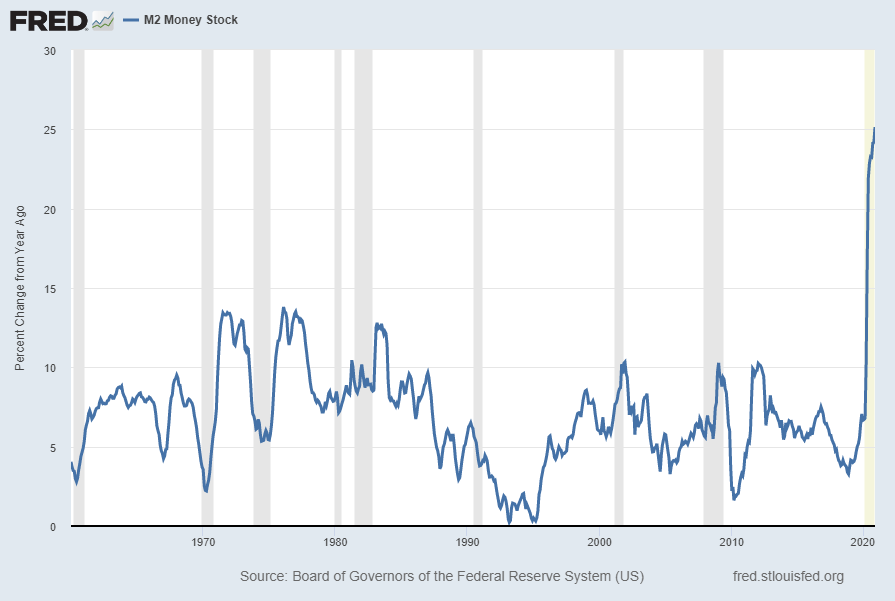
For reference purposes, below are two sets of charts depicting growth in the money supply.
The first shows the MZM (Money Zero Maturity), defined in FRED as the following:
M2 less small-denomination time deposits plus institutional money funds. Money Zero Maturity is calculated by the Federal Reserve Bank of St. Louis.
Here is the “MZM Money Stock” (seasonally adjusted) chart, updated on December 17, 2020 depicting data through November 2020, with a value of $21,640.2 Billion:
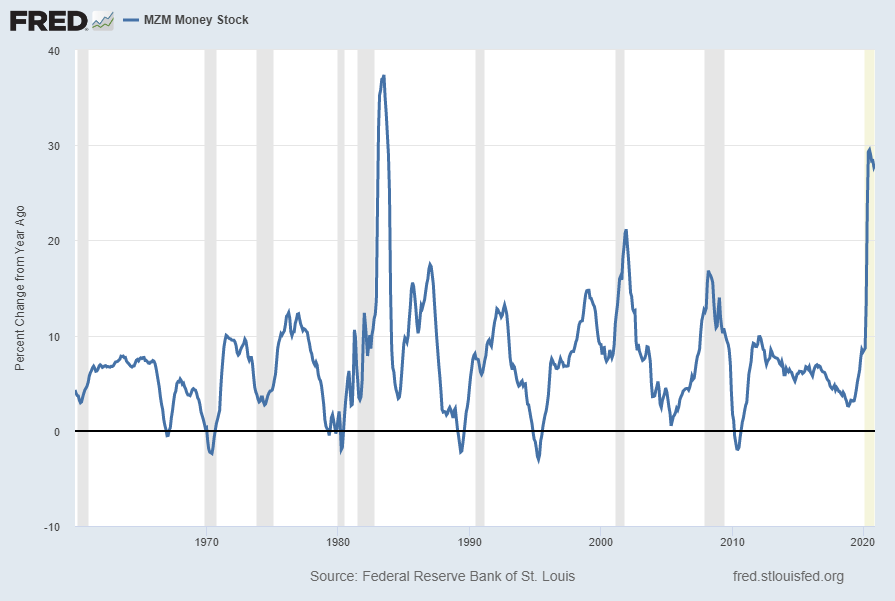
Here is the “MZM Money Stock” chart on a “Percent Change From Year Ago” basis, with a current value of 28.0%:
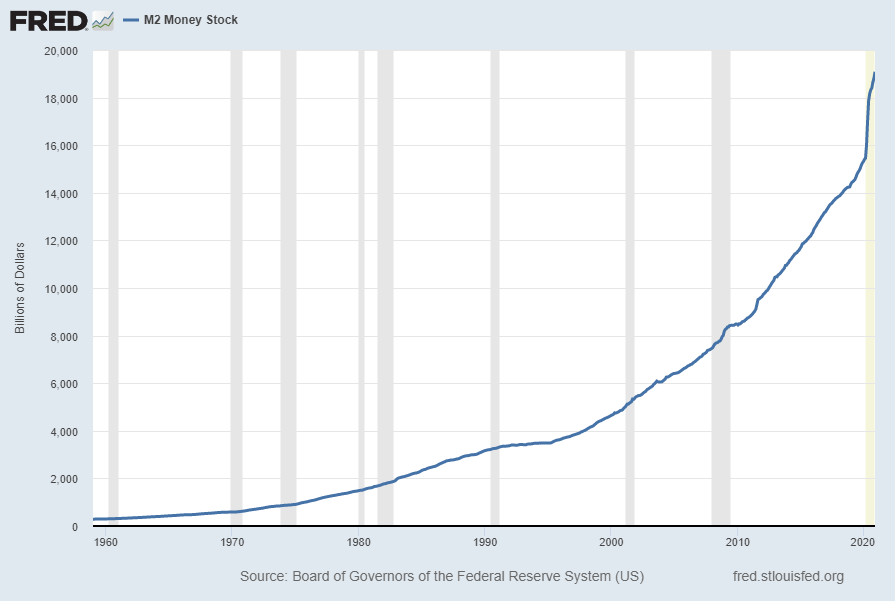
The second set shows M2, defined in FRED as the following:
M2 includes a broader set of financial assets held principally by households. M2 consists of M1 plus: (1) savings deposits (which include money market deposit accounts, or MMDAs); (2) small-denomination time deposits (time deposits in amounts of less than $100,000); and (3) balances in retail money market mutual funds (MMMFs). Seasonally adjusted M2 is computed by summing savings deposits, small-denomination time deposits, and retail MMMFs, each seasonally adjusted separately, and adding this result to seasonally adjusted M1.
Here is the “M2 Money Stock” (seasonally adjusted) chart, updated on December 17, 2020, depicting data through November 2020, with a value of $19,085.8 Billion:
Here is the “M2 Money Stock” chart on a “Percent Change From Year Ago” basis, with a current value of 25.1%: