Friday, February 10, 2023

Philadelphia Fed – 1st Quarter 2023 Survey Of Professional Forecasters

The Philadelphia Fed 1st Quarter 2023 Survey of Professional Forecasters was released on February 10, 2023.  This survey is somewhat unique in various regards, such as it incorporates a longer time frame for various measures.

The survey shows, among many measures, the following median expectations:

Real GDP: (annual average level)

full-year 2023:  1.3%

full-year 2024:  1.4%

full-year 2025:  2.2%

full-year 2026:  1.5%

Unemployment Rate: (annual average level)

for 2023: 3.8%

for 2024: 4.2%

for 2025: 4.2%

for 2026: 4.1%

Regarding the risk of a negative quarter in real GDP in any of the next few quarters, mean estimates are 40.4%, 42.4%, 44.9%, 40.6%, and 31.8% for each of the quarters from Q1 2023 through Q1 2024, respectively.

As well, there are also a variety of time frames shown (present quarter through the year 2032) with the median expected inflation (annualized) of each.  Inflation is measured in Headline and Core CPI and Headline and Core PCE.  Over all time frames expectations are shown to be in the 2.1% to 3.8% range.

_____

I post various economic forecasts because I believe they should be carefully monitored.  However, as those familiar with this site are aware, I do not agree with many of the consensus estimates and much of the commentary in these forecast surveys.

_____

The Special Note summarizes my overall thoughts about our economic situation

SPX at 4073.53 as this post is written

Thursday, February 9, 2023

Recession Probability Models – February 2023

There are a variety of economic models that are supposed to predict the probabilities of recession.

While I don’t agree with the methodologies employed or probabilities of impending economic weakness as depicted by the following two models, I think the results of these models should be monitored.

Please note that each of these models is updated regularly, and the results of these – as well as other recession models – can fluctuate significantly.

The first is the “Yield Curve as a Leading Indicator” from the New York Federal Reserve.  I wrote a post concerning this measure on March 1, 2010, titled “The Yield Curve as a Leading Indicator.”

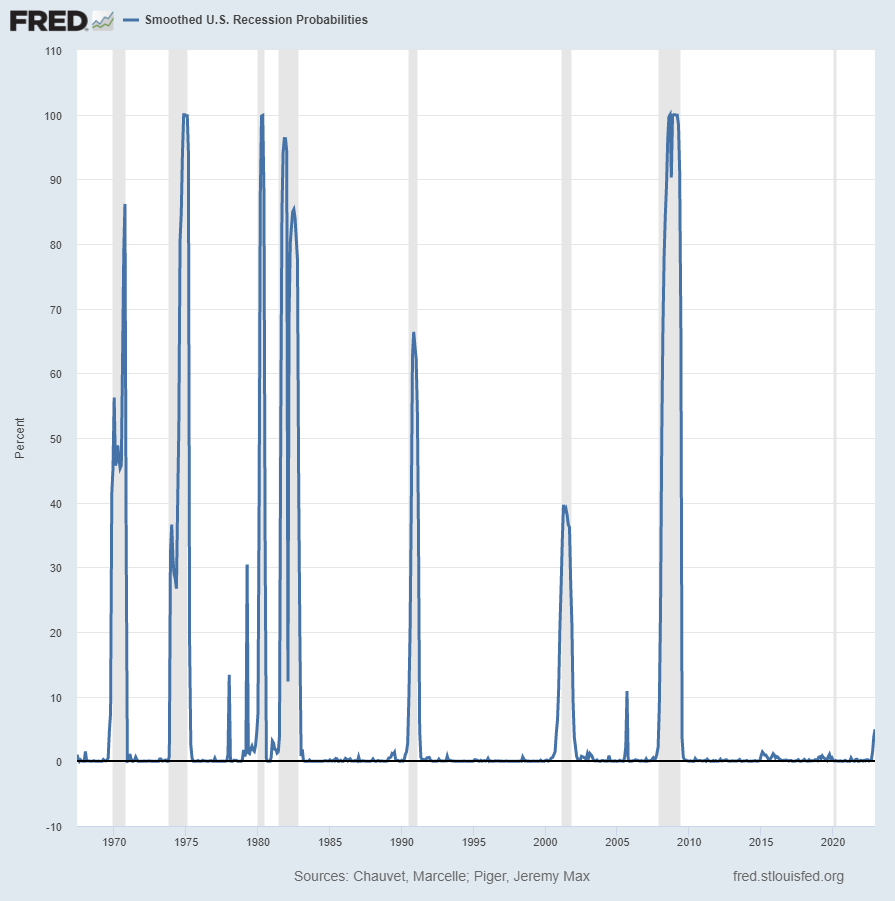
Currently (last updated February 8, 2023 using data through January 2023) this “Yield Curve” model shows a 57.1334% probability of a recession in the United States twelve months ahead.  For comparison purposes, it showed a 47.3082% probability through December 2022, and a chart going back to 1960 is seen at the “Probability Of U.S. Recession Predicted by Treasury Spread.” (pdf)

The second model is from Marcelle Chauvet and Jeremy Piger.  This model is described on the St. Louis Federal Reserve site (FRED) as follows:

Smoothed recession probabilities for the United States are obtained from a dynamic-factor markov-switching model applied to four monthly coincident variables: non-farm payroll employment, the index of industrial production, real personal income excluding transfer payments, and real manufacturing and trade sales. This model was originally developed in Chauvet, M., “An Economic Characterization of Business Cycle Dynamics with Factor Structure and Regime Switching,” International Economic Review, 1998, 39, 969-996. (http://faculty.ucr.edu/~chauvet/ier.pdf)

Additional details and explanations can be seen on the “U.S. Recession Probabilities” page.

This model, last updated on February 1, 2023 currently shows a 4.96% probability using data through December 2022.

Here is the FRED chart (last updated February 1, 2023):

Smoothed U.S. Recession Probabilities 4.96%

Data Source:  Piger, Jeremy Max and Chauvet, Marcelle, Smoothed U.S. Recession Probabilities [RECPROUSM156N], retrieved from FRED, Federal Reserve Bank of St. Louis, accessed February 9, 2023:  
http://research.stlouisfed.org/fred2/series/RECPROUSM156N

The two models featured above can be compared against measures seen in recent posts.  For instance, as seen in the January 15, 2023 post titled “The January 2023 Wall Street Journal Economic Forecast Survey“ economists surveyed averaged a 61% probability of a U.S. recession within the next 12 months.

_____

The Special Note summarizes my overall thoughts about our economic situation

SPX at 4081.50 as this post is written

Wednesday, February 8, 2023

State of the Union Address – Notable Excerpts

I found President Biden’s State of the Union Address last night (February 7, 2023) to contain some noteworthy comments.  While I could comment extensively on many parts of the speech, for now I will indicate excerpts that I found most relevant with regard to the economic situation, and may comment upon them at a future point.  I am highlighting these excerpts for many reasons; it should be noted that I do not necessarily agree with any or all of them.

Here are the excerpts I found most relevant, in the order they occurred in the speech:

For decades, the middle class was hollowed out.

Too many good-paying manufacturing jobs moved overseas. Factories at home closed down.

Once-thriving cities and towns became shadows of what they used to be.

And along the way, something else was lost.

Pride. That sense of self-worth.

I ran for President to fundamentally change things, to make sure the economy works for everyone so we can all feel pride in what we do.

To build an economy from the bottom up and the middle out, not from the top down. Because when the middle class does well, the poor have a ladder up and the wealthy still do very well. We all do well.

As my Dad used to say, a job is about a lot more than a paycheck. It’s about your dignity. It’s about respect. It’s about being able to look your kid in the eye and say, “Honey –it’s going to be OK,” and mean it.

So, let’s look at the results. Unemployment rate at 3.4%, a 50-year low. Near record low unemployment for Black and Hispanic workers.

We’ve already created 800,000 good-paying manufacturing jobs, the fastest growth in 40 years.

Where is it written that America can’t lead the world in manufacturing again?

For too many decades, we imported products and exported jobs.

Now, thanks to all we’ve done, we’re exporting American products and creating American jobs.

Inflation has been a global problem because of the pandemic that disrupted supply chains and Putin’s war that disrupted energy and food supplies.

But we’re better positioned than any country on Earth.

We have more to do, but here at home, inflation is coming down.

Here at home, gas prices are down $1.50 a gallon since their peak.

Food inflation is coming down.

Inflation has fallen every month for the last six months while take home pay has gone up.

Additionally, over the last two years, a record 10 million Americans applied to start a new small business.

Every time somebody starts a small business, it’s an act of hope.

And the Vice President will continue her work to ensure more small businesses can access capital and the historic laws we enacted.

Standing here last year, I shared with you a story of American genius and possibility.

Semiconductors, the small computer chips the size of your fingertip that power everything from cellphones to automobiles, and so much more. These chips were invented right here in America.

America used to make nearly 40% of the world’s chips.

But in the last few decades, we lost our edge and we’re down to producing only 10%. We all saw what happened during the pandemic when chip factories overseas shut down.

Today’s automobiles need up to 3,000 chips each, but American automakers couldn’t make enough cars because there weren’t enough chips.

Car prices went up. So did everything from refrigerators to cellphones.

We can never let that happen again.

That’s why we came together to pass the bipartisan CHIPS and Science Act.

We’re making sure the supply chain for America begins in America.

We’ve already created 800,000 manufacturing jobs even without this law.

With this new law, we will create hundreds of thousands of new jobs across the country.

That’s going to come from companies that have announced more than $300 billion in investments in American manufacturing in the last two years.

Outside of Columbus, Ohio, Intel is building semiconductor factories on a thousand acres – a literal field of dreams.

That’ll create 10,000 jobs. 7,000 construction jobs. 3,000 jobs once the factories are finished.

Jobs paying $130,000 a year, and many don’t require a college degree.

Jobs where people don’t have to leave home in search of opportunity.

And it’s just getting started.

Think about the new homes, new small businesses, and so much more that will come to life.

also:

And when we do these projects, we’re going to Buy American.

Buy American has been the law of the land since 1933. But for too long, past administrations have found ways to get around it.

Not anymore.

Tonight, I’m also announcing new standards to require all construction materials used in federal infrastructure projects to be made in America.

American-made lumber, glass, drywall, fiber optic cables.

And on my watch, American roads, American bridges, and American highways will be made with American products.

My economic plan is about investing in places and people that have been forgotten. Amid the economic upheaval of the past four decades, too many people have been left behind or treated like they’re invisible.

Maybe that’s you, watching at home.

You remember the jobs that went away. And you wonder whether a path even exists anymore for you and your children to get ahead without moving away.

I get it.

That’s why we’re building an economy where no one is left behind.

Jobs are coming back, pride is coming back, because of the choices we made in the last two years. This is a blue-collar blueprint to rebuild America and make a real difference in your lives.

For example, too many of you lay in bed at night staring at the ceiling, wondering what will happen if your spouse gets cancer, your child gets sick, or if something happens to you.

Will you have the money to pay your medical bills? Will you have to sell the house?

I get it. With the Inflation Reduction Act that I signed into law, we’re taking on powerful interests to bring your health care costs down so you can sleep better at night.

also:

You may have noticed that Big Oil just reported record profits.

Last year, they made $200 billion in the midst of a global energy crisis.

It’s outrageous.

They invested too little of that profit to increase domestic production and keep gas prices down.

Instead, they used those record profits to buy back their own stock, rewarding their CEOs and shareholders.

Corporations ought to do the right thing.

That’s why I propose that we quadruple the tax on corporate stock buybacks to encourage long term investments instead.

They will still make a considerable profit.

Let’s finish the job and close the loopholes that allow the very wealthy to avoid paying their taxes.

Instead of cutting the number of audits of wealthy tax payers, I signed a law that will reduce the deficit by $114 billion by cracking down on wealthy tax cheats.

That’s being fiscally responsible.

In the last two years, my administration cut the deficit by more than $1.7 trillion – the largest deficit reduction in American history.

Under the previous administration, America’s deficit went up four years in a row.

Because of those record deficits, no president added more to the national debt in any four years than my predecessor.

Nearly 25% of the entire national debt, a debt that took 200 years to accumulate, was added by that administration alone.

_____

_____

The Special Note summarizes my overall thoughts about our economic situation

SPX at 4152.99 as this post is written 

Building Financial Danger – February 8, 2023 Update

My overall analysis indicates a continuing elevated and growing level of financial danger which contains many worldwide and U.S.-specific “stresses” of a very complex nature. I have written numerous posts on this site concerning both ongoing and recent “negative developments.”  These developments, as well as other exceedingly problematical conditions, have presented a highly perilous economic environment that endangers the overall financial system.

Also of ongoing immense importance is the existence of various immensely large asset bubbles, a subject of which I have extensively written.  While all of these asset bubbles are wildly pernicious and will have profound adverse future implications, hazards presented by the bond market bubble are especially notable.

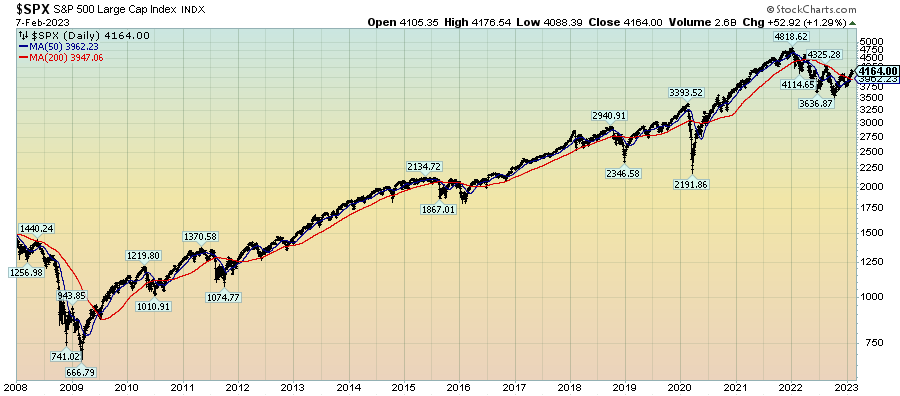
Predicting the specific timing and extent of a stock market crash is always difficult, and the immense complexity of today’s economic situation makes such a prediction even more challenging. With that being said, my analyses continue to indicate that a near-term exceedingly large (from an ultra long-term perspective) stock market crash – that would also involve (as seen in 2008) various other markets – will occur. [note: the “next crash” and its aftermath has paramount significance and implications, as discussed in the post of January 6, 2012 titled “The Next Crash And Its Significance“ and various subsequent posts in the “Economic Depression” label]

As reference, below is a daily chart since 2008 of the S&P500 (through February 7, 2023 with a last price of 4164.00), depicted on a LOG scale, indicating both the 50dma and 200dma as well as price labels:

(click on chart to enlarge image)(chart courtesy of StockCharts.com; chart creation and annotation by the author)

S&P500 since 2008

_____

The Special Note summarizes my overall thoughts about our economic situation

SPX at 4164.00 as this post is written
Monday, February 6, 2023

Charts Indicating Economic Weakness – February 2023

Throughout this site there are many discussions of economic indicators.  This post is the latest in a series of posts indicating facets of U.S. economic weakness or a notably low growth rate.

The level and trend of economic growth is especially notable at this time. As seen in various estimates, the probability of recession has grown significantly.

As seen in the January 2023 Wall Street Journal Economic Forecast Survey the consensus (average estimate) among various economists is for .17% GDP in 2023, 1.86% GDP in 2024, and 2.22% GDP in 2025.

Charts Indicating U.S. Economic Weakness

Below is a small sampling of charts that depict weak growth or contraction, and a brief comment for each:

The Yield Curve (T10Y2Y)

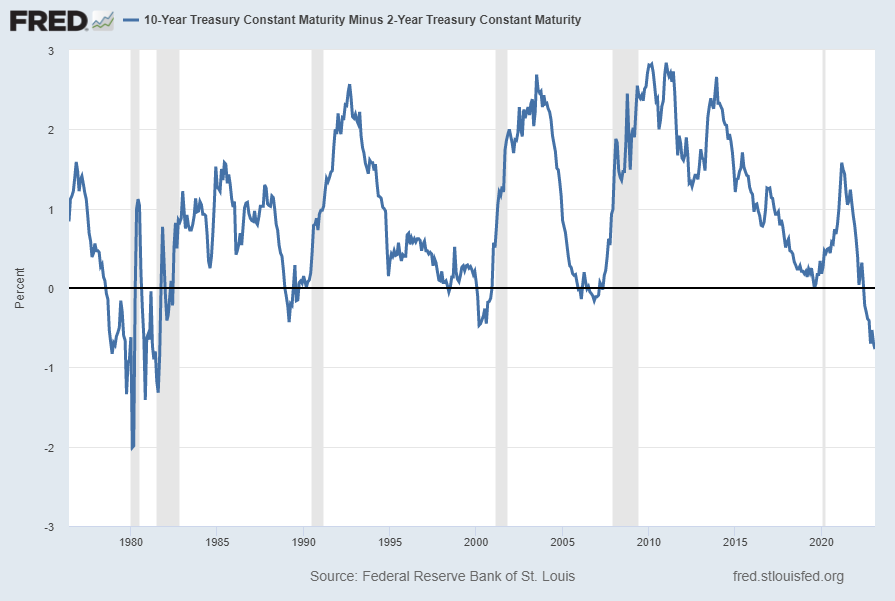
Many people believe that the Yield Curve is a leading economic indicator for the United States economy.

On March 1, 2010, I wrote a post on the issue, titled “The Yield Curve As A Leading Economic Indicator.”

While I continue to have the stated reservations regarding the “Yield Curve” as an indicator, I do believe that it should be monitored.

The U.S. Yield Curve (one proxy seen below) is negative and is (all things considered) notably very low when viewed from a long-term perspective. Below is the spread between the 10-Year Treasury Constant Maturity and the 2-Year Treasury Constant Maturity from June 1976 through the February 3, 2023 update, showing a value of -.77% [10-Year Treasury Yield (FRED DGS10) of 3.40% as of the February 3 update, 2-Year Treasury Yield (FRED DGS2) of 4.09% as of the February 3 update]:

T102Y -.77

source: Federal Reserve Bank of St. Louis, 10-Year Treasury Constant Maturity Minus 2-Year Treasury Constant Maturity [T10Y2Y], retrieved from FRED, Federal Reserve Bank of St. Louis; accessed February 6, 2023: https://fred.stlouisfed.org/series/T10Y2Y

__

Real Average Hourly Earnings

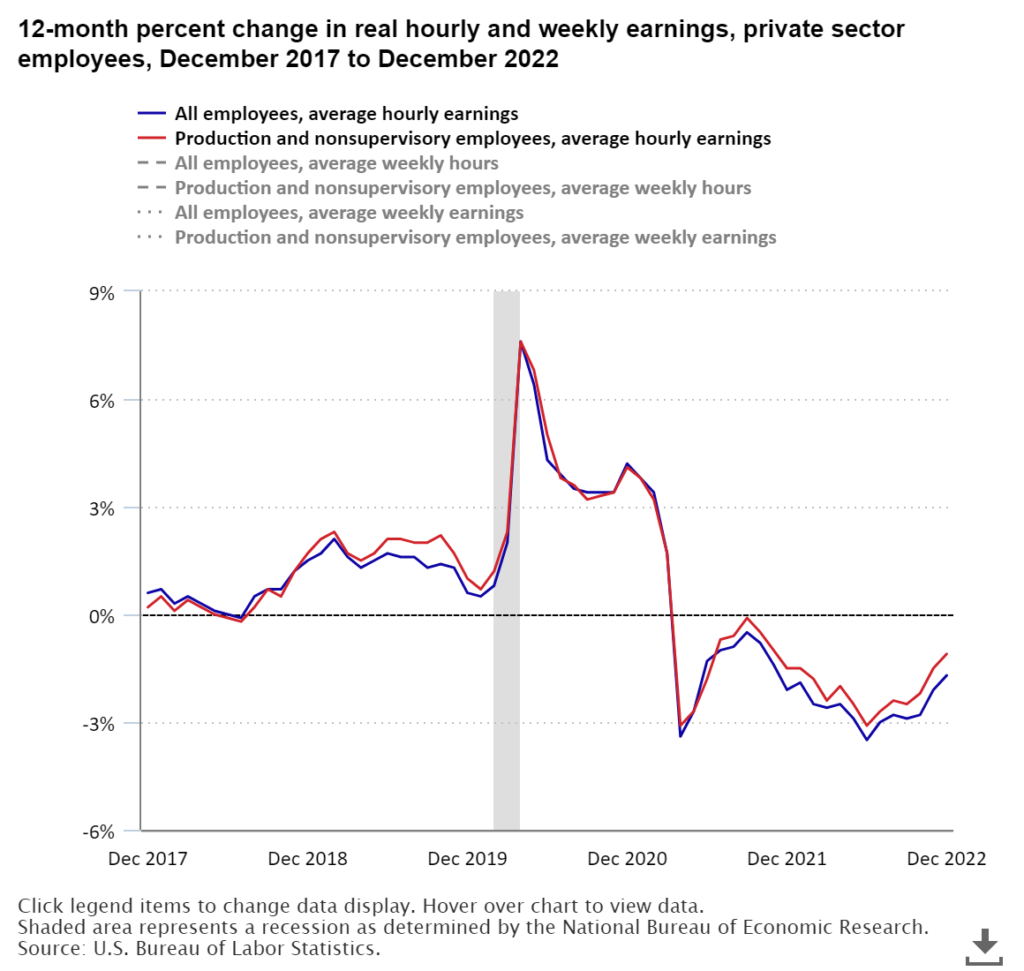
Various measures of (nominal) average hourly earnings continue to show significant growth. However, due to continuing high inflation, Real Average Hourly Earnings continues to decline and has done so for a relatively prolonged period. Shown below is a chart of earnings measures as seen in The Economics Daily of January 18, 2023 titled “Real average hourly earnings down 1.7 percent from December 2021 to December 2022”:

Real Average Hourly Earnings

source: Bureau of Labor Statistics, U.S. Department of Labor, The Economics Daily, Real average hourly earnings down 1.7 percent from December 2021 to December 2022 at https://www.bls.gov/opub/ted/2023/real-average-hourly-earnings-down-1-7-percent-from-december-2021-to-december-2022.htm (visited February 06, 2023).

__

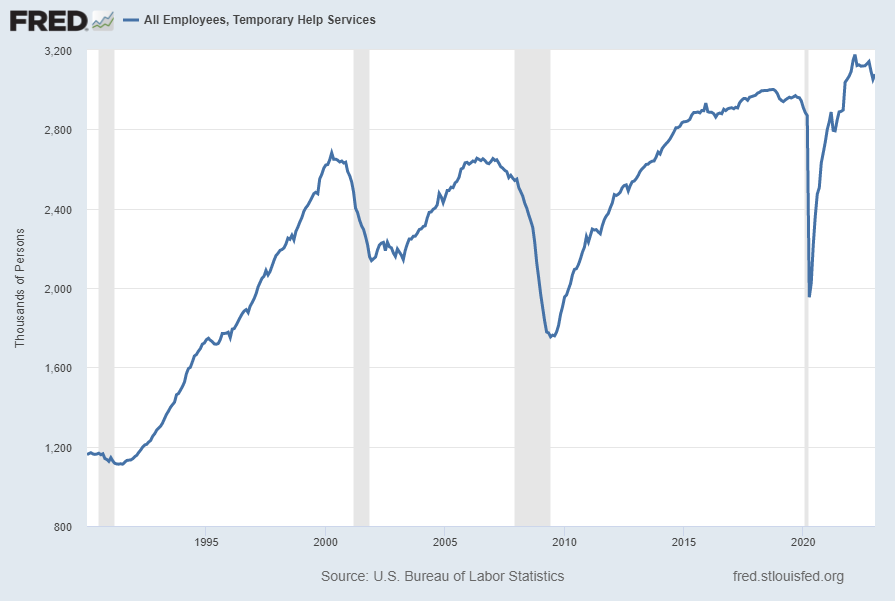
All Employees, Temporary Help Services (TEMPHELPS)

I have written extensively about many facets of employment and unemployment, as the current and future unemployment issue is of tremendous importance yet is in many ways misunderstood.

One theory regarding employment is that hiring cycles typically begin with an uptake in temporary employment.

Shown below is this measure with last value of 3,077.9 (Thousands) through January, last updated February 3, 2023:

TEMPHELPS 3077.9

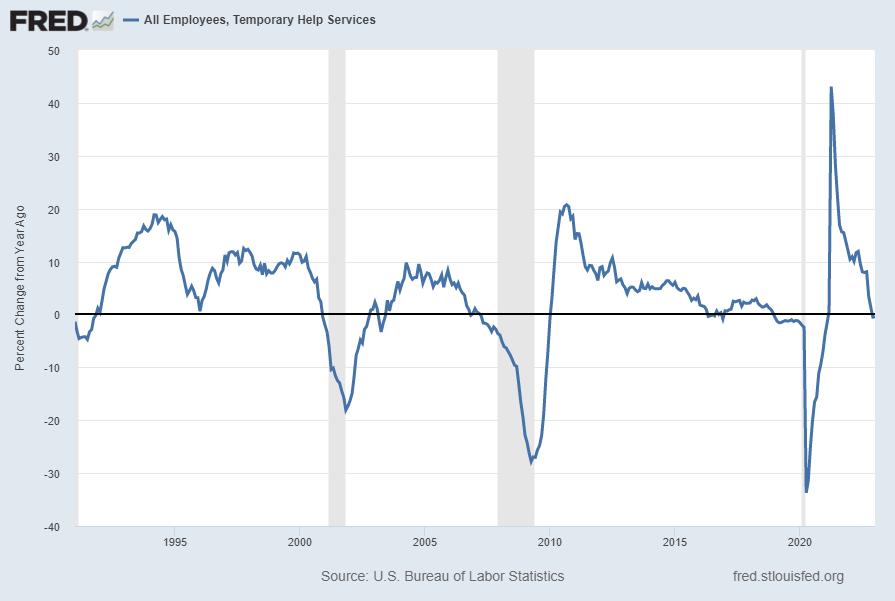
Below is this measure displayed on a “Percent Change From Year Ago” basis with value -.4%:

TEMPHELPS -.4 Percent Change From Year Ago

source: U.S. Bureau of Labor Statistics, All Employees, Temporary Help Services [TEMPHELPS], retrieved from FRED, Federal Reserve Bank of St. Louis; accessed February 6, 2023: https://fred.stlouisfed.org/series/TEMPHELPS

__

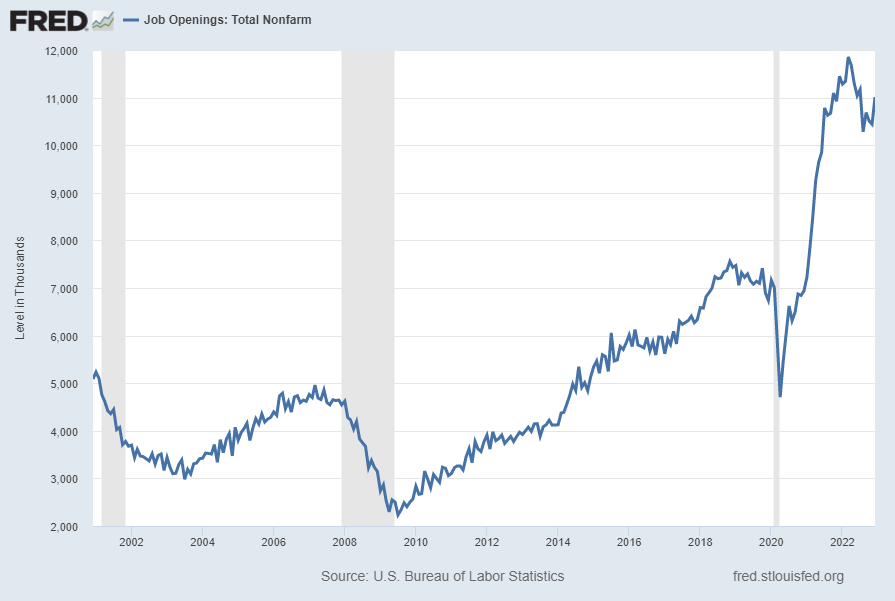
Job Openings (JTSJOL)

Job openings (Job Openings: Total Nonfarm [JTSJOL]), although still at a (very) high level, have recently declined significantly. This Job Openings measure had a value of 11,012 (Thousands) through December 2022, as of the February 1, 2023 update, as shown below:

JTSJOL 11012

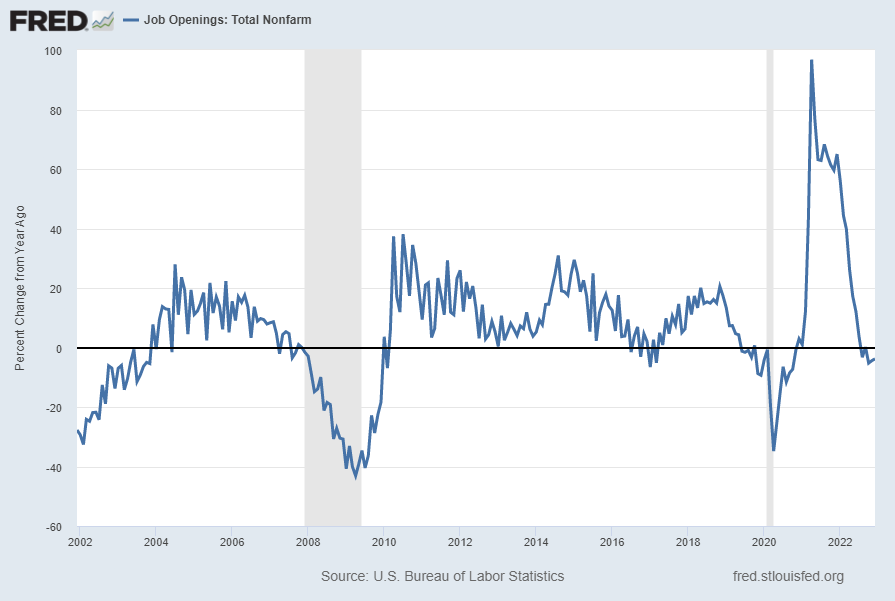
Shown below is this measure displayed on a “Percent Change From Year Ago” basis with value -3.8%:

JTSJOL -3.8 Percent Change From Year Ago

source: U.S. Bureau of Labor Statistics, Job Openings: Total Nonfarm [JTSJOL], retrieved from FRED, Federal Reserve Bank of St. Louis; accessed February 6, 2023: https://fred.stlouisfed.org/series/JTSJOL

__

Other Indicators

As mentioned previously, many other indicators discussed on this site indicate weak economic growth or economic contraction, if not outright (gravely) problematical economic conditions.

__

Other Indicators

As mentioned previously, many other indicators discussed on this site indicate weak economic growth or economic contraction, if not outright (gravely) problematical economic conditions.

_____

The Special Note summarizes my overall thoughts about our economic situation

SPX at 4107.50 as this post is written

Friday, February 3, 2023

Monthly Changes In Total Nonfarm Payroll – February 3, 2023 Update

For reference purposes, below are five charts that display growth in payroll employment, as depicted by the Total Nonfarm Payroll measures (FRED data series PAYEMS).

PAYEMS, which is seasonally adjusted, is defined in Financial Reserve Economic Data [FRED] as:

All Employees: Total Nonfarm, commonly known as Total Nonfarm Payroll, is a measure of the number of U.S. workers in the economy that excludes proprietors, private household employees, unpaid volunteers, farm employees, and the unincorporated self-employed. This measure accounts for approximately 80 percent of the workers who contribute to Gross Domestic Product (GDP).

This measure provides useful insights into the current economic situation because it can represent the number of jobs added or lost in an economy. Increases in employment might indicate that businesses are hiring which might also suggest that businesses are growing. Additionally, those who are newly employed have increased their personal incomes, which means (all else constant) their disposable incomes have also increased, thus fostering further economic expansion.

Generally, the U.S. labor force and levels of employment and unemployment are subject to fluctuations due to seasonal changes in weather, major holidays, and the opening and closing of schools. The Bureau of Labor Statistics (BLS) adjusts the data to offset the seasonal effects to show non-seasonal changes: for example, women’s participation in the labor force; or a general decline in the number of employees, a possible indication of a downturn in the economy. To closely examine seasonal and non-seasonal changes, the BLS releases two monthly statistical measures: the seasonally adjusted All Employees: Total Nonfarm (PAYEMS) and All Employees: Total Nonfarm (PAYNSA), which is not seasonally adjusted.

The series comes from the ‘Current Employment Statistics (Establishment Survey).’

The source code is: CES0000000001

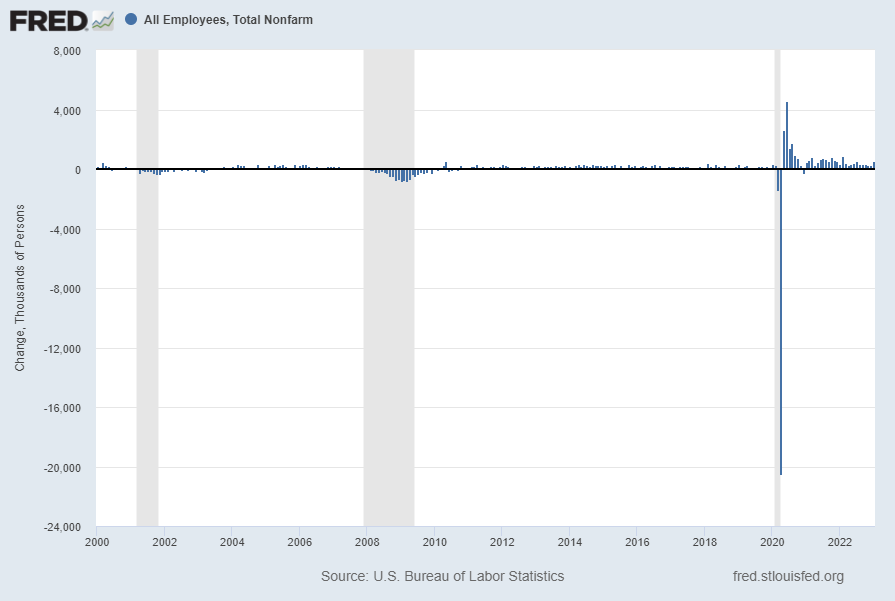
The first chart shows the monthly change in Total Nonfarm Payroll from the year 2000 through the current January 2023 report (January 2023 value of 517 (Thousands)):

(click on charts to enlarge images)

Total Nonfarm Payroll 517 Change

Data Source: FRED, Federal Reserve Economic Data, Federal Reserve Bank of St. Louis: All Employees: Total Nonfarm [PAYEMS] ; U.S. Department of Labor: Bureau of Labor Statistics; accessed February 3, 2023; https://fred.stlouisfed.org/series/PAYEMS

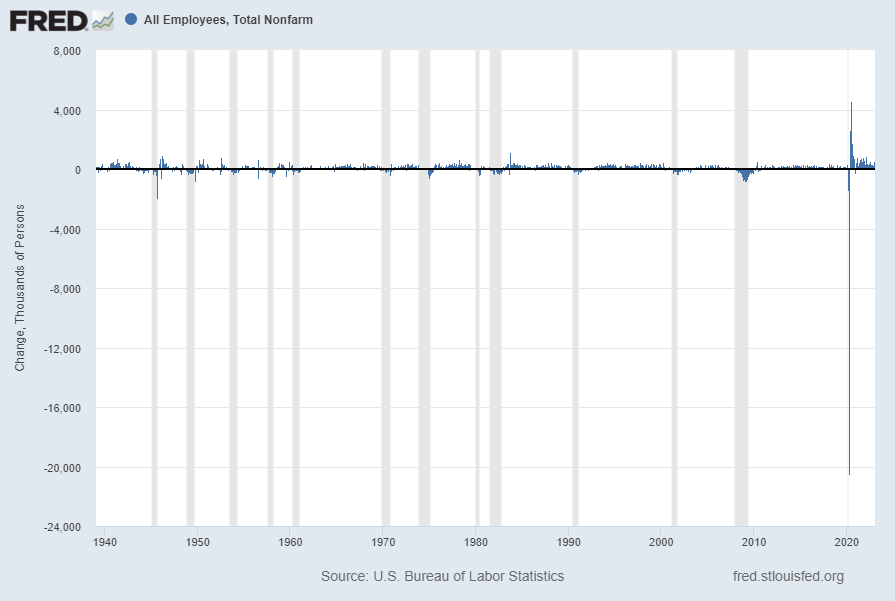
The second chart shows a longer-term chart of the same month-over-month change in Total Nonfarm Payroll (reports of February 1939 through the present report of January 2023):

Total Nonfarm Payroll 517 Change

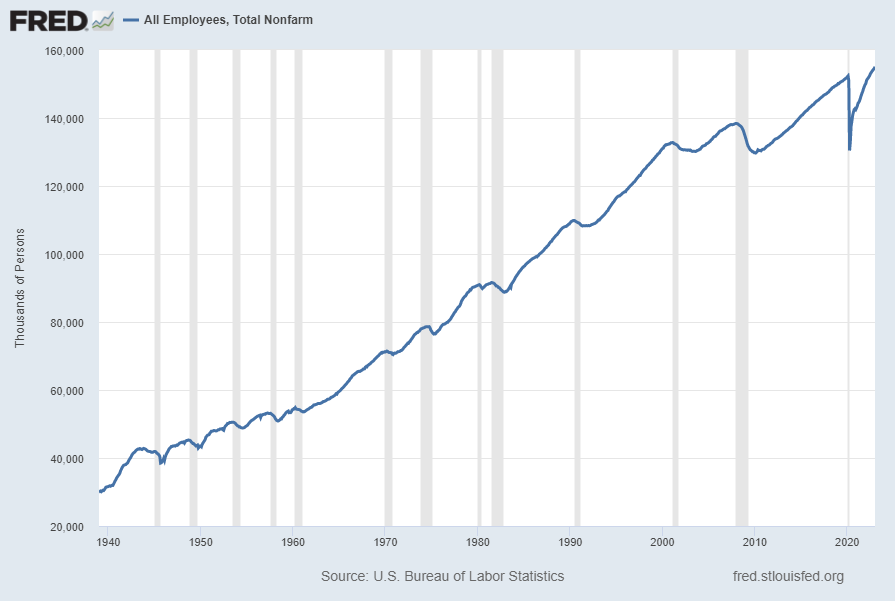
The third chart shows the aggregate number of Total Nonfarm Payroll, from the reports of January 1939 – January 2023 (January 2023 value of 155.073 million):

Total Nonfarm Payroll 155073

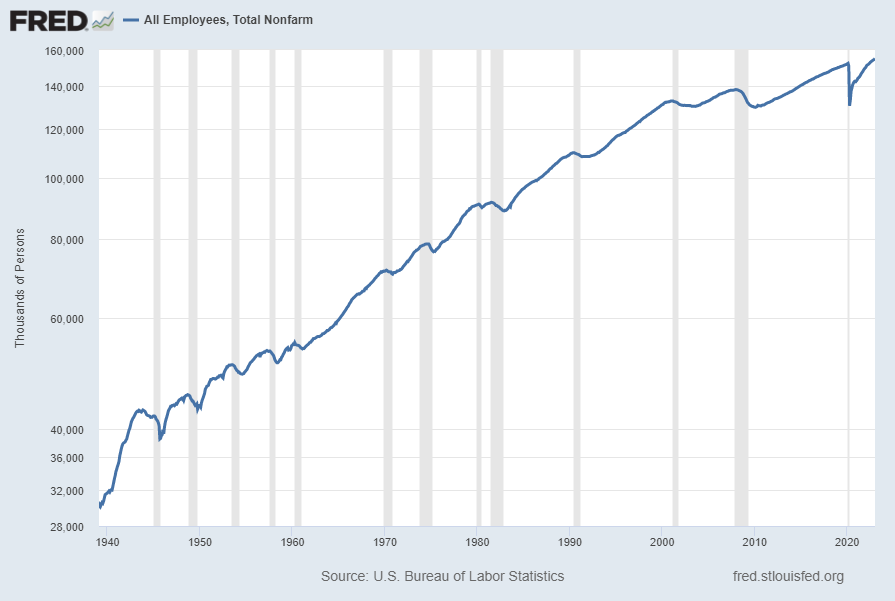
The fourth chart shows this same measure of aggregate number of Total Nonfarm Payroll as seen above but presented on a LOG scale:

Total Nonfarm Payroll 155073

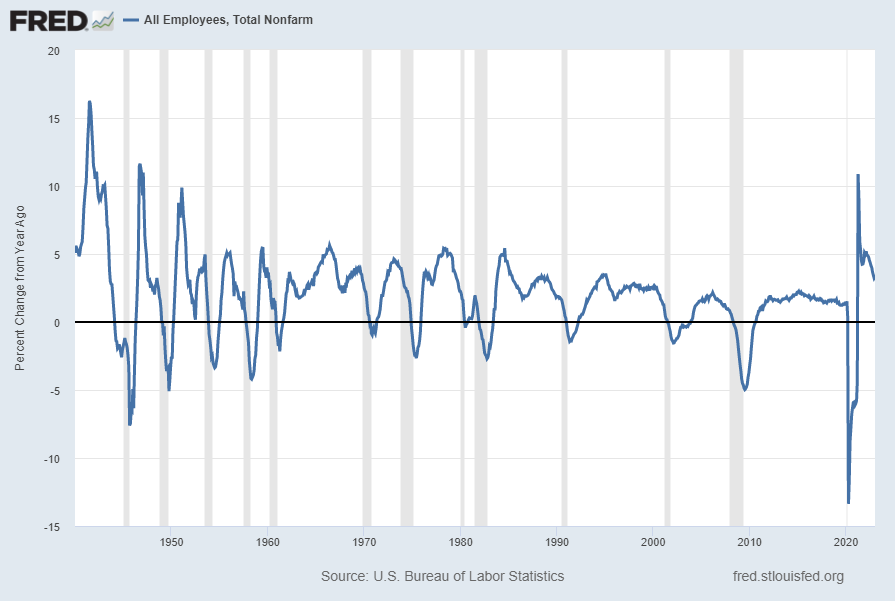
Lastly, the fifth chart shows the Total Nonfarm Payroll number on a “Percent Change from Year Ago” basis from January 1940 – January 2023: (January 2023 value of 3.3%)

Total Nonfarm Payroll 155073 3.3 Percent Change From Year Ago

_________

I post various indicators and indices because I believe they should be carefully monitored.  However, as those familiar with this site are aware, I do not necessarily agree with what they depict or imply.

_____

The Special Note summarizes my overall thoughts about our economic situation

SPX at 4176.15 as this post is written

Average Hourly Earnings Trends

I have written many blog posts concerning the worrisome trends in income and earnings.

Along these lines, one of the measures showing disconcerting trends is that of hourly earnings.

While the concept of hourly earnings can be defined and measured in a variety of ways, below are a few charts that I believe broadly illustrate problematic trends.

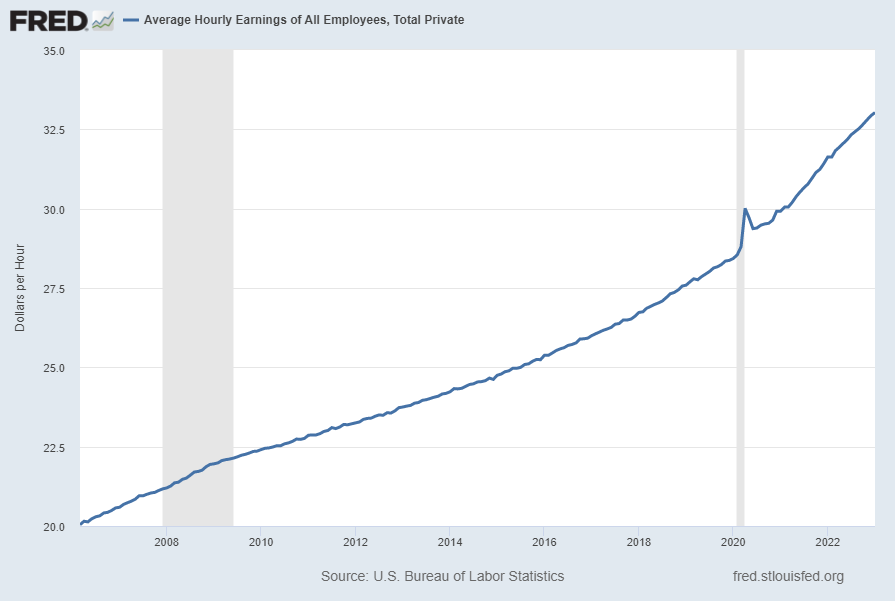
The first chart depicts Average Hourly Earnings Of All Employees: Total Private (FRED series CES0500000003)(current value = $33.03):

(click on chart to enlarge image)(chart last updated 2-3-23)

Average Hourly Earnings Of All Employees: Total Private (FRED series CES0500000003)

Data Source: FRED, Federal Reserve Economic Data, Federal Reserve Bank of St. Louis: Average Hourly Earnings of All Employees:  Total Private [CES0500000003] ; U.S. Department of Labor: Bureau of Labor Statistics; accessed February 3, 2023: 
http://research.stlouisfed.org/fred2/series/CES0500000003

This next chart depicts this same measure on a “Percentage Change From A Year Ago” basis.   While not totally surprising, I find the decline from 2009 and subsequent trend to be disconcerting:

(click on chart to enlarge image)(chart last updated 2-3-23)

Average Hourly Earnings of All Employees:  Total Private [CES0500000003] Percent Change From Year Ago

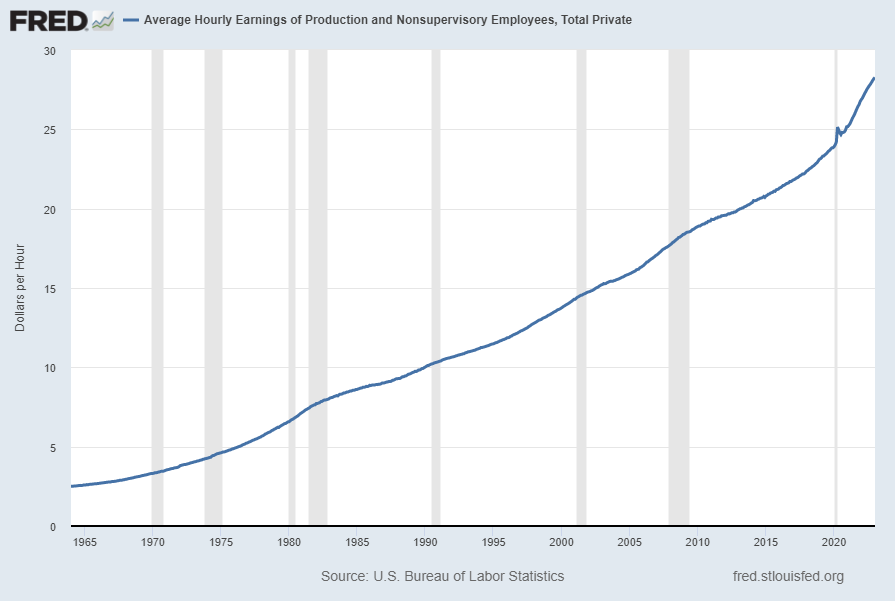
There are slightly different measures available from a longer-term perspective. Pictured below is another measure, the Average Hourly Earnings of Production and Nonsupervisory Employees – Total Private (FRED series AHETPI)(current value = $28.26):

(click on chart to enlarge image)(chart last updated 2-3-23)

AHETPI 28.26

Data Source: FRED, Federal Reserve Economic Data, Federal Reserve Bank of St. Louis: Average Hourly Earnings of Production and Nonsupervisory Employees:  Total Private [AHETPI] ; U.S. Department of Labor: Bureau of Labor Statistics;  accessed February 3, 2023: 
http://research.stlouisfed.org/fred2/series/AHETPI

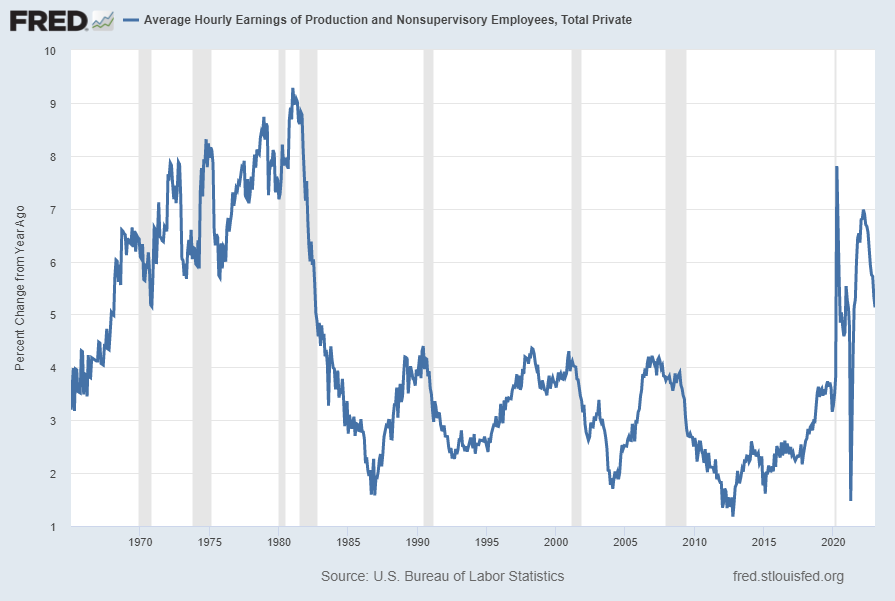
Pictured below is this AHETPI measure on a “Percentage Change From A Year Ago” basis.   While not totally surprising, I find the decline from 2009 and subsequent trend to be disconcerting:

(click on chart to enlarge image)(chart last updated 2-3-23)

AHETPI 5.1 Percent Change From Year Ago

I will continue to actively monitor these trends, especially given the post-2009 dynamics.

_________

I post various economic indicators and indices because I believe they should be carefully monitored.  However, as those familiar with this site are aware, I do not necessarily agree with what they depict or imply.

_____

The Special Note summarizes my overall thoughts about our economic situation

SPX at 4163.62 as this post is written