Friday, September 28, 2012

Long-Term Charts Of The ECRI WLI & ECRI WLI, Gr. – September 28, 2012 Update

As I stated in my July 12, 2010 post ("ECRI WLI Growth History"):
For a variety of reasons, I am not as enamored with ECRI’s WLI and WLI Growth measures as many are.
However, I do think the measures are important and deserve close monitoring and scrutiny.
The movement of the ECRI WLI and WLI, Gr. is particularly notable at this time, as ECRI publicly announced on September 30, 2011 that the U.S. was “tipping into recession,” and ECRI has reaffirmed that view since, most recently in a September 13 release titled “The 2012 Recession:  Are We There Yet?” and September 13 Bloomberg video titled “Recession Update.”

Other past notable 2012 reaffirmations of the September 30, 2011 recession call by ECRI were seen (in chronological order)  on March 15 (“Why Our Recession Call Stands”) as well as various interviews and statements the week of May 6, including:
Also, subsequent to May 2012:


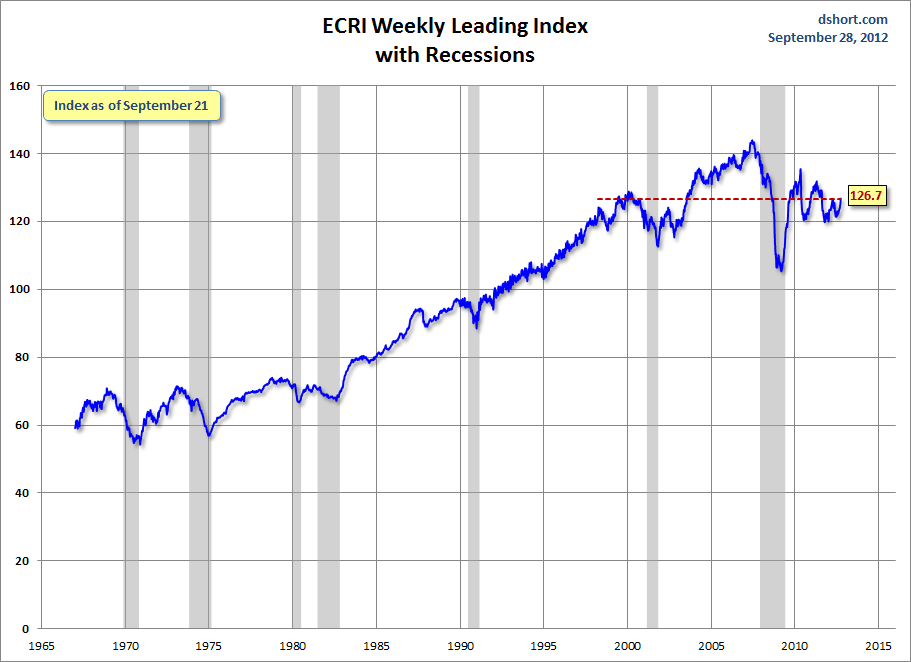
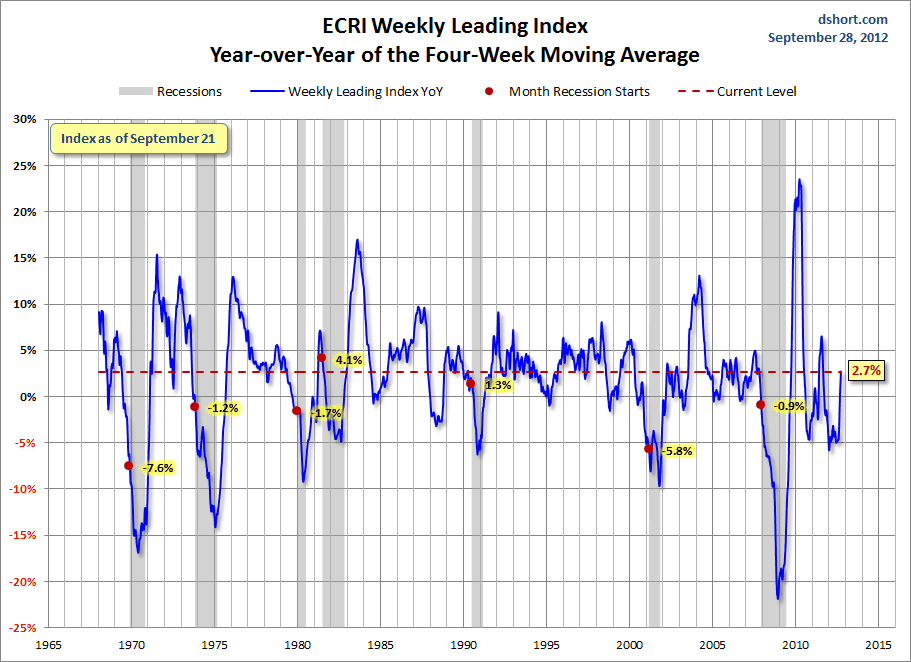
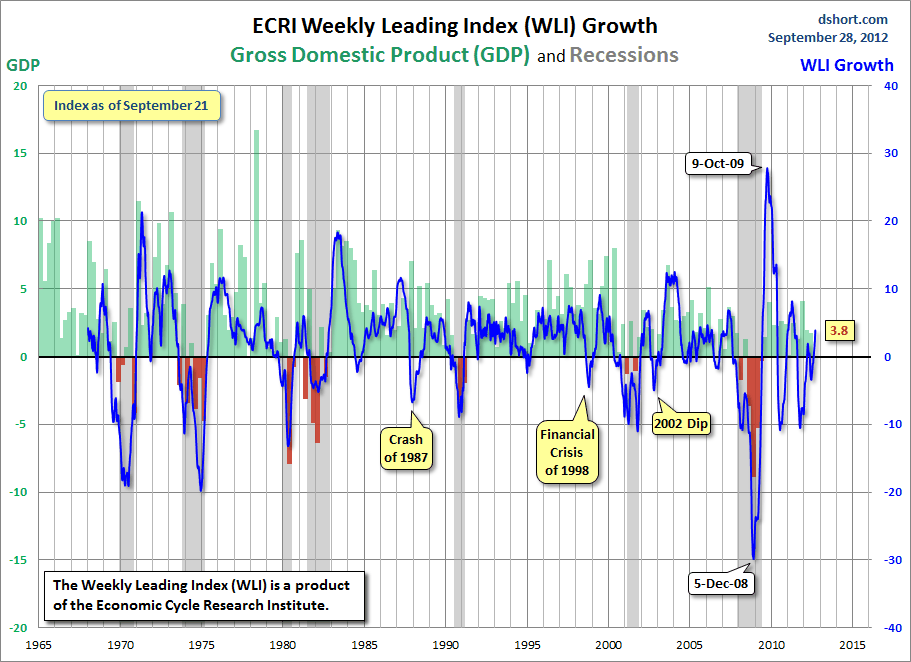
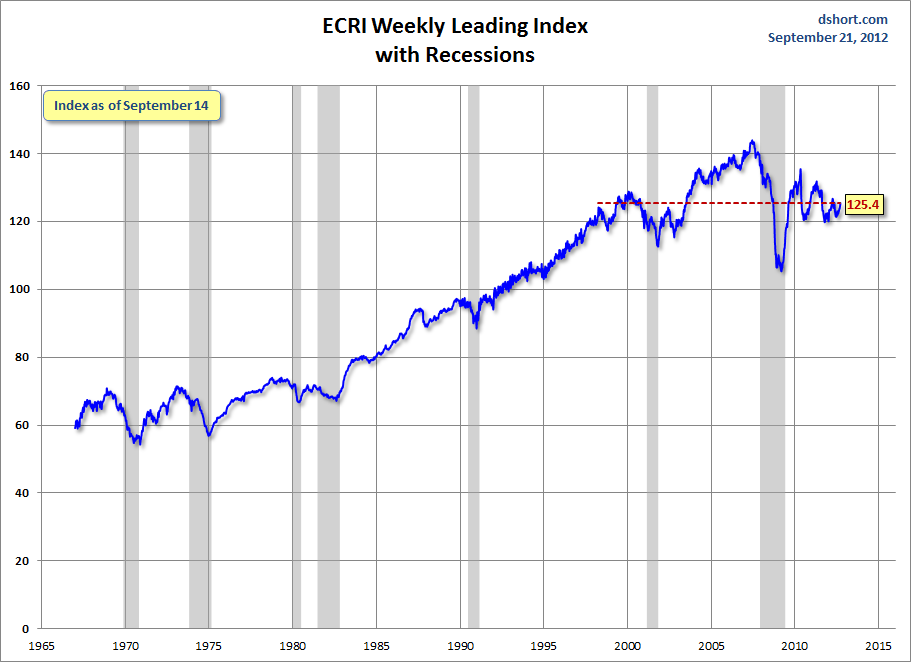
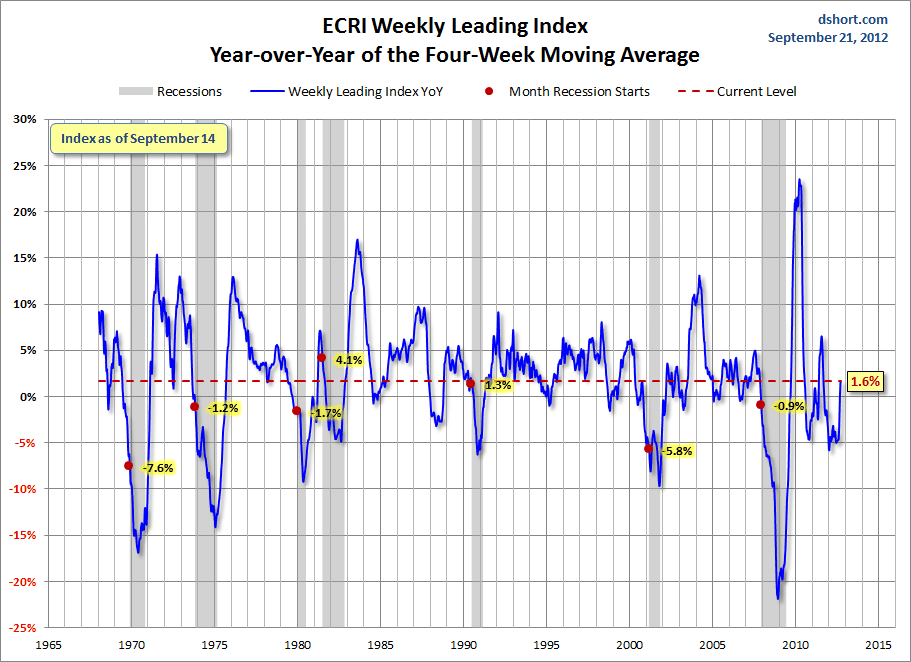
Below are three long-term charts, from Doug Short’s blog post of September 28 titled “ECRI Weekly Leading Index Growth at Highest Level Since June 2011.”  These charts are on a weekly basis through the September 28 release, indicating data through September 21, 2012.

Here is the ECRI WLI (defined at ECRI’s glossary):

(click on charts to enlarge images)


-

This next chart depicts, on a long-term basis, the Year-over-Year change in the 4-week moving average of the WLI:


-

This last chart depicts, on a long-term basis, the WLI, Gr.:


_________

I post various economic indicators and indices because I believe they should be carefully monitored.  However, as those familiar with this blog are aware, I do not necessarily agree with what they depict or imply.
_____

The Special Note summarizes my overall thoughts about our economic situation

SPX at 1440.42 as this post is written

St. Louis Financial Stress Index – September 27, 2012 Update


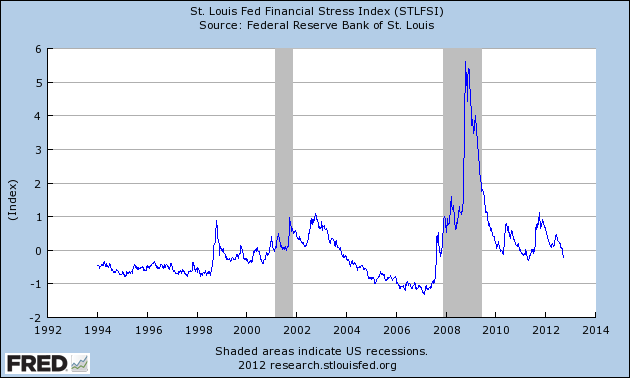
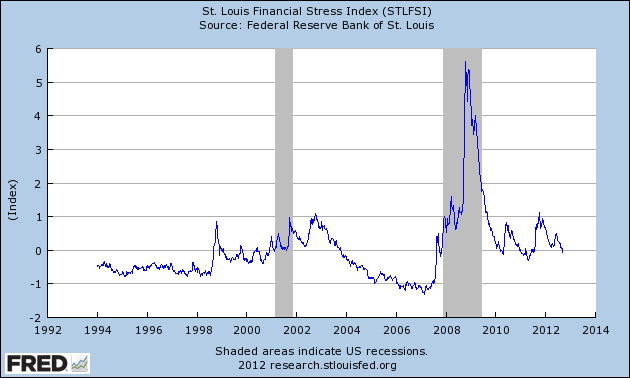
On March 28, 2011 I wrote a post ("The STLFSI") about the  STLFSI (St. Louis Fed’s Financial Stress Index) which is supposed to measure stress in the financial system.  For reference purposes, the most recent chart is seen below.  This chart was last updated on September 27, incorporating data from December 31,1993 to September 21, 2012 on a weekly basis.  The September 21, 2012 value is -.211 :

(click on chart to enlarge image)


_________

I post various indicators and indices because I believe they should be carefully monitored.  However, as those familiar with this blog are aware, I do not necessarily agree with what they depict or imply.
_____

The Special Note summarizes my overall thoughts about our economic situation

SPX at 1447.15 as this post is written

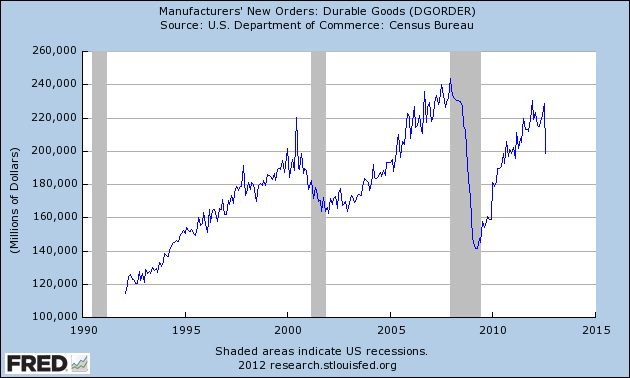
Durable Goods New Orders – Long-Term Charts Through August 2012


Many people place emphasis on Durable Goods New Orders as a prominent economic indicator and/or leading economic indicator.

For reference, here are a few charts depicting this measure.

First, from the St. Louis Fed site (FRED), a chart through August, last updated on September 27.  This value is 198,494 ($ Millions) :

(click on charts to enlarge images)


-

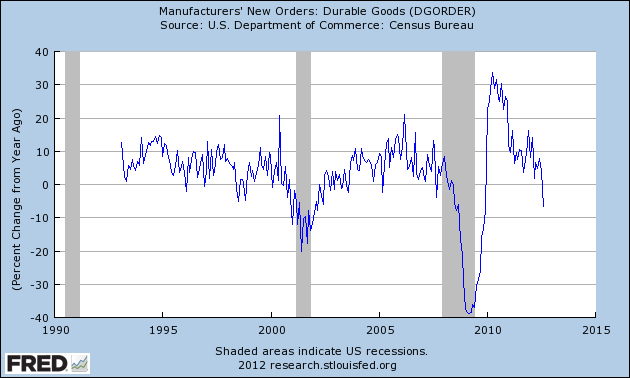
Here is the chart depicting this measure on a "Percentage Change from a Year Ago" basis:


-

Lastly, a chart from Doug Short’s post of September 27 titled “Durable Goods Orders Do a Cliff Dive, Down 13.2%” showing the Durable Goods New Orders vs. the S&P500′s monthly average of daily closes:


_____

The Special Note summarizes my overall thoughts about our economic situation

SPX at 1447.15 as this post is written

Thursday, September 27, 2012

Deloitte “CFO Signals” Report 3Q 2012 – Notable Aspects


Recently Deloitte released their “CFO Signals” “high-level” report for the 3rd Quarter of 2012.

As seen in page 2 of the report, "Eighty-five CFOs responded during the two weeks ended August 24. More than 75% are from public companies, and 80% are from companies with more than $1B in annual revenue."

Here are some excerpts that I found notable:

from page 4 :

CFOs’ expectations for sales and earnings growth both dropped precipitously this quarter, and their expectations for capital investment and hiring followed suit.

also:

This quarter’s survey results show that global economic developments have taken a large toll on CFOs’ expectations for their home economies. In the U.S., more than 80% of CFOs believe their economy is either stalling or about to stall, and the proportion is about 65% for both Canada and Mexico.  This pessimism is driving the strongest economic concerns we have seen in this survey. Nearly 60% of CFOs mention U.S. or global economic conditions as their most worrisome risk, and one third of those CFOs specifically mention European conditions.

also:

But this quarter’s CFO expectations appear to confirm the case for worry – especially in the U.S. Sales growth expectations of 4.8%* are a new survey low –well below the previous low of 5.9%* in the first quarter of this year. U.S. expectations are just 4.3%* (6.7%* last quarter), with Canada and Mexico both at about 6.5%* (they were 5.9% and 8.7% last quarter, respectively).  Earnings growth expectations also declined, with this quarter’s 8.0%* a new survey low – well below last quarter’s 10.5%*. The median expectation fell from 8.5%* to just 6.0%* (another survey low). U.S. estimates are lowest at 7.2%* (12.3%* last quarter), with Canada at 8.1%* (4.6%* last quarter) and Mexico at 8.9% (11.7%* last quarter).

from page 5, regarding "Investment and hiring estimates tumble" :

Capital investment growth expectations, for example, fell precipitously from 11.4% to just 4.7% this quarter – well below the previous low of 8%. Just over half of CFOs expect gains at all, and the median expectation is now just 3% (also survey lows).  Hiring also took a major hit, with domestic hiring expectations falling to another survey low at just 0.6%.

from page 11, regarding "Economy" :

Just over half of U.S. CFOs believe the economy is still growing, but nearly three quarters of those CFOs believe it is beginning to stall. Moreover, about 45% believe the economy is already stalling, and just under one third of those CFOs believe a contraction is next. Together, this means that more than 80% of U.S. CFOs expect their economy to stall or contract.

from page 15, regarding "Industry - Top Challenges" :

Pricing trends maintained the top spot this quarter, continuing its threequarter rise to 50%. They are a top-two concern in all sectors except Financial Services.

also:

Market contraction concerns rose to 36% (driven mostly by high importance in Manufacturing and Technology), and overcapacity and excess inventoryconcerns held steady at 23% (with high importance in Manufacturing). Market growth challenges held steady at 23% and are a top-two challenge for Financial Services.

from page 16, regarding "Company - Top Challenges" :

Revenue from existing markets again tops this quarter’s list with 58% of all CFOs naming it a top challenge – roughly the same percentage as last quarter. It is again the top company challenge for all industries – a phenomenon that occurred for the first time last quarter. Revenue from new markets held steady at a survey-low 21%, consistent with a possible scaling back of geographic expansion in response to conditions in Europe and Asia.
_____

I post various business and economic surveys because I believe they should be carefully monitored.  However, as those familiar with this blog are aware, I do not necessarily agree with many of the consensus estimates and much of the commentary in these surveys.
_____

The Special Note summarizes my overall thoughts about our economic situation

SPX at 1433.32 as this post is written
Wednesday, September 26, 2012

Consumer Confidence Surveys – As Of September 26, 2012


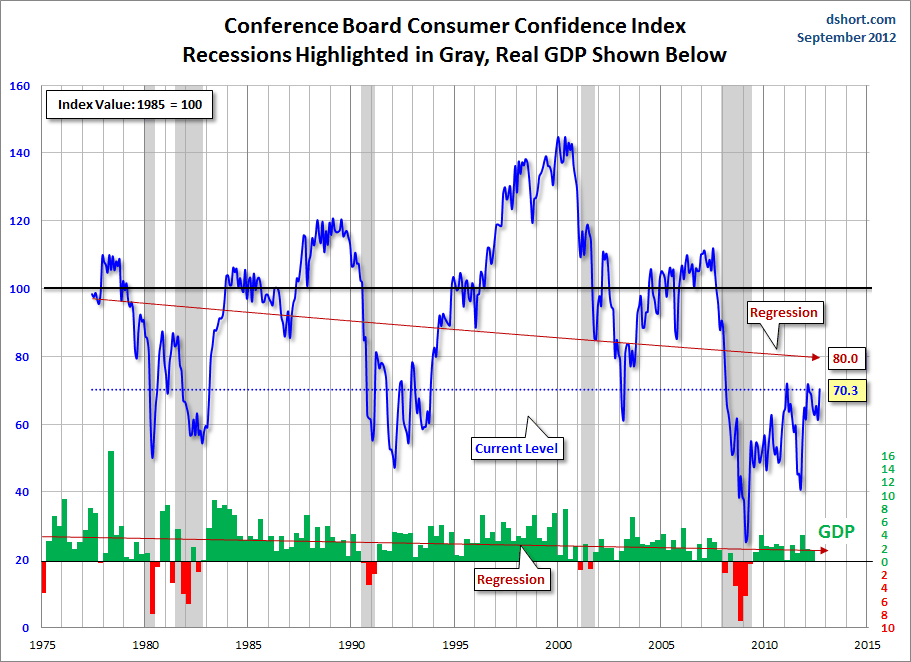
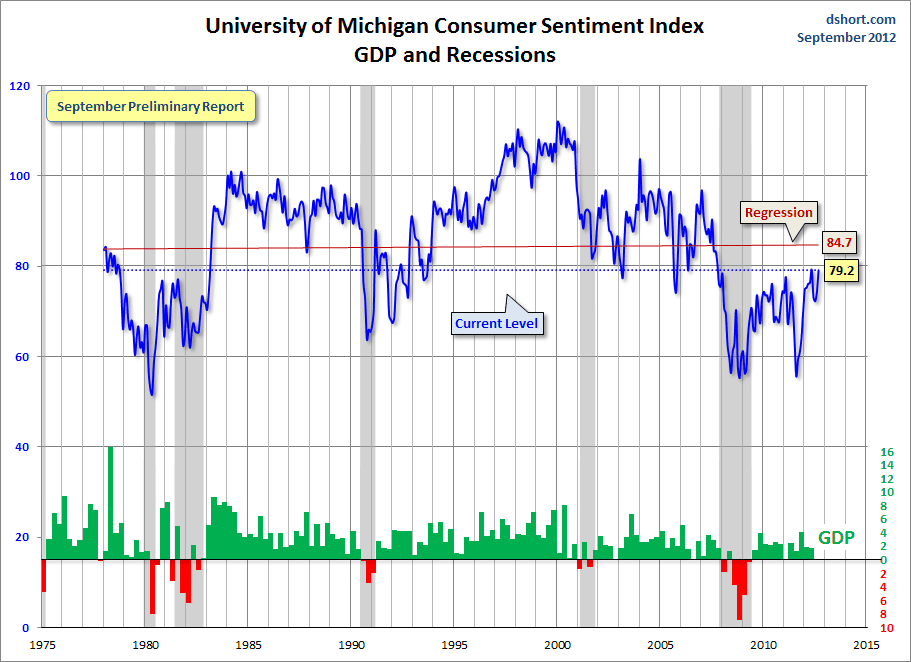
Doug Short had a blog post of September 25 ("September Consumer Confidence Surprises to the Upside") in which he presents the Conference Board Consumer Confidence and Thomson/Reuters University of Michigan Consumer Sentiment Index charts.  They are presented below:

(click on charts to enlarge images)


-


-

There are a few aspects of the above charts that I find highly noteworthy.  Of course, the continuing subdued absolute levels of these two surveys is disconcerting.

Also, I find the “behavior” of these readings to be quite disparate as compared to the other post-recession periods, as shown in the charts between the gray shaded areas (the gray areas denote recessions as defined by the NBER.)

While I don’t believe that confidence surveys should be overemphasized, I find these readings to be very problematical, especially in light of a variety of other highly disconcerting measures highlighted throughout this blog.
_____

The Special Note summarizes my overall thoughts about our economic situation

SPX at 1434.69 as this post is written
Tuesday, September 25, 2012

Financial Stocks – September 25, 2012 Update Concerning Poor “Price Action”


On June 29, 2011 I wrote a blog post titled “Financial Stocks – Notable Price Action.”

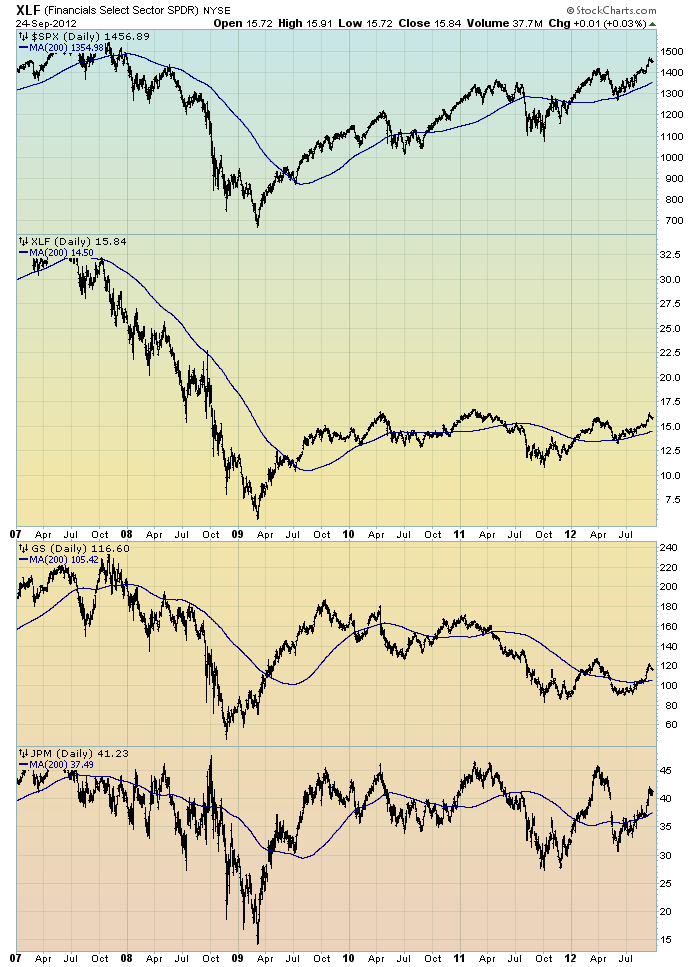
Although financial stocks have increased in price in 2012, I continue to believe that the longer-term “price action” of various financial stocks is disconcerting.  I view the poor performance of these financial and brokerage stocks to be one indicator among (very) many that serves as a “red flag” as to the financial markets and economy as a whole.

Here is an updated chart to that shown in the aforementioned June 29, 2011 post.  It shows the XLF (the financial ETF) on a daily basis since 2007.  As well, the S&P500 is plotted above it, with GS and JPM shown below it.  The blue line on each indicates the 200dma:

(click on chart image to enlarge)(chart courtesy of StockCharts.com; chart created by and annotated by author)


_____

The Special Note summarizes my overall thoughts about our economic situation

SPX at 1451.83 as this post is written
Financial Stocks – Relative Price To Overall Stock Market – September 25, 2012 Update


In the June 29, 2011 post (“Financial Stocks – Notable Price Action”) I wrote the following:
I think that the relatively poor “price action” of various financial stocks is notable.  It is one of many current indications that overall stock market health is not as strong as a casual glance at the major indices would indicate.
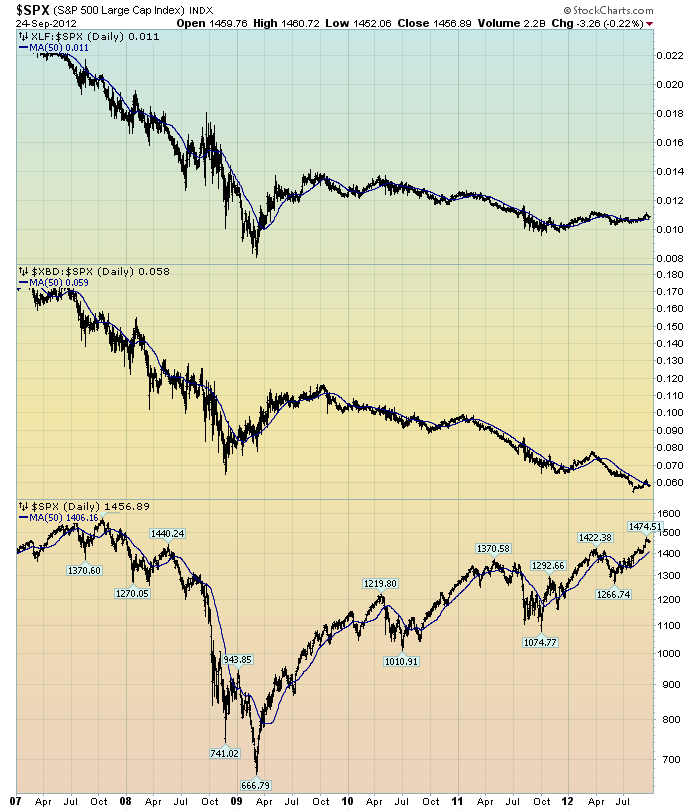
I continue to believe that the lagging / “sagging” price of various financial stocks is highly notable.  Here is a chart that I created a while ago that provides another view of the poor “price action” of the financial stocks vs. that of the entire stock market, as depicted by the S&P500:

(click on chart to enlarge image)(chart courtesy of StockCharts.com; chart created by and annotated by author)


-

The above chart is depicted on a daily basis, LOG scale, since 2007.   On each of the three plots, a blue line depicts the 50dma for perspective.

As one can see, there has been an interesting progression of the relative price of the XLF (Financial SPDR) vs. the S&P500, as seen in the top of the chart.  In the middle of the chart, the same can be seen in the $XBD (Broker/Dealer Index).  Generally, since mid-2009, the price of both the XLF and $XBD have been on a slow downward trajectory relative to the price of the S&P500.  The S&P500 is plotted on the bottom of the chart.

In my experience, any time the financials lag the general stock market for a considerable period, it is generally a “red flag” that should be closely monitored.
_____

The Special Note summarizes my overall thoughts about our economic situation

SPX at 1456.89 as this post is written

Monday, September 24, 2012

Updates On Economic Indicators September 2012


Here is an update on various indicators that are supposed to predict and/or depict economic activity.  These indicators have been discussed in previous blog posts:

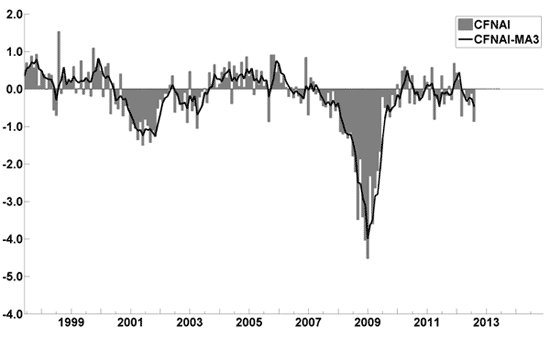
The September Chicago Fed National Activity Index (CFNAI)(pdf) updated as of September 24, 2012:

-


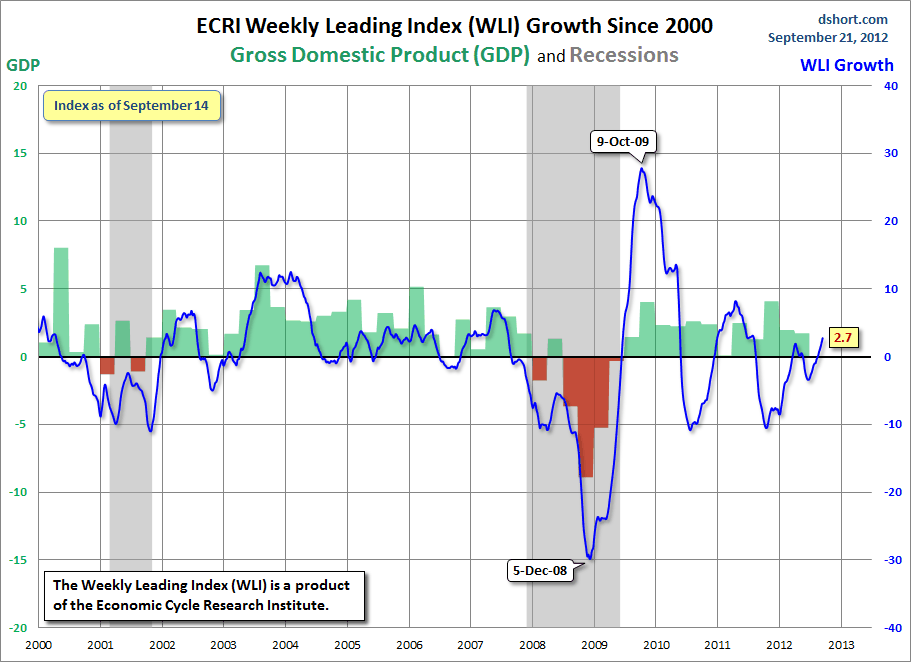
As of 9/21/12 (incorporating data through 9/14/12) the WLI was at 125.4 and the WLI, Gr. was at 2.7%.

A chart of the WLI, Gr. since 2000, from Doug Short’s blog of September 21 titled “ECRI Weekly Leading Index Growth at Highest Level Since July 2011” :


-


Here is the latest chart, depicting 9-15-10 to 9-15-12:


-


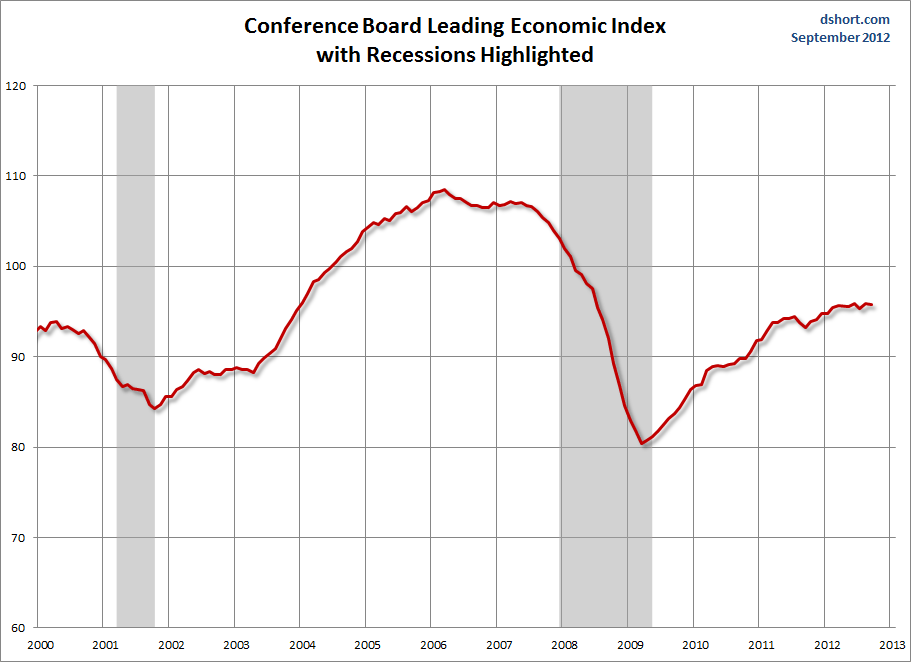
As per the September 20 release, the LEI was at 95.7 and the CEI was at 104.7 in August.

An excerpt from the September 20 release:
Says Ken Goldstein, economist at The Conference Board: “The economy continues to be buffeted by strong headwinds domestically and internationally. As a result, the pace of growth is unlikely to change much in the coming months. Weak domestic demand continues to be a major drag on the economy.”
Here is a chart of the LEI from Doug Short’s blog post of September 20 titled “Conference Board Leading Economic Index:  Fluctuating Around a Flat Trend” :


_________

I post various indicators and indices because I believe they should be carefully monitored.  However, as those familiar with this blog are aware, I do not necessarily agree with what they depict or imply.
_____

The Special Note summarizes my overall thoughts about our economic situation

SPX at 1455.10 as this post is written
Sunday, September 23, 2012

Zillow September 2012 Home Price Expectations Survey – Summary & Comments


On September 20, the Zillow September 2012 Home Price Expectations Survey (pdf) results were released.  This survey is done on a quarterly basis.

An image from the brief on the September 2012 Survey, displaying survey responses by quartile,  is seen below:

(click on chart image to enlarge)


Other charts are also seen in the brief.

As one can see from the above chart, the average expectation is that the residential real estate market, as depicted by the Case-Shiller US National Home Price Index (NSA), will continually climb after 2012.

The detail of the September 2012 Home Price Expectations Survey (pdf) is interesting.  Of the 113 survey respondents, 5 (of the displayed responses) forecast a cumulative price decrease through 2016; and of those 5, only 1 (Gary Shilling) foresees a double-digit percentage cumulative price drop, at 15.21%.

The Median Cumulative Home Price Appreciation for years 2012-2016 is seen as 2.0%, 4.86%, 8.21%, 11.57%, and 15.86%, respectively.

For a variety of reasons, I continue to believe that even the most “bearish” of these forecasts (as seen in Gary Shilling’s above-referenced forecast)  will prove too optimistic in hindsight.  Although a 15.21% cumulative decline is substantial, from a longer-term historical perspective such a decline is rather tame in light of the wild excesses that occurred over the “bubble” years.

I have written extensively about the residential real estate situation.  For a variety of reasons, it is exceedingly complex.  While many people continue to have an optimistic view regarding future residential real estate prices, in my opinion such a view is unsupported on an “all things considered” basis.  Furthermore, (even) from these price levels there exists outsized potential for a price decline of severe magnitude, unfortunately.  I discussed this downside, based upon historical price activity, in the October 24, 2010 post titled “What’s Ahead For The Housing Market – A Look At The Charts.”
_____

The Special Note summarizes my overall thoughts about our economic situation

SPX at 1460.15 as this post is written
Saturday, September 22, 2012

Total Household Net Worth As Of 2Q 2012 – Two Long-Term Charts


In the September 20 post ("Total Household Net Worth As A Percent Of GDP 2Q 2012") I displayed a long-term chart depicting Total Household Net Worth as a percentage of GDP.

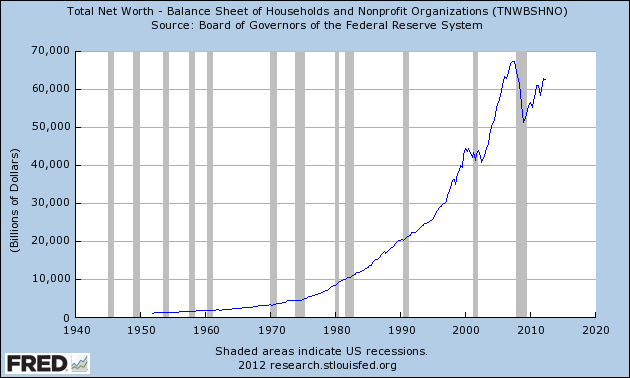
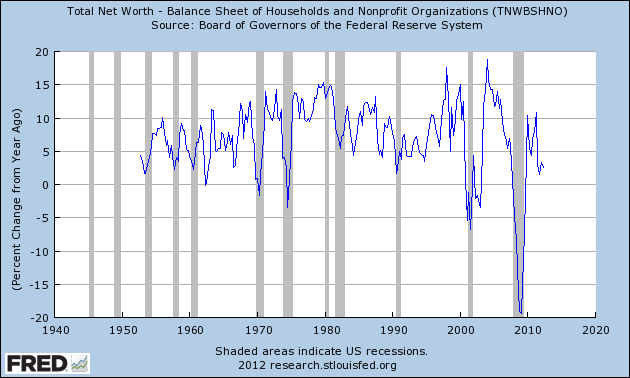
For reference purposes, here is Total Household Net Worth from a long-term perspective (from 1949:Q4 to 2012:Q2).  The last value (as of September 21, 2012) is $62.66839 Trillion:

(click on each chart to enlarge image)


-

Also of interest is the same metric presented on a "Percent Change from a Year Ago" basis:


_____

The Special Note summarizes my overall thoughts about our economic situation

SPX at 1460.15 as this post is written
Long-Term Charts Of The ECRI WLI & ECRI WLI, Gr. – September 21, 2012 Update


As I stated in my July 12, 2010 post ("ECRI WLI Growth History"):
For a variety of reasons, I am not as enamored with ECRI’s WLI and WLI Growth measures as many are.
However, I do think the measures are important and deserve close monitoring and scrutiny.
The movement of the ECRI WLI and WLI, Gr. is particularly notable at this time, as ECRI publicly announced on September 30, 2011 that the U.S. was “tipping into recession,” and ECRI has reaffirmed that view since, most recently in a September 13 release titled “The 2012 Recession:  Are We There Yet?” and September 13 Bloomberg video titled “Recession Update.”

Other past notable 2012 reaffirmations of the September 30, 2011 recession call by ECRI were seen (in chronological order)  on March 15 (“Why Our Recession Call Stands”) as well as various interviews and statements the week of May 6, including:
Also, subsequent to May 2012:

Below are three long-term charts, from Doug Short’s blog post of September 21 titled “ECRI Weekly Leading Index Growth at Highest Level Since July 2011.”  These charts are on a weekly basis through the September 21 release, indicating data through September 14, 2012.

Here is the ECRI WLI (defined at ECRI’s glossary):

(click on charts to enlarge images)


-

This next chart depicts, on a long-term basis, the Year-over-Year change in the 4-week moving average of the WLI:


-

This last chart depicts, on a long-term basis, the WLI, Gr.:


_________

I post various economic indicators and indices because I believe they should be carefully monitored.  However, as those familiar with this blog are aware, I do not necessarily agree with what they depict or imply.
_____

The Special Note summarizes my overall thoughts about our economic situation

SPX at 1460.15 as this post is written

Friday, September 21, 2012

St. Louis Financial Stress Index – September 20, 2012 Update


On March 28, 2011 I wrote a post ("The STLFSI") about the  STLFSI (St. Louis Fed’s Financial Stress Index) which is supposed to measure stress in the financial system.  For reference purposes, the most recent chart is seen below.  This chart was last updated on September 20, incorporating data from December 31,1993 to September 14, 2012 on a weekly basis.  The September 14, 2012 value is -.07 :

(click on chart to enlarge image)


_________

I post various indicators and indices because I believe they should be carefully monitored.  However, as those familiar with this blog are aware, I do not necessarily agree with what they depict or imply.
_____

The Special Note summarizes my overall thoughts about our economic situation

SPX at 1465.62 as this post is written

Building Financial Danger – September 21, 2012 Update


On October 17, 2011 I wrote a post titled “Danger Signs In The Stock Market, Financial System And Economy.”  This post is a brief 16th update to that post.

My overall analysis indicates a continuing elevated and growing level of danger which contains  many worldwide and U.S.-specific “stresses” of a very complex nature. I have written numerous posts in this blog of some of what I consider both ongoing and recent “negative developments.”  These developments, as well as other highly problematic conditions, have presented a highly perilous economic environment that endangers the overall financial system.

My analysis continues to indicate that there are many reasons for tremendous concern, as seen in almost innumerable fundamental economic, financial-market, and proprietary measures.

With regard to the U.S. economic situation, many prominent parties seem to be fixated on issues such as unemployment and the looming "fiscal cliff."  While the unemployment problem is complex and severe,  my analyses indicate that various other exceedingly problematical economic conditions also continue to exist and many lack recognition or effective remedy.

One aspect of tremendous concern is the existence of various immensely large asset bubbles, a subject of which I have extensively written.  While all of these asset bubbles are wildly pernicious and will have profound adverse future implications, hazards presented by the bond market bubble are especially notable.

Predicting the timing and extent of a stock market crash is always difficult, and the immense complexity of today’s economic situation makes such a prediction even more challenging. With that being said, my analyses indicate that the danger inherent in the financial system has reached a level at which a stock market crash – that would also involve (as seen in 2008) various other markets as well – continues to be at a level at which a near-term crash is of tremendous concern.

(note: the “next crash” has outsized significance and implications, as discussed in the post of January 6, "The Next Crash And Its Significance")

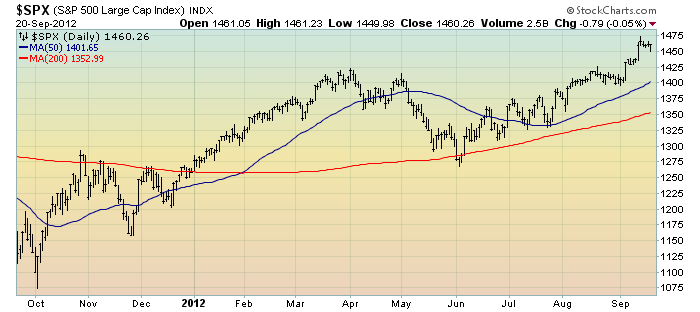
As reference, below is a one-year daily chart of the S&P500, indicating both the 50dma and 200dma as well as price labels.  The current price is 1460.26:

(click on chart to enlarge image)(chart courtesy of StockCharts.com; chart creation and annotation by the author)

_____

The Special Note summarizes my overall thoughts about our economic situation

SPX at 1460.26 as this post is written

Thursday, September 20, 2012

Total Household Net Worth As A Percent Of GDP 2Q 2012


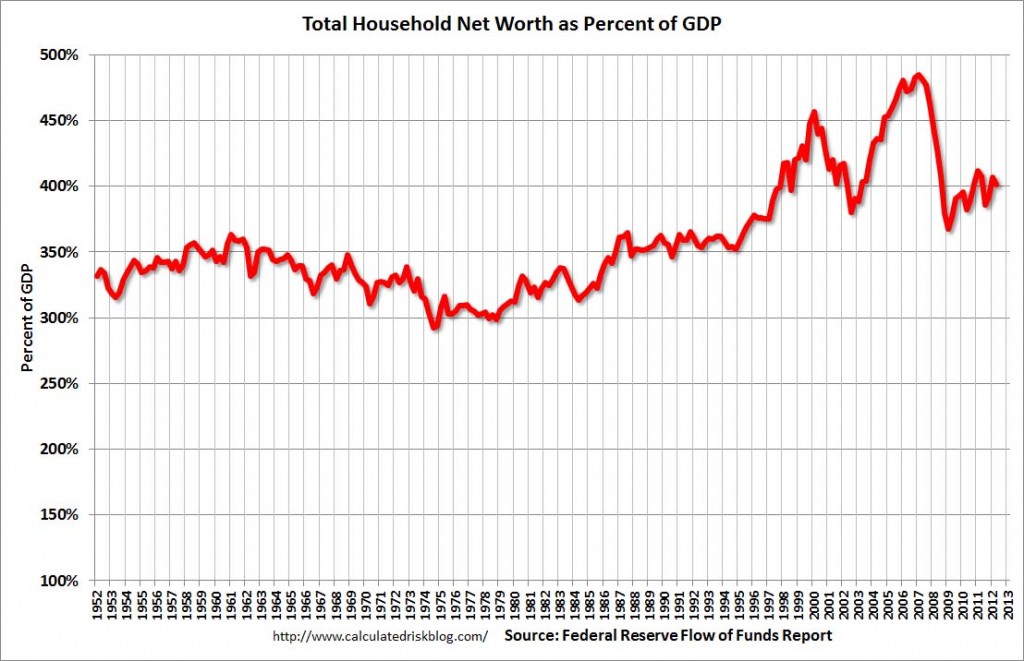
The following chart is from the CalculatedRisk blog post of September 20, 2012 titled “Fed’s Q2 Flow of Funds:  Household Mortgage Debt down $1 Trillion from Peak.” It depicts Total Household Net Worth as a Percent of GDP.  The underlying data is from The Federal Reserve Flow of Funds 2Q 2012 report:

(click on chart to enlarge image)


As seen in the above-referenced CalculatedRisk blog post:
According to the Fed, household net worth declined slightly in Q2 compared to Q1 2011. Net worth peaked at $67.4 trillion in Q3 2007, and then net worth fell to $51.2 trillion in Q1 2009 (a loss of $16.2 trillion). Household net worth was at $62.7 trillion in Q2 2012 (up $11.5 trillion from the trough, but still down $4.7 trillion from the peak).
The Fed estimated that the value of household real estate increased $353 billion to $16.9 trillion in Q2 2012. The value of household real estate is still $5.9 trillion below the peak.
My comments:

As I have written in previous posts on this Household Net Worth (as a percent of GDP) topic:
As one can see, the first outsized peak was in 2000, and attained after the stock market bull market / stock market bubbles and economic strength.  The second outsized peak was in 2007, right near the peak of the housing bubble as well as near the stock market peak.
As seen on the chart, the Total Household Net Worth is making an upturn, but is significantly below the prior 2007 peak.
I could extensively write about various interpretations that can be made from this chart.  One way this chart can be interpreted is a gauge of “what’s in it for me?” as far as the aggregated wealth citizens are gleaning from economic activity, as measured compared to GDP.
_____

The Special Note summarizes my overall thoughts about our economic situation

SPX at 1460.26 as this post is written