Saturday, March 30, 2013

Long-Term Charts Of The ECRI WLI & ECRI WLI, Gr. – March 29, 2013 Update


As I stated in my July 12, 2010 post ("ECRI WLI Growth History"):
For a variety of reasons, I am not as enamored with ECRI’s WLI and WLI Growth measures as many are.
However, I do think the measures are important and deserve close monitoring and scrutiny.
The movement of the ECRI WLI and WLI, Gr. is particularly notable at this time, as ECRI publicly announced on September 30, 2011 that the U.S. was “tipping into recession,” and ECRI has reiterated the view that the U.S. economy is currently in a recession, seen most recently in these two sources :
  • ECRI, March 5, Recession in the Yo-Yo Years (provides a link to a 17-page ECRI report dated March 2013 titled “The U.S. Business Cycle in the Context of the Yo-Yo Years”)
  • ECRI, March 8 Interview Summary (provides links to 3 video interviews)
Other past notable 2012 reaffirmations of the September 30, 2011 recession call by ECRI were seen (in chronological order)  on March 15 (“Why Our Recession Call Stands”) as well as various interviews and statements the week of May 6, including:
Also, subsequent to May 2012:
-

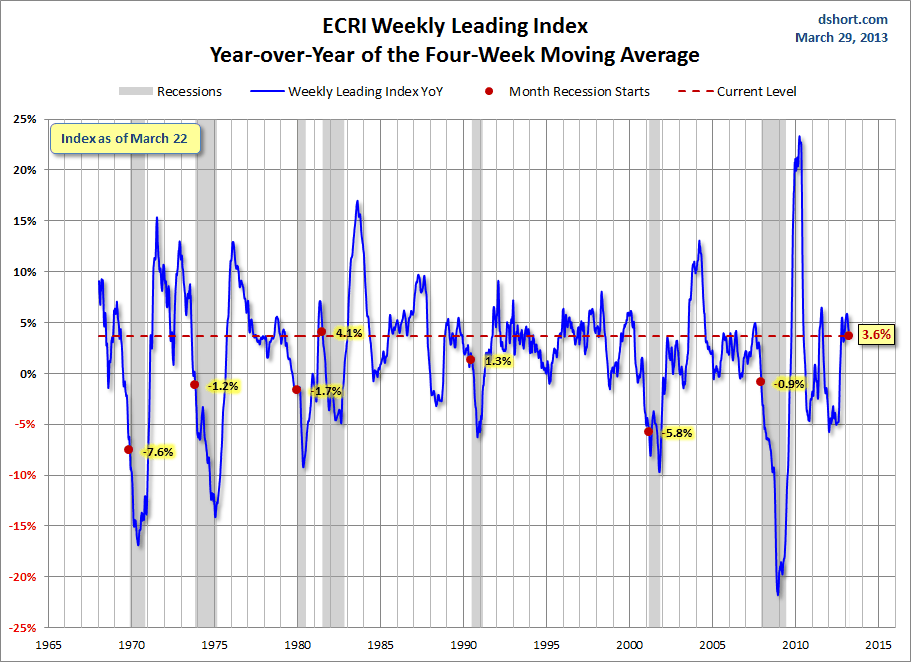
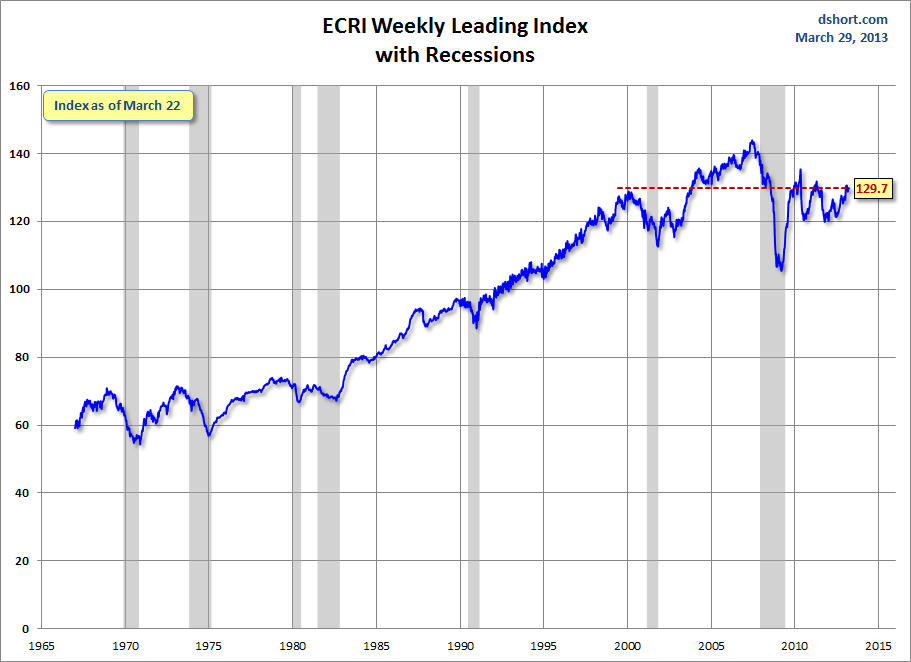
Below are three long-term charts, from Doug Short’s blog post of March 29 titled “ECRI's ‘Recession’ Indicator:  Unchanged from Last Week.”  These charts are on a weekly basis through the March 29 release, indicating data through March 22, 2013.

Here is the ECRI WLI (defined at ECRI’s glossary):

(click on charts to enlarge images)

Dshort 3-29-13 - ECRI-WLI

-

This next chart depicts, on a long-term basis, the Year-over-Year change in the 4-week moving average of the WLI:

Dshort 3-29-13 - ECRI-WLI-YoY

-

This last chart depicts, on a long-term basis, the WLI, Gr.:

Dshort 3-29-13 - ECRI-WLI-growth-since-1965

_________

I post various economic indicators and indices because I believe they should be carefully monitored.  However, as those familiar with this blog are aware, I do not necessarily agree with what they depict or imply.
_____

The Special Note summarizes my overall thoughts about our economic situation

SPX at 1569.13 as this post is written
St. Louis Financial Stress Index – March 28, 2013 Update


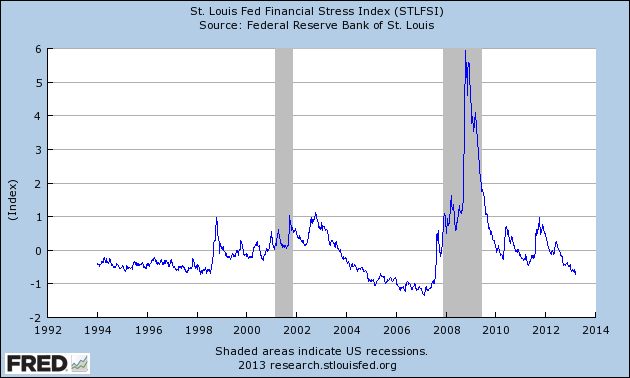
On March 28, 2011 I wrote a post ("The STLFSI") about the  St. Louis Fed’s Financial Stress Index (STLFSI) which is supposed to measure stress in the financial system.  For reference purposes, the most recent chart is seen below.  This chart was last updated on March 28, incorporating data from December 31,1993 to March 22, 2013 on a weekly basis.  The March 22, 2013 value is -.634 :

(click on chart to enlarge image)

STLFSI_3-28-13 -.634

-

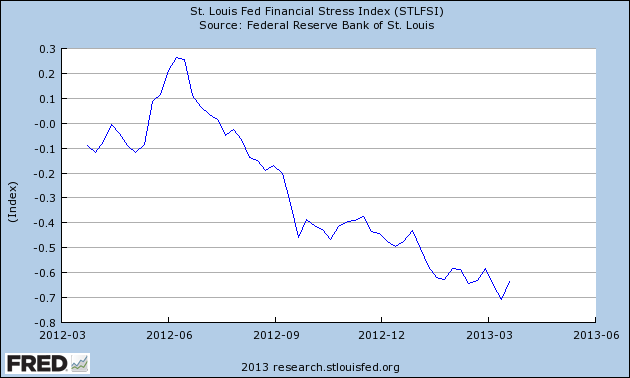
Here is the STLFSI chart from a 1-year perspective:

STLFSI_3-28-13 1-year

_________

I post various indicators and indices because I believe they should be carefully monitored.  However, as those familiar with this blog are aware, I do not necessarily agree with what they depict or imply.
_____

The Special Note summarizes my overall thoughts about our economic situation

SPX at 1569.19 as this post is written
Thursday, March 28, 2013

Corporate Profits As A Percentage Of GDP


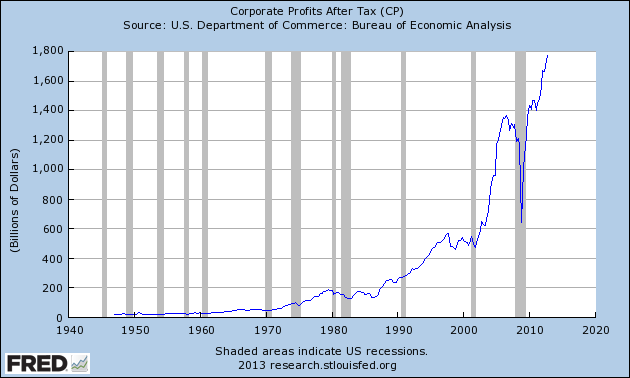
In the last post ("4th Quarter Corporate Profits") I displayed, for reference purposes, a long-term chart depicting Corporate Profits After Tax.

There are many ways to view this measure, both on an absolute as well as relative basis.

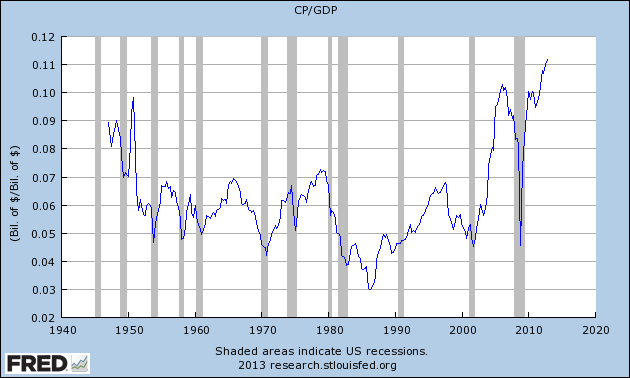
One relative measure is viewing Corporate Profits as a Percentage of GDP.  I feel that this metric is important for a variety of reasons.  As well, the measure is important to a variety of parties, including investors, businesses, and government policy makers.

As one can see from the  long-term chart below (updated through the fourth quarter), (After Tax) Corporate Profits as a Percentage of GDP is at levels that can be seen as historically (very) high.  While there are many reasons as to why this is so, from a going-forward standpoint I think it is important to recognize both that such a notable condition exists, as well as contemplate and/or plan for such factors and conditions that would come about if (and in my opinion “when”) a more historically “normal” ratio of Corporate Profits as a Percentage of GDP occurs.  This topic can be very complex in nature, and depends upon myriad factors.  In my opinion it deserves far greater recognition.

(click on chart to enlarge image)

CP-GDP 3-28-13

_____

The Special Note summarizes my overall thoughts about our economic situation

SPX at 1570.28 as this post is written
4th Quarter Corporate Profits


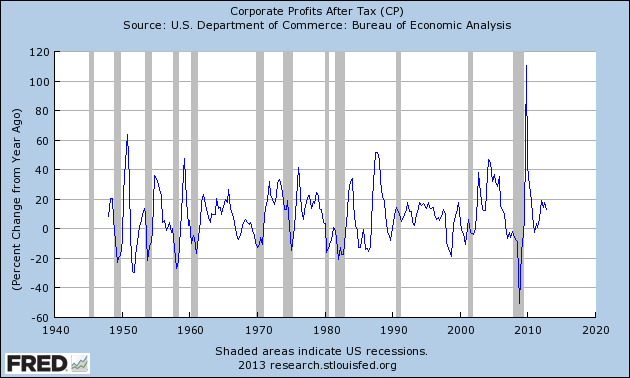
Today's GDP release (Q4, 3rd Estimate) was accompanied by the BLS Corporate Profits report for the 4th quarter and full year.

Of course, there are many ways to adjust and depict overall Corporate Profits.  For reference purposes, here is a chart from the St. Louis Federal Reserve (FRED) showing the Corporate Profits After Tax (last updated 3/28/13, with a value of $1773.7 Billion) :

CP_3-28-13 1773.7 billion

-

Here is the Corporate Profits After Tax measure shown on a Percentage Change from a Year Ago perspective:

CP 3-28-13 Percent Change from Year Ago

_____

The Special Note summarizes my overall thoughts about our economic situation

SPX at 1568.94 as this post is written
Deloitte “CFO Signals” Report 1Q 2013 – Notable Aspects


Recently Deloitte released their “CFO Signals” “High-Level Summary” report for the 1st Quarter of 2013.

As seen in page 2 of the report, “One hundred and six CFOs responded this quarter. More than 70% of the CFOs are from public companies, and 85% are from companies with more than $1B in annual revenue.”

Here are some of the excerpts that I found notable:

from page 3 :

What are companies’ business focus areas for the next year? Most companies are focused more on pursuing opportunity than on limiting risk, and much more on growing and scaling than on contracting and rationalizing.

from page 4:

In step with optimism, sales and earnings growth expectations have improved, but are still not strong by historical standards. Sales expectations are essentially unchanged at 5.4%*, above the survey-low 4.8%* in 3Q12, but also well below the 7% long-term average. Similarly, expected earnings growth rose from 10.9%* to 12.1%*, but this is still comparatively low.

from page 16:

Domestic hiring is expected to rise 0.9% overall, consistent with last quarter’s 1.0% and above the 3Q12 survey low of 0.6%; the median is again 0%, with 43% of CFOs expecting year-over-year gains, and 27% expecting cuts (essentially even with the survey high from last quarter).

from page 17:

About 50% of CFOs expressed rising optimism, and just under 20% expressed rising pessimism — a major turn of events from last quarter.

also:

Optimism in the U.S. rebounded strongly — with net optimism rising from -16 two quarters ago and -21 last quarter to +33 this quarter.

from page 18:

Economic concerns have largely transitioned from worries about crises/collapse to worries about persistent stagnation.
_____

I post various business and economic surveys because I believe they should be carefully monitored.  However, as those familiar with this blog are aware, I do not necessarily agree with many of the consensus estimates and much of the commentary in these surveys.
_____

The Special Note summarizes my overall thoughts about our economic situation

SPX at 1562.85 as this post is written
Wednesday, March 27, 2013

Markets During Periods Of Federal Reserve Intervention – March 26, 2013 Update


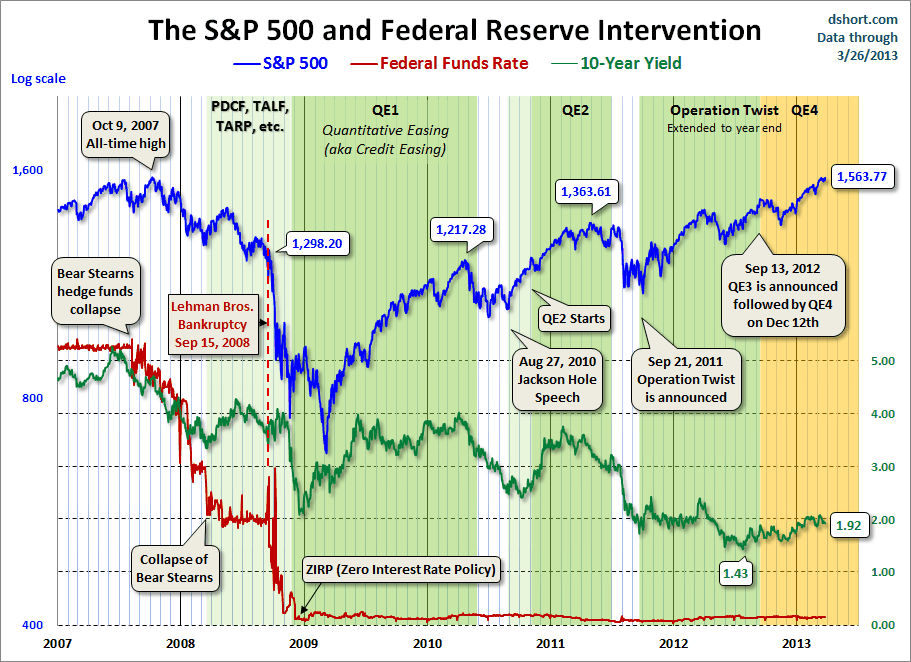
In the August 9, 2011 post ("QE3 – Various Thoughts") I posted a chart that depicted the movements of the S&P500, 10-Year Treasury Yield and the Fed Funds rate spanning the periods of various Federal Reserve interventions since 2007.

For reference purposes, here is an updated chart from Doug Short’s blog post of March 26 ("Treasury Yield Snapshot…") :

(click on chart to enlarge image)

Dshort 3-26-13 - SPX-10-yr-yield-and-fed-intervention

_____

The Special Note summarizes my overall thoughts about our economic situation

SPX at 1556.48 as this post is written
Consumer Confidence Surveys – As Of March 26, 2013


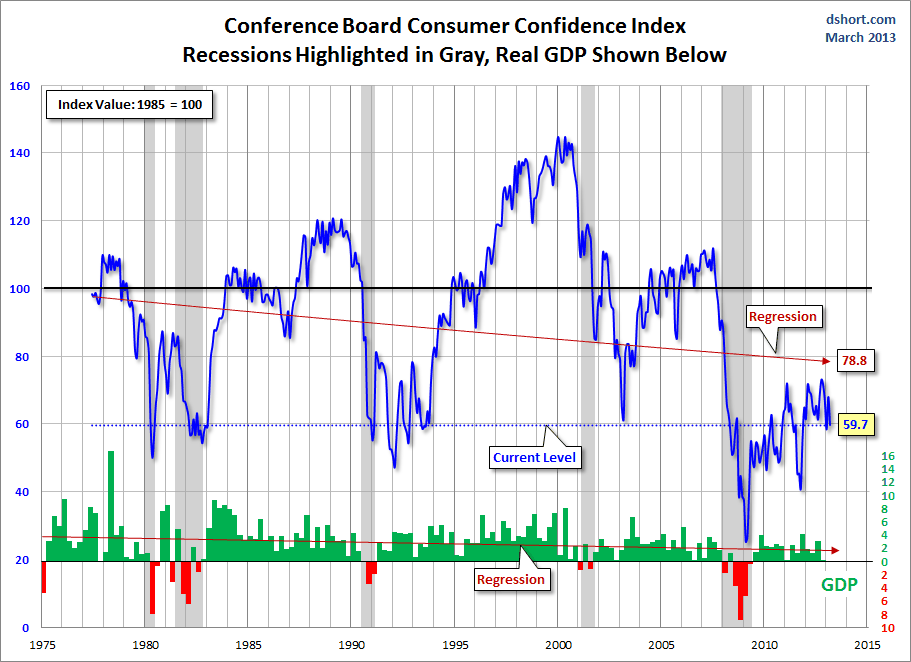
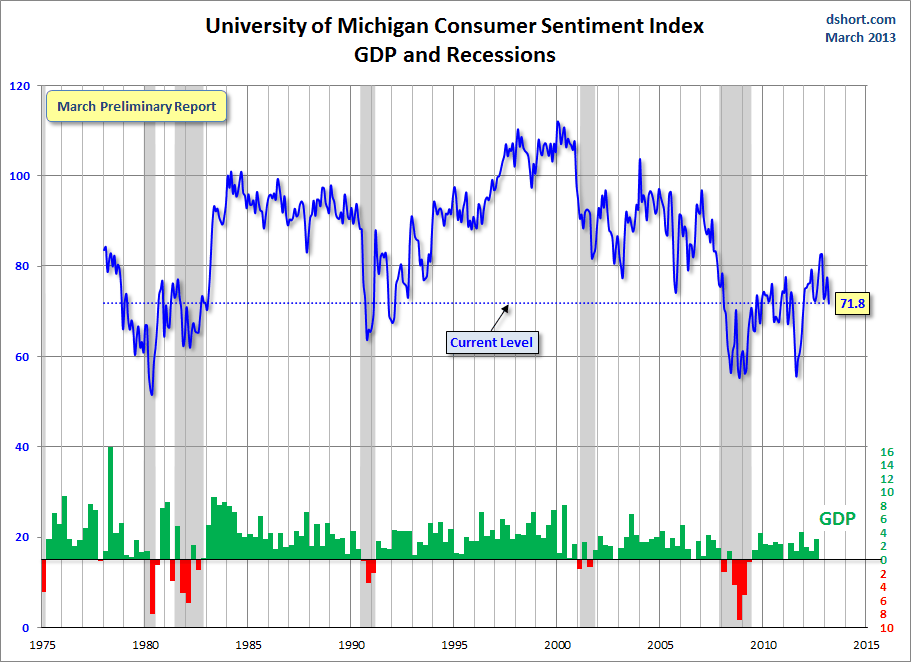
Doug Short had a blog post of March 26 ("Consumer Confidence Takes a Dive") in which he presents the latest Conference Board Consumer Confidence and Thomson/Reuters University of Michigan Consumer Sentiment Index charts.  They are presented below:

(click on charts to enlarge images)

Dshort 3-26-13 - Conference-Board-consumer-confidence-index

-

Dshort 3-26-13 - Michigan-consumer-sentiment-index

-

There are a few aspects of the above charts that I find highly noteworthy.  Of course, the continuing subdued absolute levels of these two surveys is disconcerting.

Also, I find the “behavior” of these readings to be quite disparate as compared to the other post-recession periods, as shown in the charts between the gray shaded areas (the gray areas denote recessions as defined by the NBER.)

While I don’t believe that confidence surveys should be overemphasized, I find these readings to be very problematical, especially in light of a variety of other highly disconcerting measures highlighted throughout this blog.
_____

The Special Note summarizes my overall thoughts about our economic situation

SPX at 1553.78 as this post is written
Durable Goods New Orders – Long-Term Charts Through February 2013


Many people place emphasis on Durable Goods New Orders as a prominent economic indicator and/or leading economic indicator.

For reference, below are charts depicting this measure.

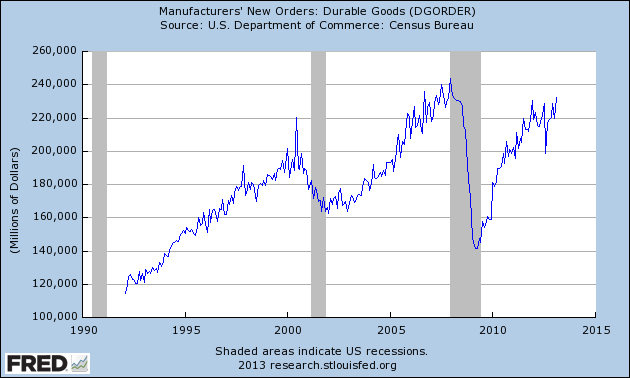
First, from the St. Louis Fed site (FRED), a chart through February, last updated on March 26.  This value is 232,108 ($ Millions) :

(click on charts to enlarge images)

DGORDER_3-26-13 232108

-

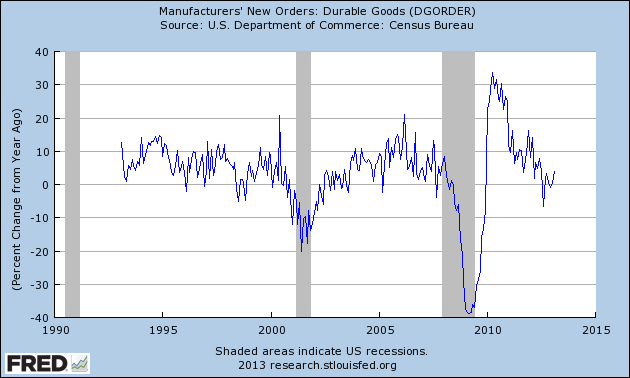
Here is the chart depicting this measure on a “Percentage Change from a Year Ago” basis:

DGORDER_3-26-13 Percent Change from Year Ago

_________

I post various indicators and indices because I believe they should be carefully monitored.  However, as those familiar with this blog are aware, I do not necessarily agree with what they depict or imply.
_____

The Special Note summarizes my overall thoughts about our economic situation

SPX at 1563.77 as this post is written

Tuesday, March 26, 2013

Trends Of S&P500 Earnings Forecasts


S&P500 earnings trends and estimates is a notably important topic, for a variety of reasons, at this point in time.

FactSet publishes a report titled “Earnings Insight” that contains a variety of information including the trends and expectations of S&P500 earnings.

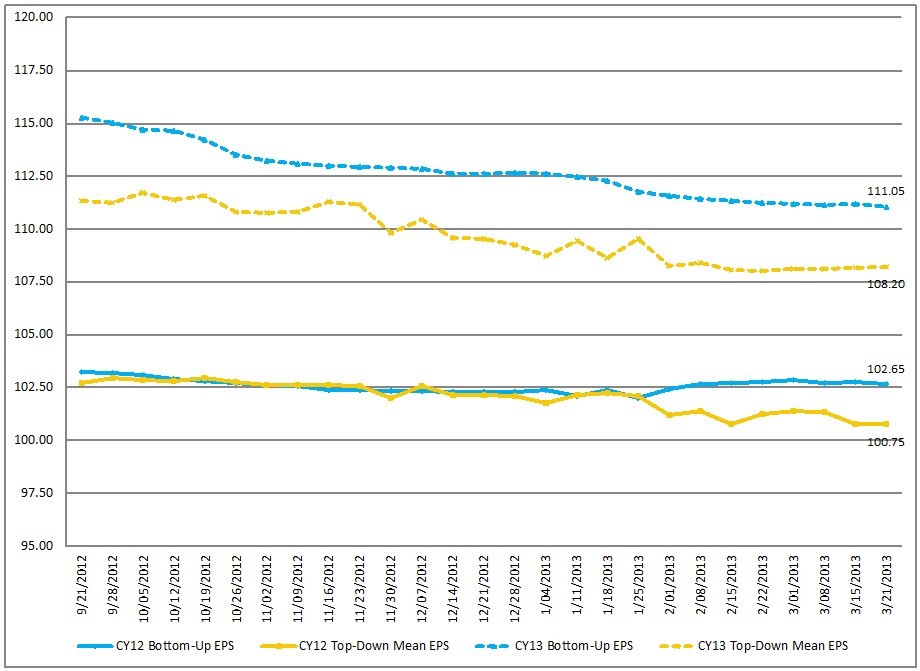
For reference purposes, here are two charts as seen in the “Earnings Insight” report of March 22, 2013:

from page 17:

(click on charts to enlarge images)

CY Bottom-Up EPS vs. Top-Down Mean EPS (Trailing 26-Weeks) 

FactSet Earnings Insight 3-22-13

-

from page 18:

Calendar Year Bottom-Up EPS Actuals & Estimates

FactSet Earnings Insight 3-22-13 Quarterly Estimates

_____

I post various economic forecasts because I believe they should be carefully monitored.  However, as those familiar with this blog are aware, I do not agree with many of the consensus estimates and much of the commentary in these forecast surveys.
_____

The Special Note summarizes my overall thoughts about our economic situation

SPX at 1563.77 as this post is written
S&P500 Earnings Estimates For 2013 & 2014


As many are aware, Thomson Reuters publishes earnings estimates for the S&P500.  (My other posts concerning S&P earnings estimates can be found under the S&P500 Earnings label)

The following estimates are from Exhibit 12 of “The Director’s Report” of March 26, 2013, and represent an aggregation of individual S&P500 component “bottom up” analyst forecasts:

Year 2013 estimate:
$112.23/share

Year 2014 estimate:
$125.31/share
_____

I post various economic forecasts because I believe they should be carefully monitored.  However, as those familiar with this blog are aware, I do not agree with many of the consensus estimates and much of the commentary in these forecast surveys.
_____

The Special Note summarizes my overall thoughts about our economic situation

SPX at 1563.74 as this post is written

Standard & Poor’s S&P500 Earnings Estimates For 2013 & 2014 – As Of March 21, 2013


As many are aware, Standard & Poor’s publishes earnings estimates for the S&P500.  (My posts concerning their estimates can be found under the S&P500 Earnings tag)

For reference purposes, the most current estimates are reflected below, and are as of March 21, 2013:

Year 2013 estimates add to the following:
-From a “bottom up” perspective, operating earnings of $111.16/share
-From a “top down” perspective, operating earnings of $111.98/share
-From a “top down” perspective, “as reported” earnings of $108.68/share

Year 2014 estimates add to the following:
-From a “bottom up” perspective, operating earnings of $124.77/share
-From a “top down” perspective, operating earnings of $120.19/share
-From a “top down” perspective, “as reported” earnings of $118.10/share
_____

I post various economic forecasts because I believe they should be carefully monitored.  However, as those familiar with this blog are aware, I do not agree with many of the consensus estimates and much of the commentary in these forecast surveys.
_____

The Special Note summarizes my overall thoughts about our economic situation

SPX at 1559.65 as this post is written

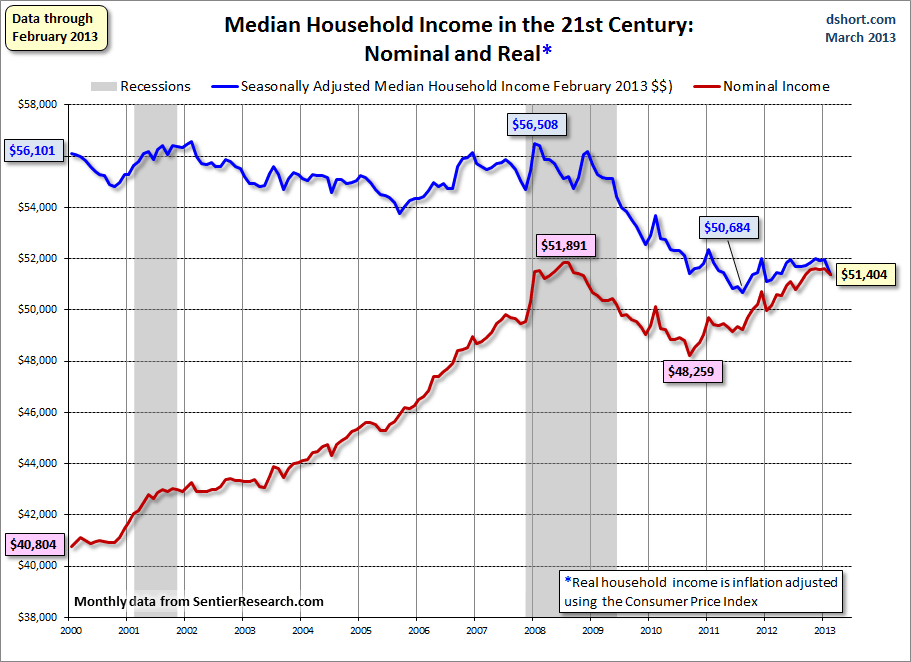
Median Household Income Chart


I have written many blog posts concerning the worrisome trends in income and earnings.

Doug Short, in his March 25 blog post, titled “Real Median Household Incomes:  Down $590 in February” produced the chart below.  It is based upon data from Sentier Research, and it shows both nominal and real median household incomes since 2000, as depicted.  As one can see, post-recession real median household income (seen in the blue line since 2009) is especially worrisome.

(click on chart to enlarge image)

Dshort 3-25-13 household-income-monthly-median-since-2000

-

As Doug mentions in his aforementioned blog post:
The Sentier Research monthly median household income data series is now available for February. Nominal median household incomes decline 0.5% month-over-month, but are up 2.4% year-over-year. Adjusted for inflation, real incomes fell 1.1% MoM and are essentially flat YoY at 0.4%.
Also seen in his blog post is a chart depicting each of the two (nominal and real household incomes) data series' percent change over time since 2000.
_____

The Special Note summarizes my overall thoughts about our economic situation

SPX at 1551.69 as this post is written

Monday, March 25, 2013

Updates Of Economic Indicators March 2013


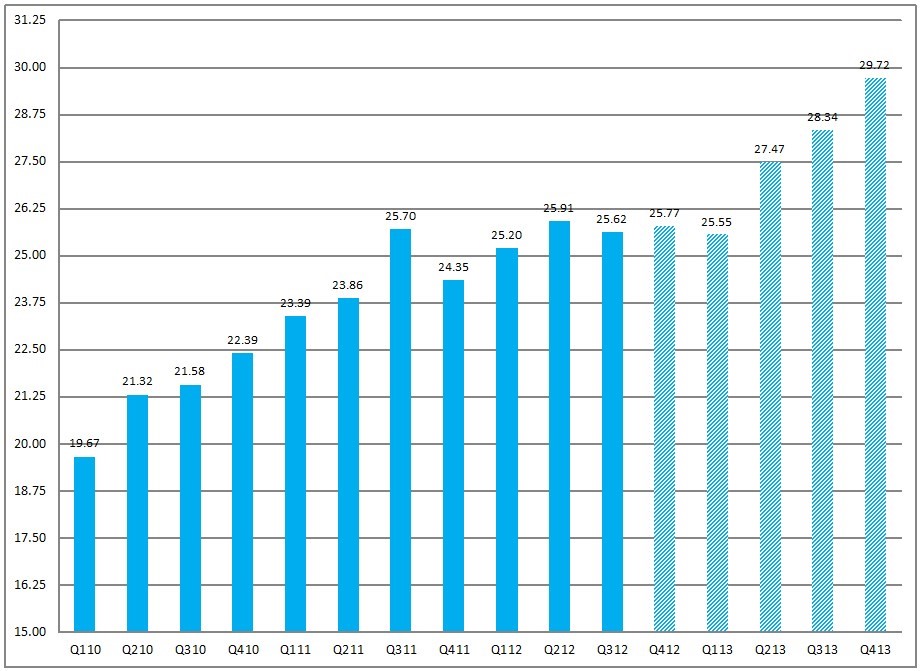
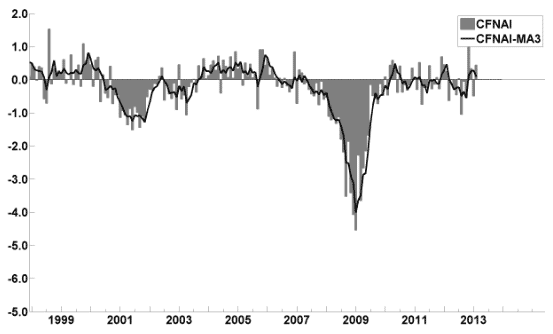
Here is an update on various indicators that are supposed to predict and/or depict economic activity.  These indicators have been discussed in previous blog posts:

The March Chicago Fed National Activity Index (CFNAI)(pdf) updated as of March 25, 2013:

cfnai_monthly_MA3 3-25-13

-


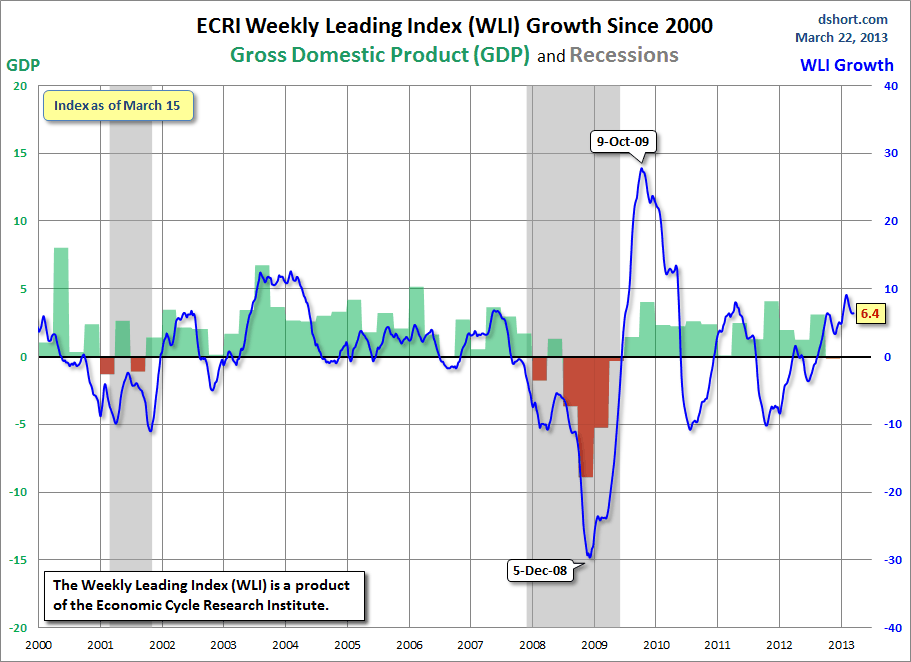
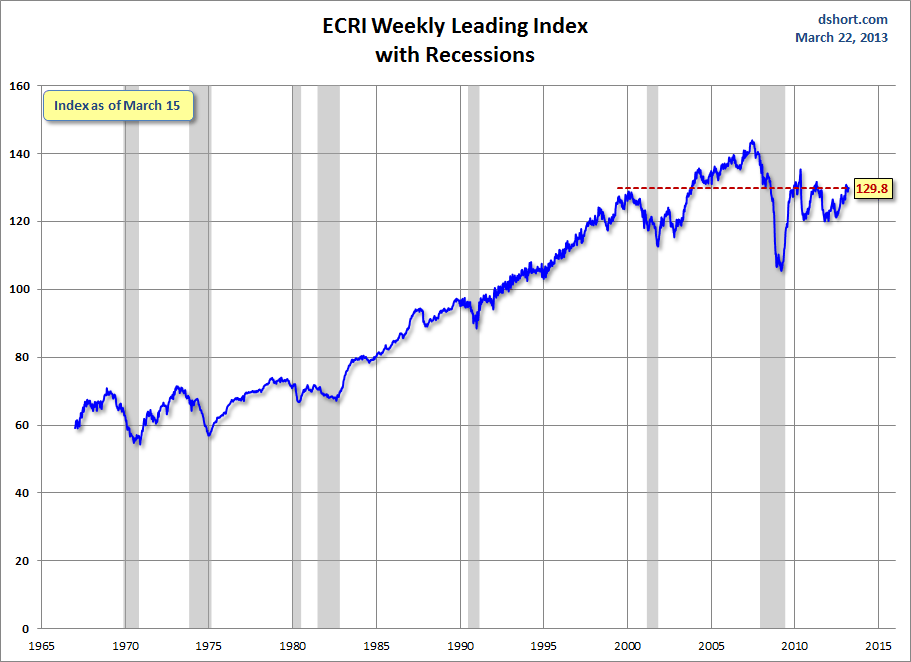
As of 3/22/13 (incorporating data through 3/15/13) the WLI was at 129.8 and the WLI, Gr. was at 6.4%.

A chart of the WLI, Gr. since 2000, from Doug Short’s blog of March 22 titled “ECRI's ‘Recession’ Indicators:  Unchanged from Last Week” :

Dshort 3-22-13 ECRI-WLI-growth-since-2000

-


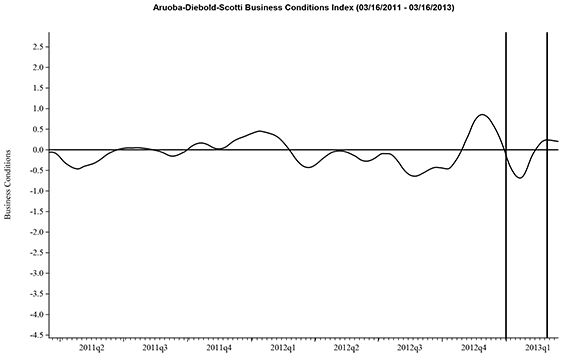
Here is the latest chart, depicting 3-16-11 to 3-16-13:

ads_2yrs_3-16-11 - 3-16-13

-


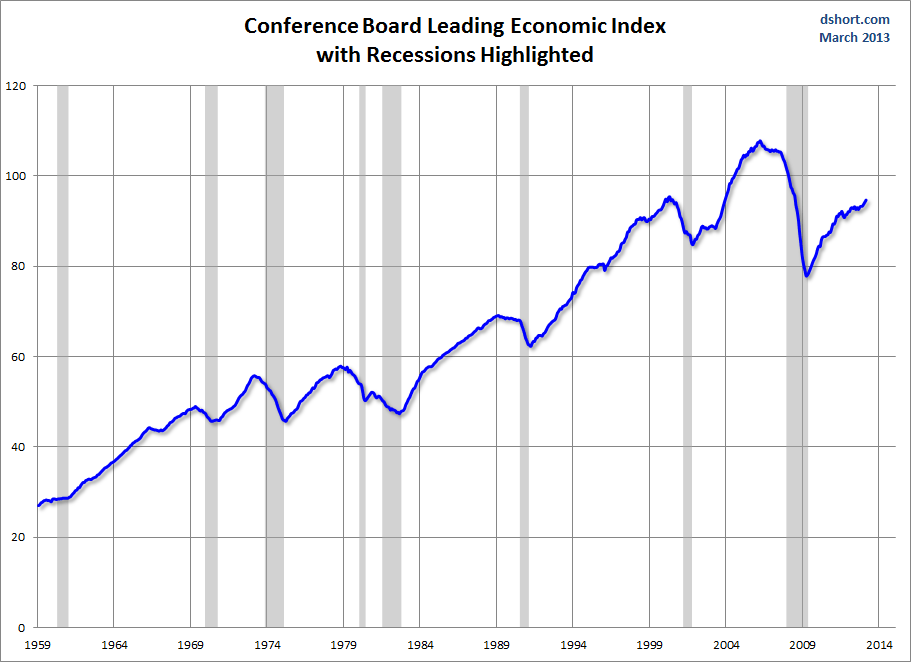
As per the March 21 press release, the LEI was at 94.8 and the CEI was at 105.1 in February.

An excerpt from the March 21 release:
Says Ken Goldstein, economist at The Conference Board: “The U.S. economy is growing slowly now, and with this reading increases hope that it may pick up some momentum in the second half of the year. However, this latest report does not yet capture the recent effects of sequestration, which could dampen the pickup in GDP.”
Here is a chart of the LEI from Doug Short’s blog post of March 21 titled “Conference Board Leading Economic Index:  ’Economy Continues to Expand Slowly'" :

Dshort 3-21-13 CB-LEI

_________

I post various indicators and indices because I believe they should be carefully monitored.  However, as those familiar with this blog are aware, I do not necessarily agree with what they depict or imply.
_____

The Special Note summarizes my overall thoughts about our economic situation

SPX at 1564.22 as this post is written

Friday, March 22, 2013

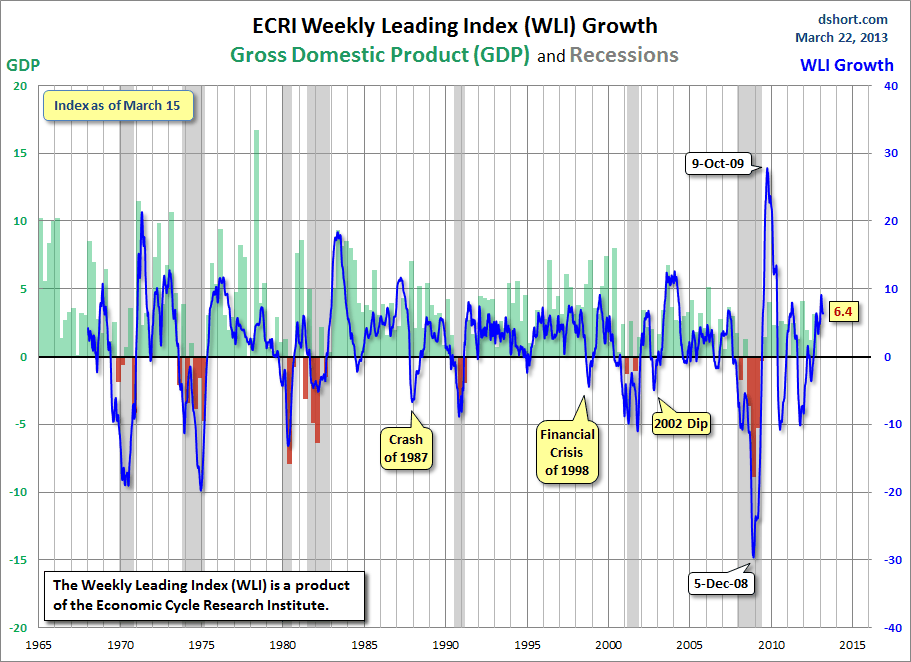
Long-Term Charts Of The ECRI WLI & ECRI WLI, Gr. – March 22, 2013 Update


As I stated in my July 12, 2010 post ("ECRI WLI Growth History"):
For a variety of reasons, I am not as enamored with ECRI’s WLI and WLI Growth measures as many are.
However, I do think the measures are important and deserve close monitoring and scrutiny.
The movement of the ECRI WLI and WLI, Gr. is particularly notable at this time, as ECRI publicly announced on September 30, 2011 that the U.S. was “tipping into recession,” and ECRI has reiterated the view that the U.S. economy is currently in a recession, seen most recently in these two sources :
  • ECRI, March 5, Recession in the Yo-Yo Years (provides a link to a 17-page ECRI report dated March 2013 titled “The U.S. Business Cycle in the Context of the Yo-Yo Years”)
  • ECRI, March 8 Interview Summary (provides links to 3 video interviews)
Other past notable 2012 reaffirmations of the September 30, 2011 recession call by ECRI were seen (in chronological order)  on March 15 (“Why Our Recession Call Stands”) as well as various interviews and statements the week of May 6, including:
Also, subsequent to May 2012:
-

Below are three long-term charts, from Doug Short’s blog post of March 22 titled “ECRI 'Recession' Indicators:  Unchanged from Last Week.”  These charts are on a weekly basis through the March 22 release, indicating data through March 15, 2013.

Here is the ECRI WLI (defined at ECRI’s glossary):

(click on charts to enlarge images)

Dshort 3-22-13  ECRI-WLI

-

This next chart depicts, on a long-term basis, the Year-over-Year change in the 4-week moving average of the WLI:

Dshort 3-22-13 ECRI-WLI-YoY

-

This last chart depicts, on a long-term basis, the WLI, Gr.:

Dshort 3-22-13 ECRI-WLI-growth-since-1965

_________

I post various economic indicators and indices because I believe they should be carefully monitored.  However, as those familiar with this blog are aware, I do not necessarily agree with what they depict or imply.
_____

The Special Note summarizes my overall thoughts about our economic situation

SPX at 1556.03 as this post is written