Here is an update on various indicators that are supposed to predict and/or depict economic activity. These indicators have been discussed in previous blog posts:
The March Chicago Fed National Activity Index (CFNAI)(pdf) updated as of March 25, 2013:
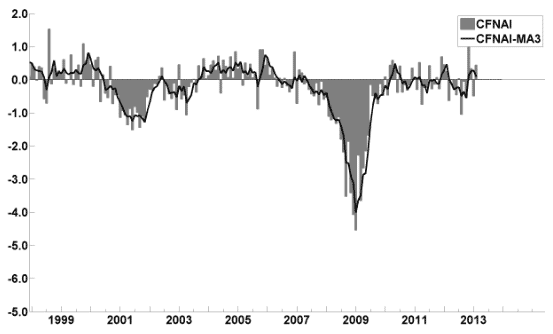
-
As of 3/22/13 (incorporating data through 3/15/13) the WLI was at 129.8 and the WLI, Gr. was at 6.4%.
A chart of the WLI, Gr. since 2000, from Doug Short’s blog of March 22 titled “ECRI's ‘Recession’ Indicators: Unchanged from Last Week” :
-
Here is the latest chart, depicting 3-16-11 to 3-16-13:
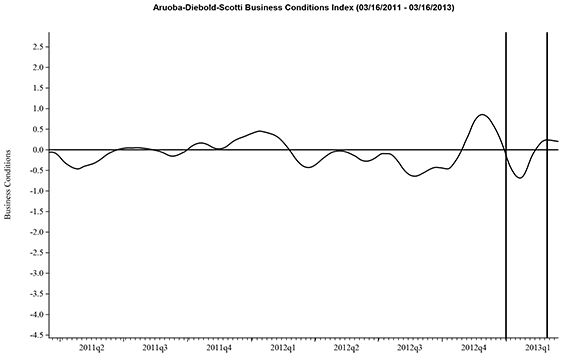
-
As per the March 21 press release, the LEI was at 94.8 and the CEI was at 105.1 in February.
An excerpt from the March 21 release:
Says Ken Goldstein, economist at The Conference Board: “The U.S. economy is growing slowly now, and with this reading increases hope that it may pick up some momentum in the second half of the year. However, this latest report does not yet capture the recent effects of sequestration, which could dampen the pickup in GDP.”
Here is a chart of the LEI from Doug Short’s blog post of March 21 titled “Conference Board Leading Economic Index: ’Economy Continues to Expand Slowly'" :
_________
I post various indicators and indices because I believe they should be carefully monitored. However, as those familiar with this blog are aware, I do not necessarily agree with what they depict or imply.
_____
The Special Note summarizes my overall thoughts about our economic situation
SPX at 1564.22 as this post is written
No comments:
Post a Comment