Wednesday, July 31, 2013

House Prices Reference Chart

As a reference for long-term house price index trends, below is a chart, updated with the most current data (through May, except for the Case-Shiller National Index, which is through March), from the CalculatedRisk blog post of July 30 titled “Comment on House Prices: Real Prices, Price-to-Rent Ratio, Cities” :

(click on chart to enlarge image)

CR 7-30-13 - NominalHPIMay2013

_____

The Special Note summarizes my overall thoughts about our economic situation

SPX at 1691.15 as this post is written

Tuesday, July 30, 2013

Median Household Income Chart

I have written many blog posts concerning the worrisome trends in income and earnings.

Doug Short, in his July 29 blog post, titled “Real Median Household Incomes:  Up .7% in June But Only .1% Year-over-Year” produced the chart below.  It is based upon data from Sentier Research, and it shows both nominal and real median household incomes since 2000, as depicted.  As one can see, post-recession real median household income (seen in the blue line since 2009) is especially worrisome.

(click on chart to enlarge image)

Dshort 7-29-13 household-income-monthly-median-since-2000

-

As Doug mentions in his aforementioned blog post:
As the excellent data from Sentier Research makes clear, the mainstream U.S. household was struggling before the Great Recession. At this point, real household incomes are in worse shape than they were four years ago when the recession ended.
Among other items seen in his blog post is a chart depicting each of the two (nominal and real household incomes) data series’ percent change over time since 2000.
_____

The Special Note summarizes my overall thoughts about our economic situation

SPX at 1685.33 as this post is written

Monday, July 29, 2013

Consumer Confidence Surveys – As Of July 29, 2013

Doug Short had a blog post of July 26 (“Michigan Consumer Sentiment:  Highest Level in Six Years") in which he presents the latest Conference Board Consumer Confidence and Thomson/Reuters University of Michigan Consumer Sentiment Index charts.  They are presented below:

(click on charts to enlarge images)

Dshort 7-26-13 - Conference-Board-consumer-confidence-index

-

Dshort 7-26-13 Michigan-consumer-sentiment-index

-

There are a few aspects of the above charts that I find highly noteworthy.  Of course, the continuing subdued absolute levels of these two surveys is disconcerting.

Also, I find the “behavior” of these readings to be quite disparate as compared to the other post-recession periods, as shown in the charts between the gray shaded areas (the gray areas denote recessions as defined by the NBER.)

While I don’t believe that confidence surveys should be overemphasized, I find these readings to be very problematical, especially in light of a variety of other highly disconcerting measures highlighted throughout this blog.
_____

The Special Note summarizes my overall thoughts about our economic situation

SPX at 1691.65 as this post is written

Friday, July 26, 2013

Long-Term Charts Of The ECRI WLI & ECRI WLI, Gr. – July 26, 2013 Update

As I stated in my July 12, 2010 post ("ECRI WLI Growth History"):
For a variety of reasons, I am not as enamored with ECRI’s WLI and WLI Growth measures as many are.
However, I do think the measures are important and deserve close monitoring and scrutiny.
The movement of the ECRI WLI and WLI, Gr. is particularly notable at this time, as ECRI publicly announced on September 30, 2011 that the U.S. was “tipping into recession,” and ECRI has reiterated the view that the U.S. economy is currently in a recession, seen most recently in these five sources :
Other past notable 2012 reaffirmations of the September 30, 2011 recession call by ECRI were seen (in chronological order)  on March 15 (“Why Our Recession Call Stands”) as well as various interviews and statements the week of May 6, including:
Also, subsequent to May 2012:
-

Below are three long-term charts, from Doug Short’s blog post of July 26 titled “ECRI Recession Watch:  Weekly Update”  These charts are on a weekly basis through the July 26 release, indicating data through July 19, 2013.

Here is the ECRI WLI (defined at ECRI’s glossary):

(click on charts to enlarge images)

Dshort 7-26-13 ECRI-WLI 131.3

-

This next chart depicts, on a long-term basis, the Year-over-Year change in the 4-week moving average of the WLI:

Dshort 7-26-13 ECRI-WLI-YoY 6.9 percent

-

This last chart depicts, on a long-term basis, the WLI, Gr.:

Dshort 7-26-13 ECRI-WLI-growth-since-1965 4.5

_________

I post various economic indicators and indices because I believe they should be carefully monitored.  However, as those familiar with this blog are aware, I do not necessarily agree with what they depict or imply.
_____

The Special Note summarizes my overall thoughts about our economic situation

SPX at 1687.72 as this post is written

St. Louis Financial Stress Index – July 25, 2013 Update

On March 28, 2011 I wrote a post ("The STLFSI") about the  St. Louis Fed’s Financial Stress Index (STLFSI) which is supposed to measure stress in the financial system.  For reference purposes, the most recent chart is seen below.  This chart was last updated on July 25, incorporating data from December 31,1993 to July 19, 2013, on a weekly basis.  The July 19, 2013 value is -.523:

(click on chart to enlarge image)

STLFSI_7-25-13 -.523

-

Here is the STLFSI chart from a 1-year perspective:

STLFSI_7-25-13 -.523 1-year
Data Source: FRED, Federal Reserve Economic Data, Federal Reserve Bank of St. Louis; accessed July 26, 2013:

_________

I post various indicators and indices because I believe they should be carefully monitored.  However, as those familiar with this blog are aware, I do not necessarily agree with what they depict or imply.
_____

The Special Note summarizes my overall thoughts about our economic situation

SPX at 1690.25 as this post is written

Durable Goods New Orders – Long-Term Charts Through June 2013

Many people place emphasis on Durable Goods New Orders as a prominent economic indicator and/or leading economic indicator.

For reference, below are charts depicting this measure.

First, from the St. Louis Fed site (FRED), a chart through June, last updated on July 25.  This value is 244,494 ($ Millions) :

(click on charts to enlarge images)

DGORDER_7-25-13 244494

-

Here is the chart depicting this measure on a “Percentage Change from a Year Ago” basis:

DGORDER_7-25-13 244494 Percent Change From Year Ago

Data Source: FRED, Federal Reserve Economic Data, Federal Reserve Bank of St. Louis: Manufacturers’ New Orders:  Durable Goods [DGORDER] ; U.S. Department of Commerce: Census Bureau ; accessed July 26, 2013;
_________

I post various indicators and indices because I believe they should be carefully monitored.  However, as those familiar with this blog are aware, I do not necessarily agree with what they depict or imply.
_____

The Special Note summarizes my overall thoughts about our economic situation

SPX at 1690.25 as this post is written

Thursday, July 25, 2013

Headwinds Facing Future Corporate Earnings

Corporate earnings and earnings growth is a particularly notable subject at this time. As I wrote in the blog post of June 11, 2013 ("
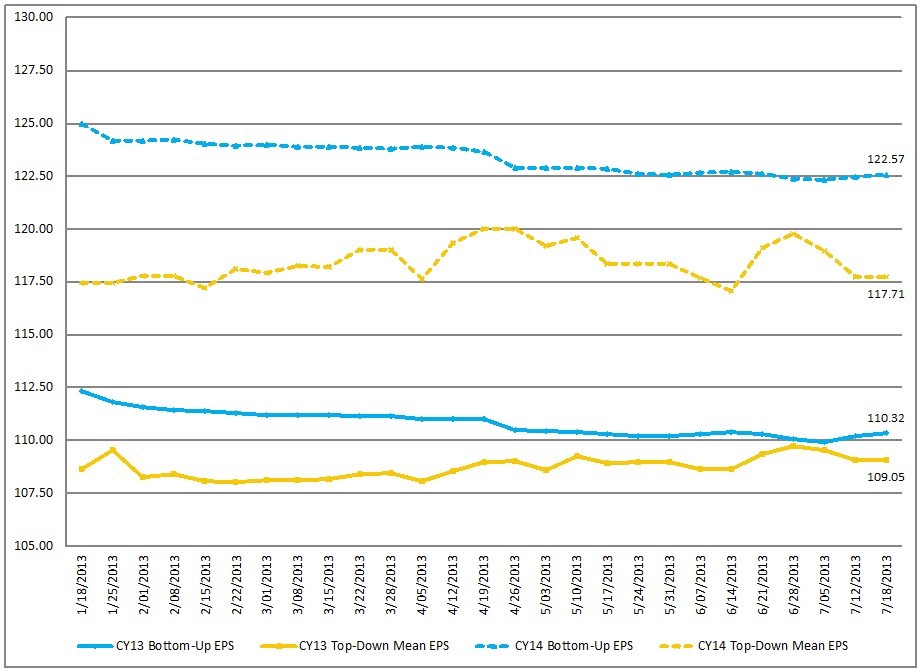
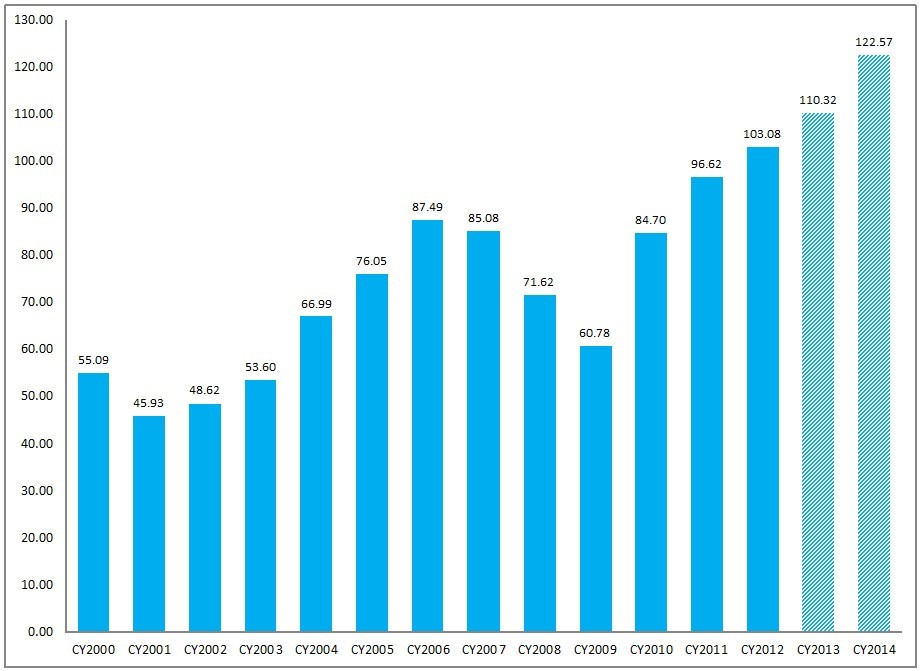
The Current High Levels Of Corporate Profitability") current various levels of profitability - including the S&P500′s operating margins, operating profits, EPS, and After-Tax Corporate Profits as a Percentage of GDP - are at or near record-high levels.  Furthermore, as seen in a variety of aggregate S&P500 earnings forecasts, S&P500 EPS growth for years 2013-2015 is projected to be fairly robust.

I believe that for a variety of reasons, on a going-forward basis earnings face a variety of "headwinds' that will prove substantial.  My analyses indicate that many of these "headwinds" lack proper recognition. Here are some of the  factors that I consider significant:

The threat of deflation

I've discussed the threat of deflation in a variety of recent blog posts, including the July 11, 2013 post titled "Would Deflation Be Beneficial?" as well as the June 10, 2013 post "The Prospect Of Deflation."  While none of the recent various business surveys (or economist surveys) indicate that businesses expect oncoming deflationary conditions, whether businesses would foresee – and successfully adapt – to such deflationary conditions remains to be seen. It appears as if businesses aren't assessing and/or planning for a deflationary environment.  Should deflationary conditions occur - and I believe deflationary conditions are on the horizon - the impact on businesses’ revenues and profitability would likely (depending upon the extent of the deflation as well as other factors) be pronounced.  Deflationary conditions, along with likely accompanying significant declines in aggregate demand, would likely highly impact revenues and profitability.

Ongoing weak revenue growth

Persistent weak revenue growth - and even revenue declines among various companies - has been an ongoing problematical characteristic since 2009.  While this overall weakness in revenue growth has coincided with substantial aggregate growth in profitability,  this weakness in revenue growth is cause for concern on many fronts.

Rising Interest Rates

While the recent increases in interest rates impacts companies differently depending upon many factors, from a general perspective this increase has many direct and indirect impacts on profitability.  While the direct impacts include such issues as borrowing costs, perhaps the greater issue is what impact increases in interest rates will have on overall demand.  While of course the overall impact of rising interest rates on profitability will depend upon the extent of the interest rate increase, even an increase in interest rates to (historically) "normal" levels would likely have a significant - if not substantial - impact on overall business profitability.  A chart of 10-Year Treasury Yield, from Doug Short's monthly update, is seen below and gives one perspective as to how low today's interest rates have fallen:

Dshort 7-12-13 10-year-yields-since-1965-log-scale

Widespread Weak(ening) Economic Growth

While economists continue to predict 2013 GDP will come in above 2.0%, there appears to be a growing consensus that 2nd quarter GDP will be (at most) 1%.  International economic growth, in many instances, is also predicted to be weak or weakening.  Of course, actual GDP growth can come in above or below these forecasts, but for a variety of reasons I believe that even these GDP forecasts will prove overly optimistic.

Other factors

There are many other factors that have positively impacted profitability, some of which I mention in the above-referenced June 11 blog post.  Also in that blog post, one can see how "stretched" overall profitability is to GDP from a long-term perspective.  One critical question is whether such historically high levels of profitability represent a new structural era in which such high levels are sustainable, or whether such outsized profitability is anomalous and will (at minimum) mean-revert.    I strongly believe that, from an all-things-considered basis, the latter will prove true, which will have an outsized negative impact on profitability.
_____

The Special Note summarizes my overall thoughts about our economic situation

SPX at 1695.05 as this post is written

Trends Of S&P500 Earnings Forecasts

S&P500 earnings trends and estimates are a notably important topic, for a variety of reasons, at this point in time.

FactSet publishes a report titled “Earnings Insight” that contains a variety of information including the trends and expectations of S&P500 earnings.

For reference purposes, here are two charts as seen in the “Earnings Insight” (pdf) report of July 19, 2013:

from page 17:

(click on charts to enlarge images)

CY Bottom-Up EPS vs. Top-Down Mean EPS (Trailing 26-Weeks)

FactSet 7-19-13 EPS Trends

-

from page 18:

Calendar Year Bottom-Up EPS Actuals & Estimates

FactSet 7-19-13 Annual EPS

_____

I post various economic forecasts because I believe they should be carefully monitored.  However, as those familiar with this blog are aware, I do not agree with many of the consensus estimates and much of the commentary in these forecast surveys.
_____

The Special Note summarizes my overall thoughts about our economic situation

SPX at 1685.94 as this post is written

Wednesday, July 24, 2013

S&P500 Earnings Estimates For Years 2013, 2014, And 2015

As many are aware, Thomson Reuters publishes earnings estimates for the S&P500.  (My other posts concerning S&P earnings estimates can be found under the S&P500 Earnings label)

The following estimates are from Exhibit 12 of “The Director’s Report” of July 24, 2013, and represent an aggregation of individual S&P500 component “bottom up” analyst forecasts:

Year 2013 estimate:
$111.01/share

Year 2014 estimate:
$123.58/share

Year 2015 estimate:
$135.18/share
_____

I post various economic forecasts because I believe they should be carefully monitored.  However, as those familiar with this blog are aware, I do not agree with many of the consensus estimates and much of the commentary in these forecast surveys.
_____

The Special Note summarizes my overall thoughts about our economic situation

SPX at 1684.43 as this post is written

Standard & Poor’s S&P500 Earnings Estimates For 2013 & 2014 – As Of July 22, 2013

As many are aware, Standard & Poor’s publishes earnings estimates for the S&P500.  (My posts concerning their estimates can be found under the S&P500 Earnings label)

For reference purposes, the most current estimates are reflected below, and are as of July 22, 2013:

Year 2013 estimates add to the following:
-From a “bottom up” perspective, operating earnings of $109.21/share
-From a “top down” perspective, operating earnings of N/A
-From a “top down” perspective, “as reported” earnings of $101.31/share

Year 2014 estimates add to the following:
-From a “bottom up” perspective, operating earnings of $122.82/share
-From a “top down” perspective, operating earnings of $114.53/share
-From a “top down” perspective, “as reported” earnings of $111.53/share

_____

I post various economic forecasts because I believe they should be carefully monitored.  However, as those familiar with this blog are aware, I do not agree with many of the consensus estimates and much of the commentary in these forecast surveys.
_____

The Special Note summarizes my overall thoughts about our economic situation

SPX at 1686.51 as this post is written

Tuesday, July 23, 2013

Current Economic Situation

With regard to our current economic situation,  my thoughts can best be described/summarized by the posts found under the 26 “Building Financial Danger” posts.

My thoughts concerning our ongoing economic situation – with future implications – can be seen on the page titled “A Special Note On Our Economic Situation,” which has been found near the bottom of every blog post since August 15, 2010.
_____

The Special Note summarizes my overall thoughts about our economic situation

SPX at 1695.93 as this post is written

Monday, July 22, 2013

Updates Of Economic Indicators July 2013

Here is an update on various indicators that are supposed to predict and/or depict economic activity.  These indicators have been discussed in previous blog posts:

The July 2013 Chicago Fed National Activity Index (CFNAI)(pdf) updated as of July 22, 2013:
cfnai_monthly_MA3 7-22-13

-


As of 7/19/13 (incorporating data through 7/12/13) the WLI was at 131.2 and the WLI, Gr. was at 4.5%.

A chart of the WLI, Gr. since 2000, from Doug Short’s blog of July 19 titled “ECRI Recession Watch:  Weekly Update” :

Dshort 7-19-13 ECRI-WLI-growth-since-2000 4.5

-


Here is the latest chart, depicting 12-31-07 through 7-13-13:

ads_12-31-07 through 7-13-13

-


As per the July 18 press release, the LEI was at 95.3 and the CEI was at 105.9 in June.

An excerpt from the July 18 release:
Says Ataman Ozyildirim, economist at The Conference Board: “The U.S. LEI was flat in June. Declines in building permits, new orders and stock prices were offset by gains in consumer expectations, initial claims for unemployment insurance, and other financial indicators. However, the LEI’s six-month growth rate remains positive, suggesting the economy will continue expanding through the end of the year.”
Here is a chart of the LEI from Doug Short’s blog post of July 18 titled "Conference Board Leading Economic Index:  Unchanged In June" :

Dshort 7-18-13 CB-LEI

_________

I post various indicators and indices because I believe they should be carefully monitored.  However, as those familiar with this blog are aware, I do not necessarily agree with what they depict or imply.
_____

The Special Note summarizes my overall thoughts about our economic situation

SPX at 1691.52 as this post is written

Congressional Accolades For Ben Bernanke

Last week, during his Congressional testimony, Ben Bernanke received various accolades from members of Congress.

While the official transcript is not yet available, the Wall Street Journal, in a July 19 Real Time Economics post titled "Congress Gives Ben Bernanke A Hero's Send-Off" provides various highlights.

While I don't necessarily agree with any or all of the following statements from members of Congress below, I do find them notable and post them for reference purposes.

Excerpts from the Real Time Economics post include:
In Mr. Bernanke’s two days of delivering the Fed’s semi-annual monetary policy report to Congress, at least 13 members of the House Financial Services Committee and seven members of the Senate Banking Committee prefaced their questions to Mr. Bernanke by thanking him for steering the economy through the Great Recession and its aftermath.
“You acted boldly, decisively and creatively,” Rep. Jeb Hensarling (R., Texas) told Mr. Bernanke Wednesday. “Under your leadership, the Fed took a number of actions that certainly staved off even worse economic” pain, said Mr. Hensarling, who is chairman of the House committee and has been an outspoken critic of some Fed policies.
also:
Sen. Pat Toomey (R., Pa.), who has offered his share of criticism about U.S. economic policy in recent years, told Mr. Bernanke: “Your quiet but strong leadership has been instrumental in keeping our economy from falling into an abyss and repeating the devastation of a Great Depression. And we are now, because of your leadership, on the path towards turning the economy around.”
also:
Sen. Charles Schumer (D., N.Y.) told Mr. Bernanke that 2014 and 2015 “will be stronger economically than our present time, and that will be in large part because of the building blocks that you put into place, even if you’re no longer chairman of the Fed.”
_____

The Special Note summarizes my overall thoughts about our economic situation

SPX at 1692.09 as this post is written

Brookings Institution's "2013 Economic Values" Survey - Notable Aspects

The Brooking Institution released a study on July 18, 2013 titled "2013 Economic Values Survey."

I found various aspects of the survey's results to be notable, especially those relating to "Perceptions Of Economic Mobility" (among various generations) and capitalism.  As well, the roll of government is included.
_____

The Special Note summarizes my overall thoughts about our economic situation

SPX at 1692.09 as this post is written

Friday, July 19, 2013

Long-Term Charts Of The ECRI WLI & ECRI WLI, Gr. – July 19, 2013 Update

As I stated in my July 12, 2010 post ("ECRI WLI Growth History"):
For a variety of reasons, I am not as enamored with ECRI’s WLI and WLI Growth measures as many are.
However, I do think the measures are important and deserve close monitoring and scrutiny.
The movement of the ECRI WLI and WLI, Gr. is particularly notable at this time, as ECRI publicly announced on September 30, 2011 that the U.S. was “tipping into recession,” and ECRI has reiterated the view that the U.S. economy is currently in a recession, seen most recently in these five sources :
Other past notable 2012 reaffirmations of the September 30, 2011 recession call by ECRI were seen (in chronological order)  on March 15 (“Why Our Recession Call Stands”) as well as various interviews and statements the week of May 6, including:
Also, subsequent to May 2012:
-

Below are three long-term charts, from Doug Short’s blog post of July 19 titled “ECRI Recession Watch:  Weekly Update”  These charts are on a weekly basis through the July 19 release, indicating data through July 12, 2013.

Here is the ECRI WLI (defined at ECRI’s glossary):

(click on charts to enlarge images)
Dshort 7-19-13 ECRI-WLI 131.2

-

This next chart depicts, on a long-term basis, the Year-over-Year change in the 4-week moving average of the WLI:

Dshort 7-19-13 ECRI-WLI-YoY 7.0 percent

-

This last chart depicts, on a long-term basis, the WLI, Gr.:

Dshort 7-19-13 ECRI-WLI-growth-since-1965 4.5

_________

I post various economic indicators and indices because I believe they should be carefully monitored.  However, as those familiar with this blog are aware, I do not necessarily agree with what they depict or imply.
_____

The Special Note summarizes my overall thoughts about our economic situation

SPX at 1688.93 as this post is written