Showing posts with label Shanghai Stock Exchange Composite Index. Show all posts

Tuesday, October 23, 2018

The S&P500 Vs. The Shanghai Stock Exchange Composite Index – October 23, 2018

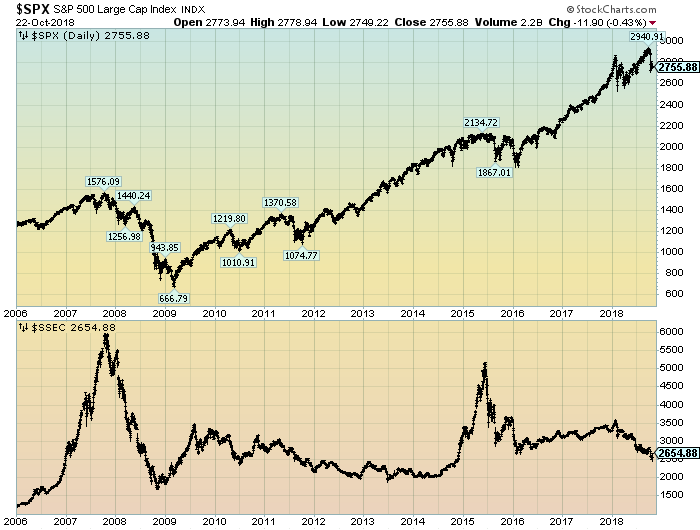
For reference purposes, the chart below shows the S&P500 vs. the Shanghai Stock Exchange Composite Index on a daily basis, since 2006, with price labels:
(click on chart to enlarge image)(chart courtesy of StockCharts.com; chart creation and annotation by the author)
S&P500 v SSEC
_____
The Special Note summarizes my overall thoughts about our economic situation
SPX at 2755.88 as this post is written

Tuesday, April 12, 2016

The S&P500 Vs. The Shanghai Stock Exchange Composite Index – April 12, 2016

For reference purposes, the chart below shows the S&P500 vs. the Shanghai Stock Exchange Composite Index on a daily basis, since 2006, with price labels:
(click on chart to enlarge image)(chart courtesy of StockCharts.com; chart creation and annotation by the author)
S&P500 vs. Shanghai Stock Market
_____
The Special Note summarizes my overall thoughts about our economic situation
SPX at 2041.99 as this post is written

Monday, March 14, 2016

The S&P500 Vs. The Shanghai Stock Exchange Composite Index – March 14, 2016

For reference purposes, the chart below shows the S&P500 vs. the Shanghai Stock Exchange Composite Index on a daily basis, since 2006, with price labels:
(click on chart to enlarge image)(chart courtesy of StockCharts.com; chart creation and annotation by the author)
S&P500 and Shanghai Stock Exchange Composite Index
_____
The Special Note summarizes my overall thoughts about our economic situation
SPX at 2022.19 as this post is written
Thursday, February 18, 2016

The S&P500 Vs. The Shanghai Stock Exchange Composite Index – February 18, 2016

For reference purposes, the chart below shows the S&P500 vs. the Shanghai Stock Exchange Composite Index on a daily basis, since 2006, with price labels:
(click on chart to enlarge image)(chart courtesy of StockCharts.com; chart creation and annotation by the author)
S&P500 and Shanghai Stock Exchange Composite Index chart
_____
The Special Note summarizes my overall thoughts about our economic situation
SPX at 1926.82 as this post is written

Wednesday, October 28, 2015

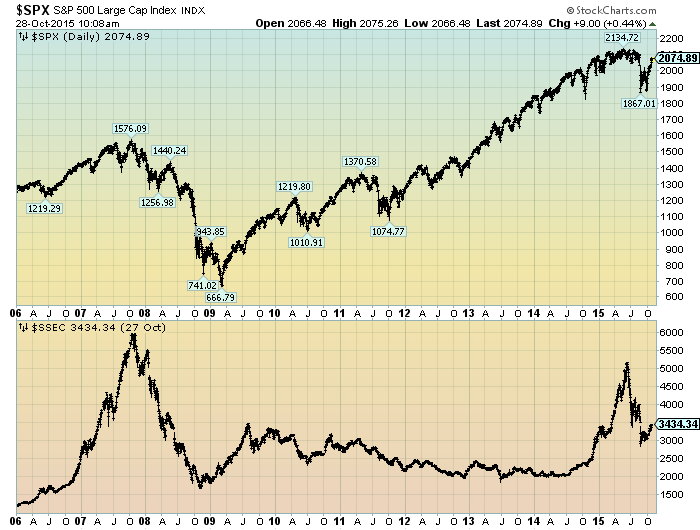
The S&P500 Vs. The Shanghai Stock Exchange Composite Index – October 28, 2015

For reference purposes, the chart below shows the S&P500 vs. the Shanghai Stock Exchange Composite Index on a daily basis, since 2006, with price labels:
(click on chart to enlarge image)(chart courtesy of StockCharts.com; chart creation and annotation by the author)
S&P500 and Shanghai Stock Exchange
_____
The Special Note summarizes my overall thoughts about our economic situation
SPX at 2073.99 as this post is written
Thursday, August 27, 2015

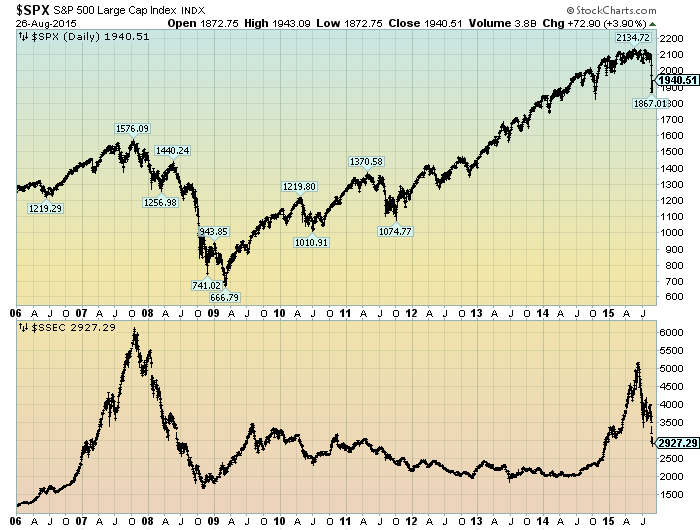
The S&P500 Vs. The Shanghai Stock Exchange Composite Index – August 27, 2015

For reference purposes, the chart below shows the S&P500 vs. the Shanghai Stock Exchange Composite Index on a daily basis, since 2006, with price labels:
(click on chart to enlarge image)(chart courtesy of StockCharts.com; chart creation and annotation by the author)
S&P500 and Shanghai Stock Exchange Composite Index
_____
The Special Note summarizes my overall thoughts about our economic situation
SPX at 1940.51 as this post is written
Monday, July 28, 2014

The S&P500 Vs. The Shanghai Stock Exchange Composite Index – July 28, 2014

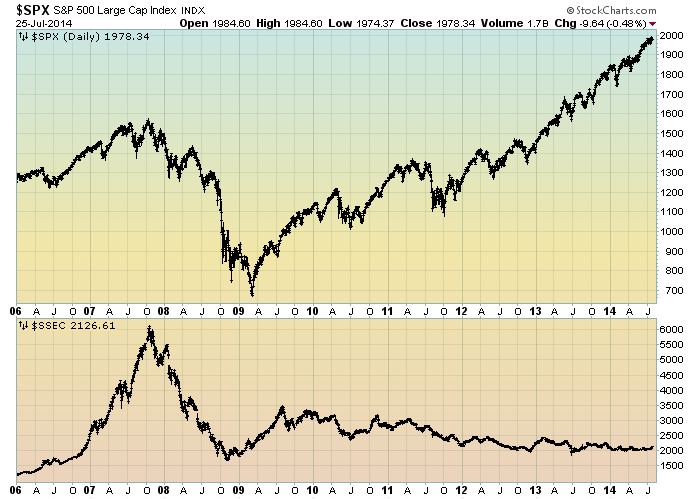
Starting on May 3, 2010 I have written posts concerning the notable divergence that has occurred between the S&P500 and Chinese (Shanghai Composite) stock markets.
The chart below illustrates this divergence; it shows the S&P500 vs. the Shanghai Composite on a daily basis, since 2006:
(click on chart to enlarge image)(chart courtesy of StockCharts.com; chart creation and annotation by the author)
SPX vs. Shanghai Stock Exchange Composite Index
-
It is notable that the Shanghai Composite led the SPX (S&P500) significantly in late ’08 – early ’09, yet it has been (generally) declining since that time.
I continue to find this divergence between the S&P500 and Shanghai Composite to be notable and disconcerting, on an “all things considered” basis.
_____
The Special Note summarizes my overall thoughts about our economic situation
SPX at 1980.25 as this post is written
Tuesday, April 29, 2014

The S&P500 Vs. The Shanghai Stock Exchange Composite Index – April 29, 2014

Starting on May 3, 2010 I have written posts concerning the notable divergence that has occurred between the S&P500 and Chinese (Shanghai Composite) stock markets.
The chart below illustrates this divergence; it shows the S&P500 vs. the Shanghai Composite on a daily basis, since 2006:
(click on chart to enlarge image)(chart courtesy of StockCharts.com; chart creation and annotation by the author)
S&P500 vs. Shanghai Stock Exchange Composite
-
It is notable that the Shanghai Composite led the SPX (S&P500) significantly in late ’08 – early ’09, yet it has been (generally) declining since that time.
I continue to find this divergence between the S&P500 and Shanghai Composite to be notable and disconcerting, on an “all things considered” basis.
_____
The Special Note summarizes my overall thoughts about our economic situation
SPX at 1869.43 as this post is written

Tuesday, March 4, 2014

The S&P500 Vs. The Shanghai Stock Exchange Composite Index – March 4, 2014

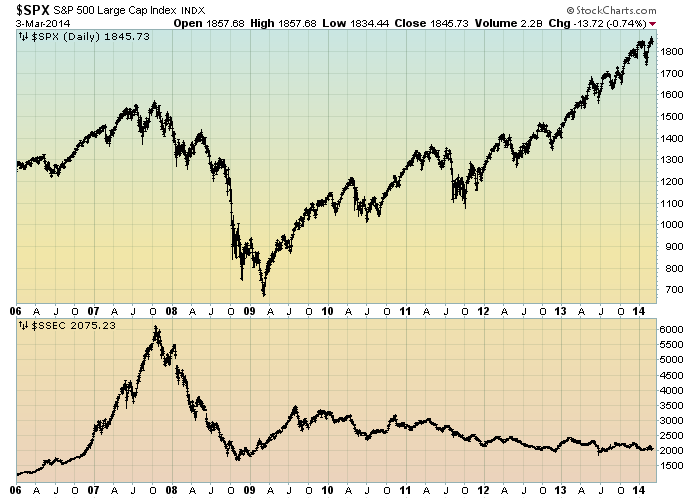
Starting on May 3, 2010 I have written posts concerning the notable divergence that has occurred between the S&P500 and Chinese (Shanghai Composite) stock markets.
The chart below illustrates this divergence; it shows the S&P500 vs. the Shanghai Composite on a daily basis, since 2006:
(click on chart to enlarge image)(chart courtesy of StockCharts.com; chart creation and annotation by the author)
EconomicGreenfield 3-4-14 SPX v SSEC
-
It is notable that the Shanghai Composite led the SPX (S&P500) significantly in late ’08 – early ’09, yet it has been (generally) declining since that time.
I continue to find this divergence between the S&P500 and Shanghai Composite to be notable and disconcerting, on an “all things considered” basis.
_____
The Special Note summarizes my overall thoughts about our economic situation
SPX at 1845.73 as this post is written

Monday, January 6, 2014

The S&P500 Vs. The Shanghai Stock Exchange Composite Index – January 6, 2014

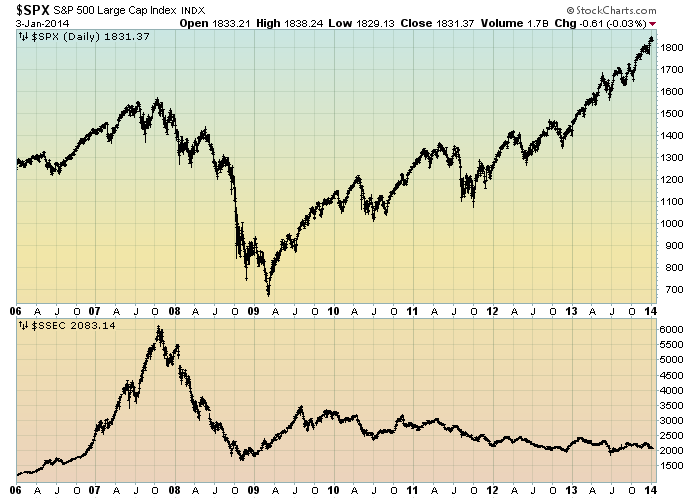
Starting on May 3, 2010 I have written posts concerning the notable divergence that has occurred between the S&P500 and Chinese (Shanghai Composite) stock markets.
The chart below illustrates this divergence; it shows the S&P500 vs. the Shanghai Composite on a daily basis, since 2006:
(click on chart to enlarge image)(chart courtesy of StockCharts.com; chart creation and annotation by the author)
EconomicGreenfield 1-6-14 SPX v SSEC
-
It is notable that the Shanghai Composite led the SPX (S&P500) significantly in late ’08 – early ’09, yet it has been (generally) declining since that time.
I continue to find this divergence between the S&P500 and  Shanghai Composite to be notable and disconcerting, on an “all things considered” basis.
_____
The Special Note summarizes my overall thoughts about our economic situation
SPX at 1830.26 as this post is written

Wednesday, November 6, 2013

The S&P500 Vs. The Shanghai Stock Exchange Composite Index – November 6, 2013

Starting on May 3, 2010 I have written posts concerning the notable divergence that has occurred between the S&P500 and Chinese (Shanghai Composite) stock markets.
The chart below illustrates this divergence; it shows the S&P500 vs. the Shanghai Composite on a daily basis, since 2006:
(click on chart to enlarge image)(chart courtesy of StockCharts.com; chart creation and annotation by the author)
EconomicGreenfield 11-6-13 SPX vs SSEC
-
It is notable that the Shanghai Composite led the SPX (S&P500) significantly in late ’08 – early ’09, yet it has been (generally) declining since that time.
I continue to find this divergence between the S&P500 and  Shanghai Composite to be notable and disconcerting, on an “all things considered” basis.
_____
The Special Note summarizes my overall thoughts about our economic situation
SPX at 1762.97 as this post is written

Thursday, September 12, 2013

The S&P500 Vs. The Shanghai Stock Exchange Composite Index – September 12, 2013

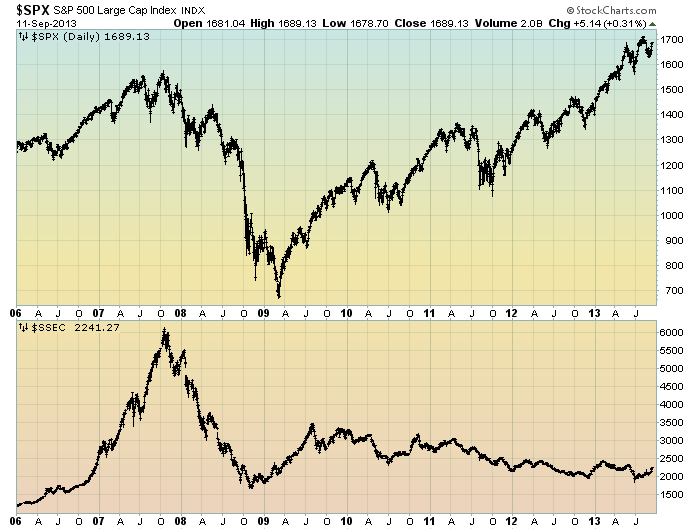
Starting on May 3, 2010 I have written posts concerning the notable divergence that has occurred between the S&P500 and Chinese (Shanghai Composite) stock markets.

The chart below illustrates this divergence; it shows the S&P500 vs. the Shanghai Composite on a daily basis, since 2006:

(click on chart to enlarge image)(chart courtesy of StockCharts.com; chart creation and annotation by the author)

EconomicGreenfield 9-12-13 SPX v SSEC

-

It is notable that the Shanghai Composite led the SPX (S&P500) significantly in late ’08 – early ’09, yet it has been (generally) declining since that time.

I continue to find this divergence between the S&P500 and  Shanghai Composite to be notable and disconcerting, on an “all things considered” basis.
_____

The Special Note summarizes my overall thoughts about our economic situation

SPX at 1689.13 as this post is written

Wednesday, June 19, 2013

The S&P500 Vs. The Shanghai Stock Exchange Composite Index – June 19, 2013

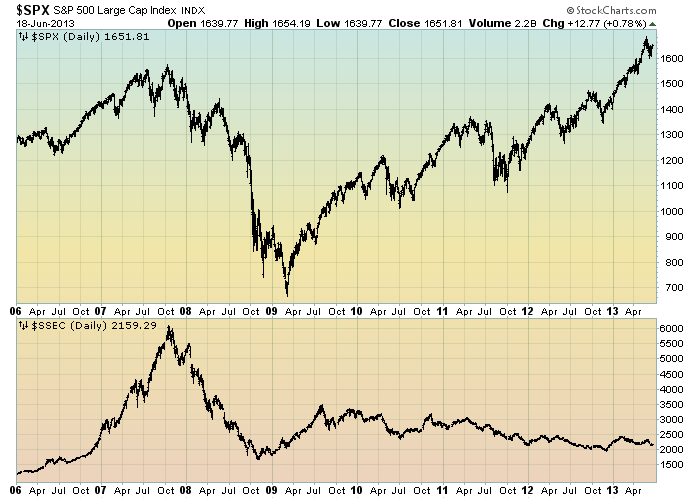
Starting on May 3, 2010 I have written posts concerning the notable divergence that has occurred between the S&P500 and Chinese (Shanghai Composite) stock markets.

The chart below illustrates this divergence; it shows the S&P500 vs. the Shanghai Composite on a daily basis, since 2006:

(click on chart to enlarge image)(chart courtesy of StockCharts.com; chart creation and annotation by the author)

EconomicGreenfield 6-19-13 SSEC v SPX

-

It is notable that the Shanghai Composite led the SPX (S&P500) significantly in late ’08 – early ’09, yet it has been (generally) declining since that time.

I continue to find this divergence between the S&P500 and  Shanghai Composite to be notable and disconcerting, on an “all things considered” basis.
_____

The Special Note summarizes my overall thoughts about our economic situation

SPX at 1651.81 as this post is written

Tuesday, April 16, 2013

The S&P500 Vs. The Shanghai Stock Exchange Composite Index – April 16, 2013


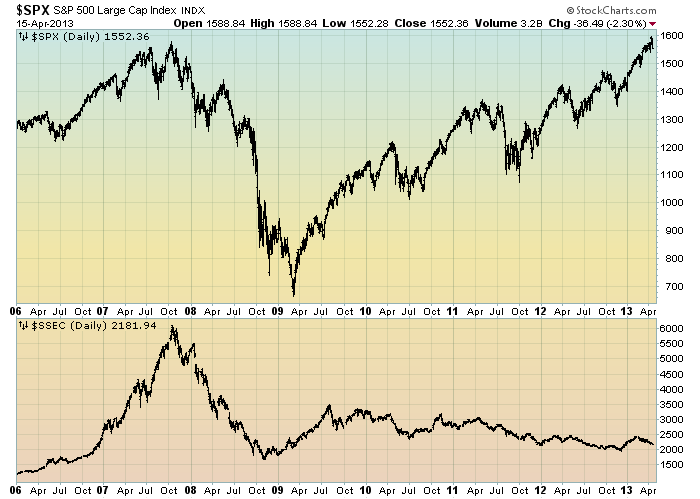
Starting on May 3, 2010 I have written posts concerning the notable divergence that has occurred between the S&P500 and Chinese (Shanghai Composite) stock markets.

The chart below illustrates this divergence; it shows the S&P500 vs. the Shanghai Composite on a daily basis, since 2006:

(click on chart to enlarge image)(chart courtesy of StockCharts.com; chart creation and annotation by the author)

EconomicGreenfield 4-16-13 SPX v SSEC

-

It is notable that the Shanghai Composite led the SPX (S&P500) significantly in late ’08 – early ’09, yet it has been (generally) declining since that time.

I continue to find this divergence between the S&P500 and  Shanghai Composite to be notable and disconcerting, on an “all things considered” basis.
_____

The Special Note summarizes my overall thoughts about our economic situation

SPX at 1552.36 as this post is written

Tuesday, January 15, 2013

The S&P500 Vs. The Shanghai Stock Exchange Composite Index – January 15, 2013


Starting on May 3, 2010 I have written posts concerning the notable divergence that has occurred between the S&P500 and Chinese (Shanghai Composite) stock markets.

The chart below illustrates this divergence; it shows the S&P500 vs. the Shanghai Composite on a daily basis, since 2006:

(click on chart to enlarge image)(chart courtesy of StockCharts.com; chart creation and annotation by the author)

EconomicGreenfield 1-15-13 SPX v SSEC

-

It is notable that the Shanghai Composite led the SPX (S&P500) significantly in late ’08 – early ’09, yet it has been (generally) declining since that time.

I continue to find this divergence between the S&P500 and  Shanghai Composite to be notable and disconcerting, on an “all things considered” basis.
_____

The Special Note summarizes my overall thoughts about our economic situation

SPX at 1464.91 as this post is written

Wednesday, October 17, 2012

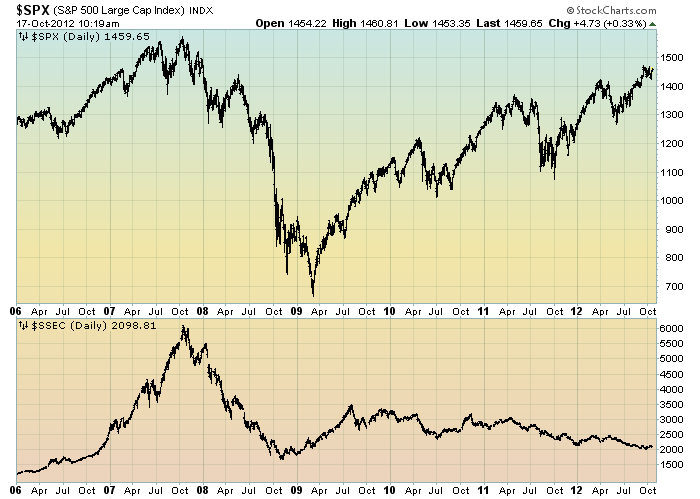
The S&P500 Vs. The Shanghai Stock Exchange Composite Index – October 17, 2012


Starting on May 3, 2010 I have written posts concerning the notable divergence that has occurred between the S&P500 and Chinese (Shanghai Composite) stock markets.

The chart below illustrates this divergence; it shows the S&P500 vs. the Shanghai Composite on a daily basis, since 2006:

(click on chart to enlarge image)(chart courtesy of StockCharts.com; chart creation and annotation by the author)


-

It is notable that the Shanghai Composite led the SPX (S&P500) significantly in late ’08 – early ’09, yet it has been (gradually) declining since that time.

I continue to find this divergence between the S&P500 and  Shanghai Composite to be notable and disconcerting, on an “all things considered” basis.
_____

The Special Note summarizes my overall thoughts about our economic situation

SPX at 1460.91 as this post is written

Tuesday, July 31, 2012

The S&P500 Vs. The Shanghai Stock Exchange Composite Index – July 31, 2012


Starting on May 3, 2010 I have written posts concerning the notable divergence that has occurred between the S&P500 and Chinese (Shanghai Composite) stock markets.

The chart below illustrates this divergence; it shows the S&P500 vs. the Shanghai Composite on a daily basis, since 2006:

(click on chart to enlarge image)(chart courtesy of StockCharts.com; chart creation and annotation by the author)


-

It is notable that the Shanghai Composite led the SPX (S&P500) significantly in late ’08 – early ’09, yet it has been (gradually) declining since that time.

I continue to find this divergence between the S&P500 and  Shanghai Composite to be notable and disconcerting, on an “all things considered” basis.
_____

The Special Note summarizes my overall thoughts about our economic situation

SPX at 1385.61 as this post is written

Thursday, June 21, 2012

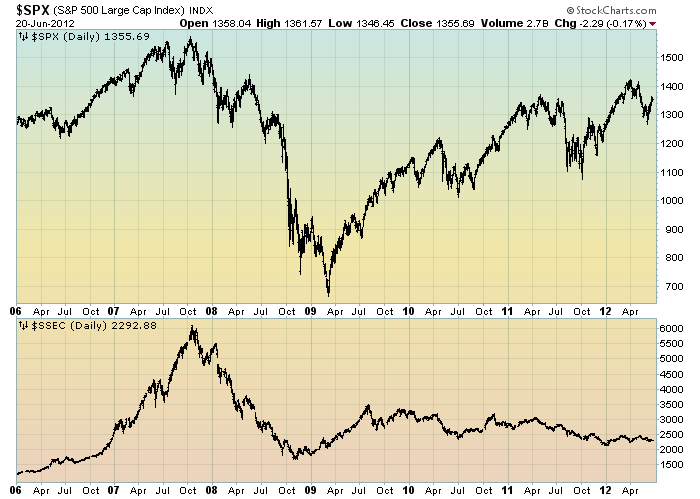
The S&P500 Vs. The Shanghai Stock Exchange Composite Index – June 21, 2012


Starting on May 3, 2010 I have written posts concerning the notable divergence that has occurred between the S&P500 and Chinese (Shanghai Composite) stock markets.

The chart below illustrates this divergence; it shows the S&P500 vs. the Shanghai Composite on a daily basis, since 2006:

(click on chart to enlarge image)(chart courtesy of StockCharts.com; chart creation and annotation by the author)


-

It is notable that the Shanghai Composite led the SPX (S&P500) significantly in late ’08 – early ’09, yet it has been (gradually) declining since that time.

I continue to find this divergence between the S&P500 and  Shanghai Composite to be notable and disconcerting, on an “all things considered” basis.

_____

The Special Note summarizes my overall thoughts about our economic situation

SPX at 1355.69 as this post is written

Wednesday, March 28, 2012

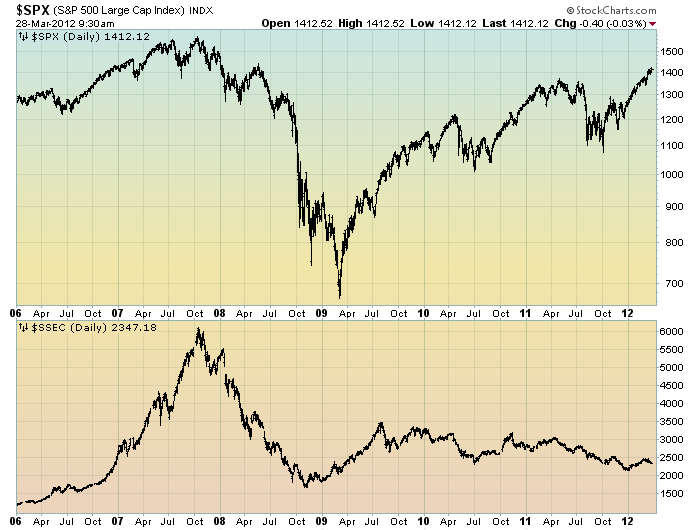
The S&P500 Vs. The Shanghai Stock Exchange Composite Index – March 28, 2012


Starting on May 3, 2010 I have written posts concerning the notable divergence that has occurred between the S&P500 and Chinese (Shanghai Composite) stock markets.

The chart below illustrates this divergence; it shows the S&P500 vs. the Shanghai Composite on a daily basis, since 2006:

(click on chart to enlarge image)(chart courtesy of StockCharts.com; chart creation and annotation by the author)


-

It is notable that the Shanghai Composite led the SPX (S&P500) significantly in late ’08 – early ’09, yet it has been (gradually) declining since that time.

I continue to find this divergence between the S&P500 and  Shanghai Composite to be notable and disconcerting, on an “all things considered” basis.
_____

The Special Note summarizes my overall thoughts about our economic situation

SPX at 1409.82 as this post is written

Thursday, January 12, 2012

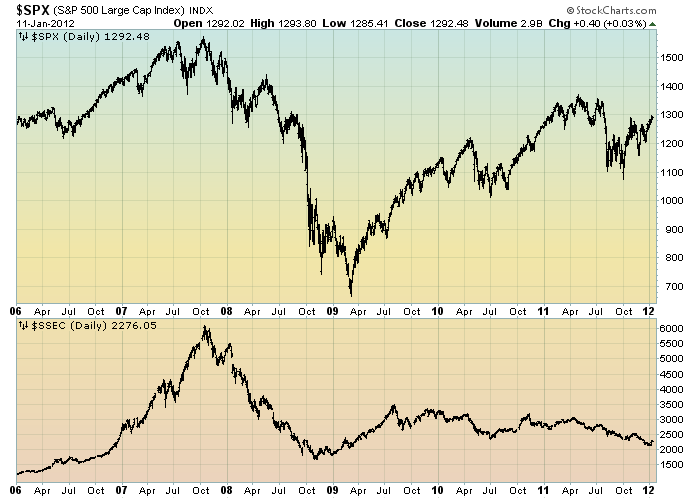
The S&P500 Vs. The Shanghai Stock Exchange Composite Index – January 12, 2012


Starting on May 3, 2010 I have written posts concerning the notable divergence that has occurred between the S&P500 and Chinese (Shanghai Composite) stock markets.

The chart below illustrates this divergence; it shows the S&P500 vs. the Shanghai Composite on a daily basis, since 2006:

(click on chart to enlarge image)(chart courtesy of StockCharts.com)


-

It is notable that the Shanghai Composite led the SPX (S&P500) significantly in late ’08 – early ’09, yet it has been declining lately.

I continue to find this divergence between the S&P500 and  Shanghai Composite to be notable and disconcerting, on an “all things considered” basis.
_____

The Special Note summarizes my overall thoughts about our economic situation

SPX at 1292.48 as this post is written