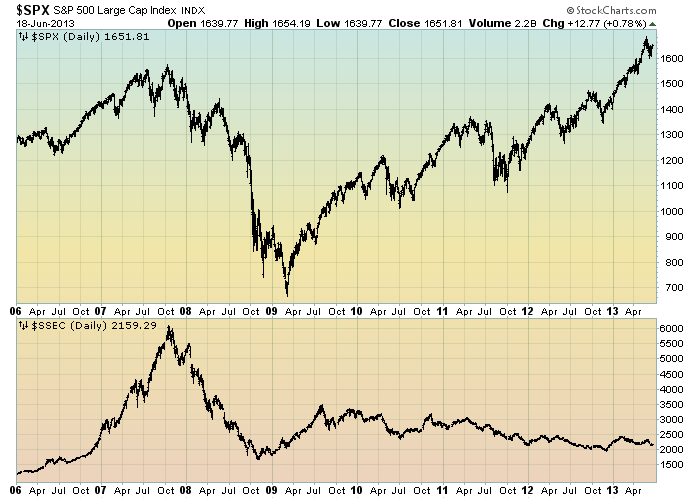
Starting on May 3, 2010 I have written posts concerning the notable divergence that has occurred between the S&P500 and Chinese (Shanghai Composite) stock markets.
The chart below illustrates this divergence; it shows the S&P500 vs. the Shanghai Composite on a daily basis, since 2006:
(click on chart to enlarge image)(chart courtesy of StockCharts.com; chart creation and annotation by the author)
-
It is notable that the Shanghai Composite led the SPX (S&P500) significantly in late ’08 – early ’09, yet it has been (generally) declining since that time.
I continue to find this divergence between the S&P500 and Shanghai Composite to be notable and disconcerting, on an “all things considered” basis.
_____
The Special Note summarizes my overall thoughts about our economic situation
SPX at 1651.81 as this post is written
No comments:
Post a Comment