In various past posts I have written of the challenges businesses face in pricing, given today’s economic environment. One aspect that I mentioned in the December 16, 2010 and April 25, 2011 posts was how the PPI (Producer Price Index) growth was significantly outpacing that of the CPI.
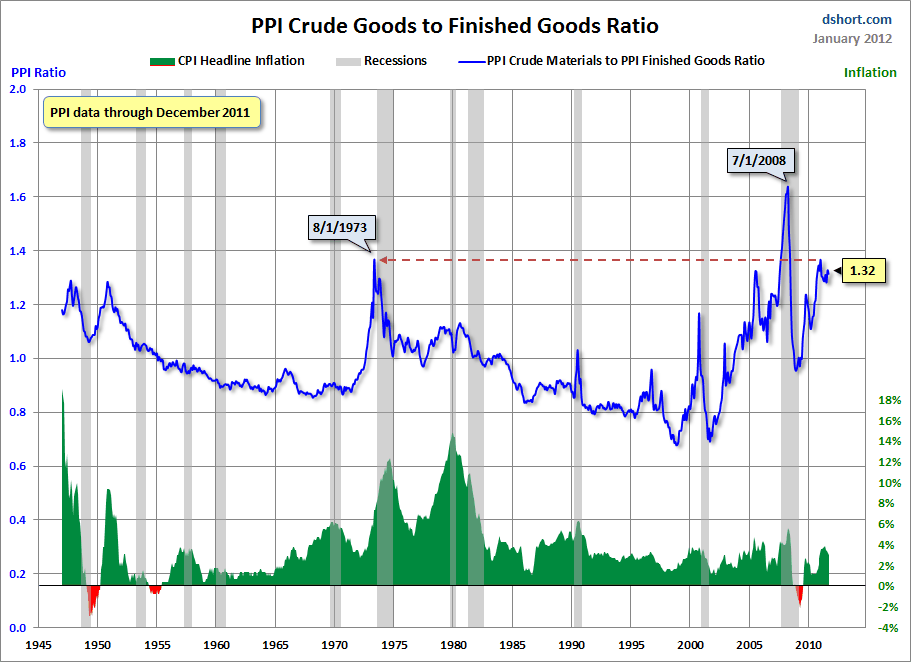
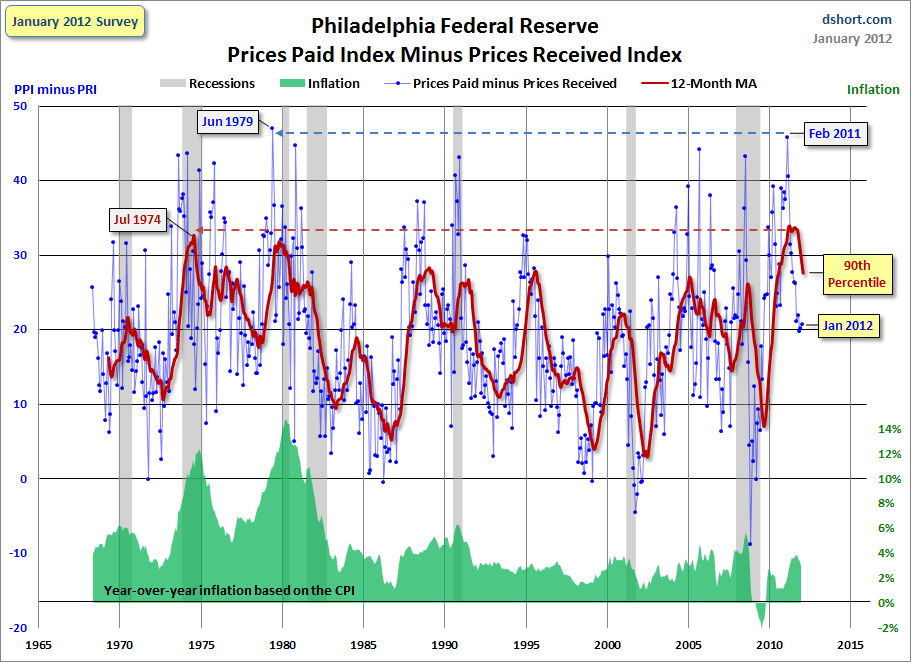
Since those posts, this PPI-CPI growth rate issue has remained notable. Doug Short, on his blog, has posted a few interesting charts illustrating this concept from a long-term historical viewpoint. Both of the charts shown below are from his January 20, 2012 post titled “Profit Margin Squeeze: New Update.”
First, here is a chart that shows the ratio, in the PPI, of Crude Goods to Finished Goods. The CPI is plotted below, in green. This situation, as depicted, is problematical for firms, and the overall economy, on a number of fronts:
(click on chart images to enlarge)
-
Second, a chart that shows data from the Philadelphia Federal Reserve regarding Prices Paid vs. Prices Received, with Inflation (CPI) and Recession periods also shown:
I believe that what this chart depicts is notable in a variety of ways. As shown, we are experiencing a unique situation, and while the index level has recently subsided, we are near historical peaks for the 12-month moving average (MA) as shown.
I believe this data and its implications for businesses and the economy at large is of great concern. Seeing how this situation resolves will be very interesting. This is especially so given the vulnerability of the U.S. Dollar to a substantial decline, a topic that I have written extensively about.
_____
The Special Note summarizes my overall thoughts about our economic situation
SPX at 1316.00 as this post is written


No comments:
Post a Comment