On October 27, 2009, I wrote a post titled "Aruoba -Diebold-Scotti Business Conditions (ADS) Index."
That post explained the then-new ADS Index, and I have been featuring a chart of the ADS in the monthly Updates On Economic Indicators.
On February 23, Doug Short published a post titled "The Philly Fed ADS Business Conditions Index" which shows a variety of longer-term charts depicting the ADS Index.
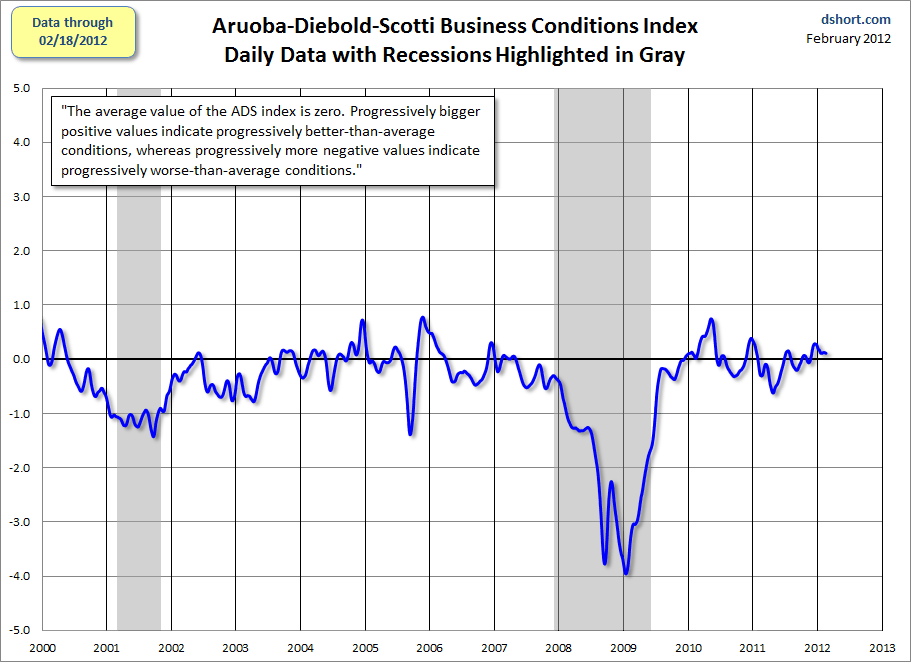
There are three charts in that post that I find particularly notable, and they are shown below.
The first is a reference chart of the ADS Index since 2000:
-
The second chart displays the ADS Index in blue and the CFNAI (Chicago Fed National Activity Index), which is presented on a 3-month Moving Average basis (i.e. CFNAI-MA3), overlaid in red. As well, a linear regression is shown for each measure:
-
Lastly, a chart that compares the ADS (depicted on a 91-day moving average) in blue vs. GDP in green and red, with linear regressions (dashed lines) of each:
_________
I post various indicators and indices because I believe they should be carefully monitored. However, as those familiar with this blog are aware, I do not necessarily agree with what they depict or imply.
_____
The Special Note summarizes my overall thoughts about our economic situation
SPX at 1358.38 as this post is written


No comments:
Post a Comment