Showing posts with label ADS Index. Show all posts

Monday, February 27, 2012

The ADS Index Presented In Various Charts


On October 27, 2009, I wrote a post titled "Aruoba -Diebold-Scotti Business Conditions (ADS)  Index."

That post explained the then-new ADS Index, and I have been featuring a chart of the ADS in the monthly Updates On Economic Indicators.

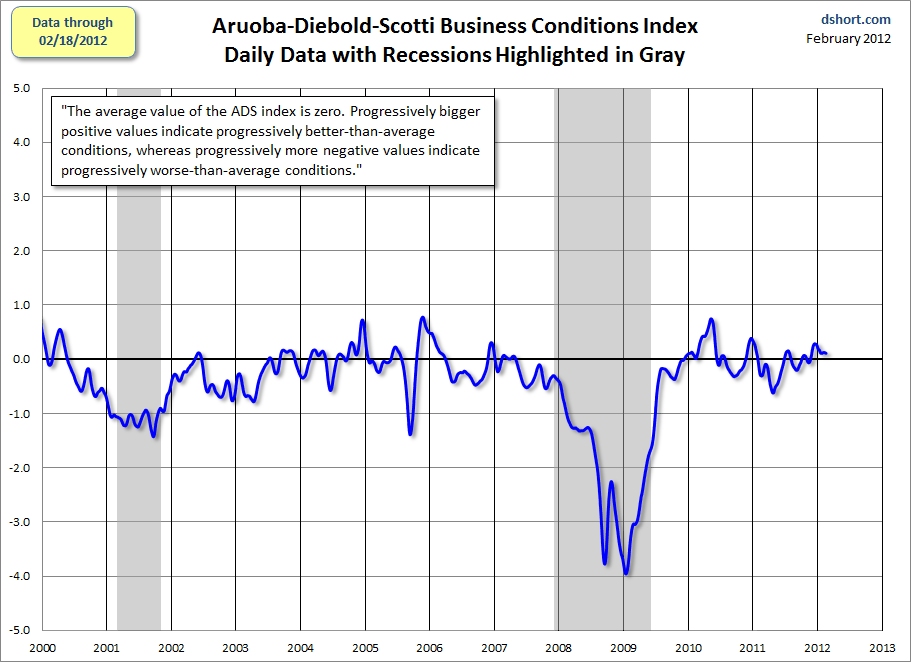
On February 23, Doug Short published a post titled "The Philly Fed ADS Business Conditions Index"  which shows a variety of longer-term charts depicting the ADS Index.

There are three charts in that post that I find particularly notable, and they are shown below.

The first is a reference chart of the ADS Index since 2000:

-

The second chart displays the ADS Index in blue and the CFNAI (Chicago Fed National Activity Index), which is presented on a 3-month Moving Average basis (i.e. CFNAI-MA3), overlaid in red.  As well, a linear regression is shown for each measure:


-

Lastly, a chart that compares the ADS (depicted on a 91-day moving average) in blue vs. GDP in green and red, with linear regressions (dashed lines) of each:


_________

I post various indicators and indices because I believe they should be carefully monitored.  However, as those familiar with this blog are aware, I do not necessarily agree with what they depict or imply.
_____

The Special Note summarizes my overall thoughts about our economic situation

SPX at 1358.38 as this post is written

Monday, January 11, 2010

Updates On Economic Indicators

Here are some indicators that are supposed to predict and/or depict economic activity. These indicators have been discussed in previous blog posts:

The ECRI WLI (Weekly Leading Index) was at 131.5 for the week ended January 1. From the story in the link below: "'With the WLI climbing to a one-and-a-half-year high, the U.S. economy is firmly set to strengthen in the coming months,' said Lakshman Achuthan, Managing Director at ECRI."

http://www.businesscycle.com/news/press/1685/

Fortune's Big Picture Index was at 17.59 as of December 18. This is at a level that is very near to the low of the data series; furthermore, as one can see, its gauge depicting "recession v. recovery" seems to strongly indicate "recession."

http://money.cnn.com/magazines/fortune/storysupplement/recovery_index/index.html

The Dow Jones ESI (Economic Sentiment Indicator) is shown to be at 38.7 as of December 31, having risen steadily throughout 2009.

Here is the latest chart depicting the Aruoba-Diebold-Scotti Business Conditions (ADS) Index. I wrote a blog post concerning this index on October 27:


http://www.philadelphiafed.org/research-and-data/real-time-center/business-conditions-index/

Lastly, although I have not discussed the Conference Board LEI (Leading Economic Indicator), I find the chart included in this press release to be interesting. Here one can see the LEI at 104.9 for November. As seen in the December 17 Press Release (link found below), the LEI is now slightly higher than the latest peak of July 2007.

The CEI (Coincident Economic Index) is at 100.1. There is a sizable difference between the LEI and the CEI.

http://www.conference-board.org/pdf_free/economics/bci/USLEIpr_1209.pdf

SPX at 1144.98 as this post is written

Tuesday, October 27, 2009

Aruoba-Diebold-Scotti Business Conditions (ADS) Index

The below link discusses a new economic forecast index called the Aruoba-Diebold-Scotti Business Conditions (ADS) Index:

http://knowledgetoday.wharton.upenn.edu/2009/10/the-economy-right-now.html

Here is a chart of the index that can be found on the Philadelphia Fed website at this link:

http://www.philadelphiafed.org/research-and-data/real-time-center/business-conditions-index/


From the above Philadelphia Fed link:

"The Aruoba-Diebold-Scotti business conditions index is designed to track real business conditions at high frequency. Its underlying economic indicators (weekly initial jobless claims; monthly payroll employment, industrial production, personal income less transfer payments, manufacturing and trade sales; and quarterly real GDP) blend high- and low-frequency information and stock and flow data. Both the ADS index and this web page are updated as data on the index's underlying components are released.

The average value of the ADS index is zero. Progressively bigger positive values indicate progressively better-than-average conditions, whereas progressively more negative values indicate progressively worse-than-average conditions. The ADS index may be used to compare business conditions at different times. A value of -3.0, for example, would indicate business conditions significantly worse than at any time in either the 1990-91 or the 2001 recession, during which the ADS index never dropped below -2.0.

The vertical lines on the figure provide information as to which indicators are available for which dates. For dates to the left of the left line, the ADS index is based on observed data for all six underlying indicators. For dates between the left and right lines, the ADS index is based on at least two monthly indicators (typically employment and industrial production) and initial jobless claims. For dates to the right of the right line, the ADS
index is based on initial jobless claims and possibly one monthly indicator."

________

At this point, I don't have a lot to say about this index. I do find the latest downturn from about mid-August to be notable.

Also, it would be interesting to see how this index compares historically to the S&P500 as well as the other index and forecasts I have previously discussed on this site such as the ECRI WLI, Fortune Big Picture Index, and Dow Jones ESI.


SPX at 1062.47 as this post is written