Here is an update on various indicators that are supposed to predict and/or depict economic activity. These indicators have been discussed in previous blog posts:
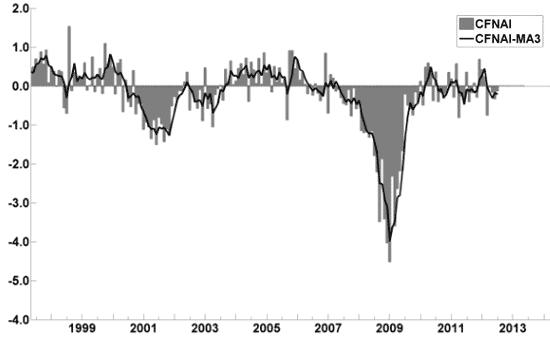
The August Chicago Fed National Activity Index (CFNAI)(pdf) updated as of August 20, 2012:
-
An excerpt from the July 19 update titled “Index forecasts weaker growth” :
The July update of the USA TODAY/IHS Global Insight Economic Outlook Index shows real GDP growth, at a six-month annualized growth rate, slowing to 1.6% in July and then increasing to 2% by year end. While employment, housing (mostly the multifamily sector) and consumer spending are slowly recovering, concerns about the Eurozone and world growth continue.
-
As of 8/17/12 (incorporating data through 8/10/12) the WLI was at 122.8 and the WLI, Gr. was at -.6%.
A chart of the WLI, Gr. since 2000, from Doug Short’s blog of August 17 titled “ECRI Weekly Leading Index Continues to Undermine ECRI’s Recession Call” :
-
Here is the latest chart, depicting 8-11-10 to 8-11-12:
-
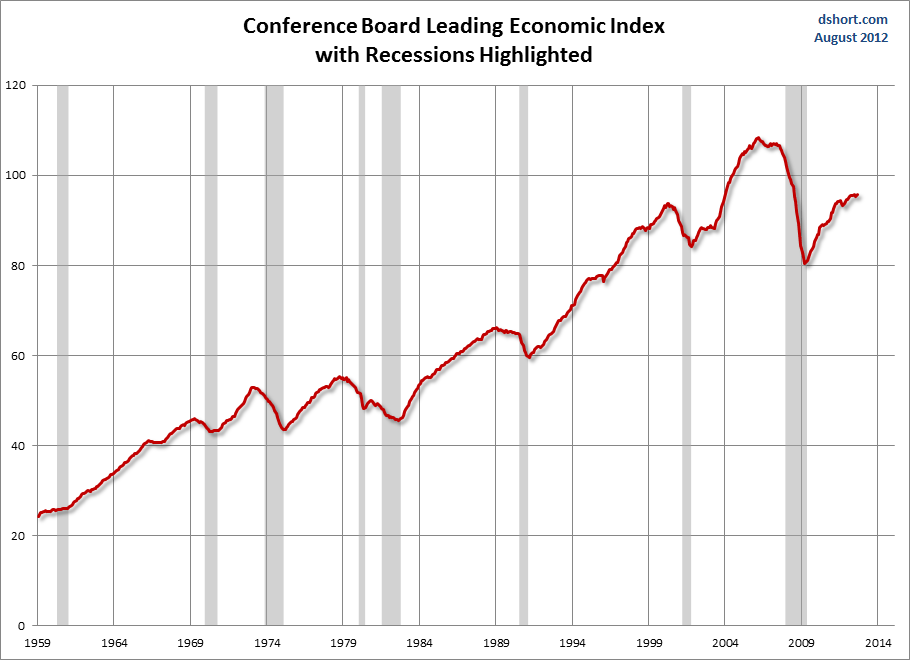
As per the August 17 release, the LEI was at 95.8 and the CEI was at 105.1 in July.
An excerpt from the August 17 release:
Says Ken Goldstein, economist at The Conference Board: “The indicators point to slow growth through the end of 2012. Lack of domestic demand remains a big issue. However, back-to-school sales are better than expected, suggesting that the consumer is starting to come back. Retail sales this time of year are often an indicator of how the holiday season will turn out.”
Here is a chart of the LEI from Doug Short’s blog post of August 17, titled “Conference Board Leading Economic Index: Slow Growth Through the End of 2012” :
_________
I post various indicators and indices because I believe they should be carefully monitored. However, as those familiar with this blog are aware, I do not necessarily agree with what they depict or imply.
_____
The Special Note summarizes my overall thoughts about our economic situation
SPX at 1418.13 as this post is written


No comments:
Post a Comment