Here are three charts from the St. Louis Fed depicting the velocity of money in terms of the MZM, M1 and M2 money supply measures.
All charts reflect quarterly data through the fourth quarter of 2012, and were last updated as of January 30, 2013. As one can see, two of the three measures are at all-time lows for the periods measured:
Velocity of MZM Money Stock, current value = 1.387 :
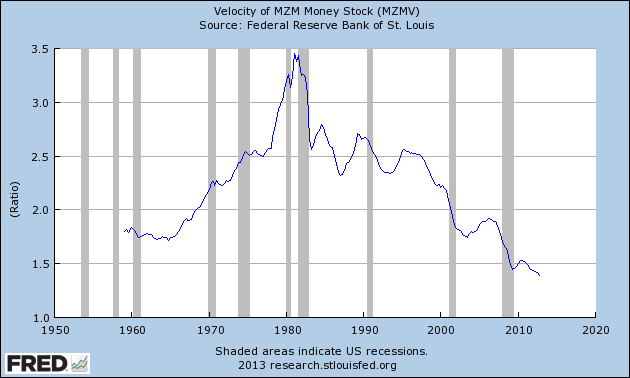
-
Velocity of M1 Money Stock, current value = 6.538 :
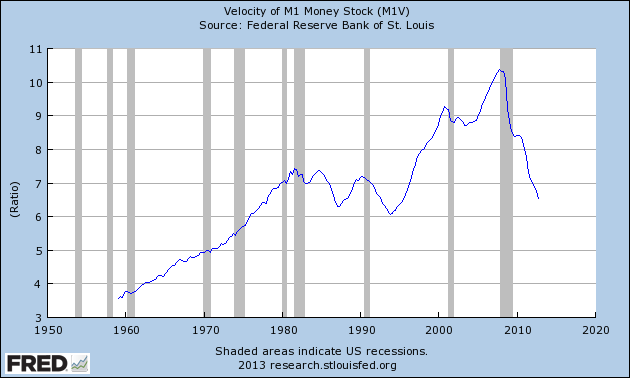
-
Velocity of M2 Money Stock, current value = 1.535 :
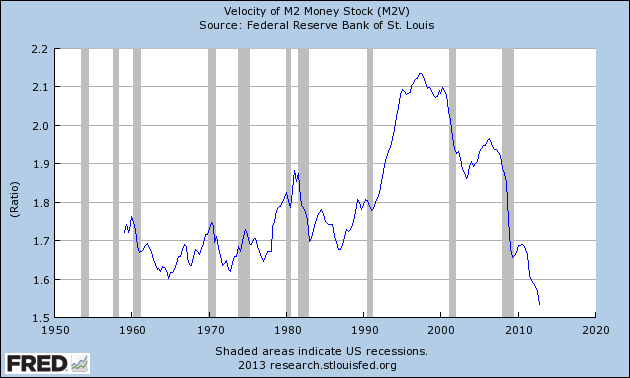
_____
The Special Note summarizes my overall thoughts about our economic situation
SPX at 1502.32 as this post is written
So where does the phantom debt under the surface of the water and the massive print job underway in everyones dollars to service it get factored into the equation?
ReplyDeleteI think what we have is a very difficult problem of massive off the radar debt and not enough printing presses employed to keep up with the debt service required to service something in the neighborhood of 600 trillion in unfunded promisery obligations, are we stuck in a real tight deflationary spot or what?