Many people place emphasis on Durable Goods New Orders as a prominent economic indicator and/or leading economic indicator.
For reference, below are charts depicting this measure.
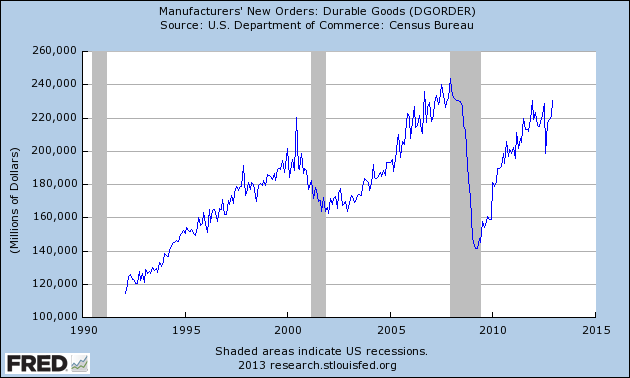
First, from the St. Louis Fed site (FRED), a chart through December, last updated on January 28. This value is 230,742 ($ Millions) :
(click on charts to enlarge images)
-
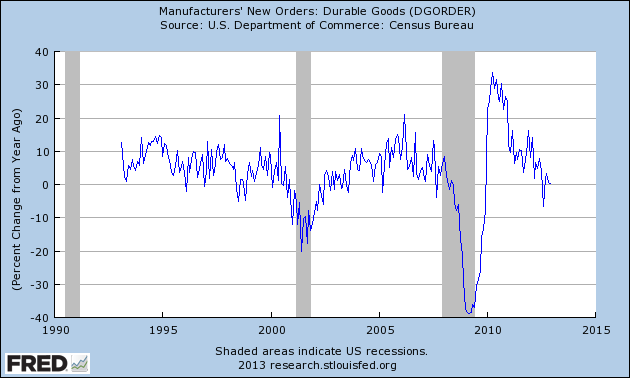
Here is the chart depicting this measure on a “Percentage Change from a Year Ago” basis:
_________
I post various indicators and indices because I believe they should be carefully monitored. However, as those familiar with this blog are aware, I do not necessarily agree with what they depict or imply.
_____
The Special Note summarizes my overall thoughts about our economic situation
SPX at 1499.84 as this post is written
No comments:
Post a Comment