Here is an update on various indicators that are supposed to predict and/or depict economic activity. These indicators have been discussed in previous blog posts:
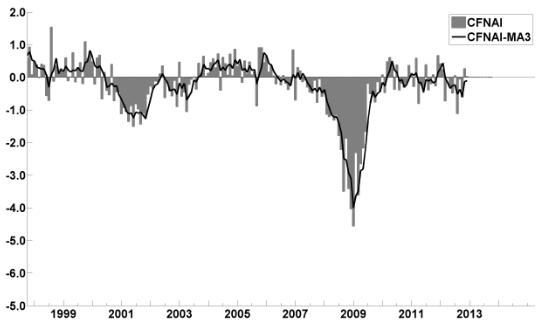
The January Chicago Fed National Activity Index (CFNAI)(pdf) updated as of January 22, 2013:
-
As of 1/18/13 (incorporating data through 1/11/13) the WLI was at 130.4 and the WLI, Gr. was at 6.1%.
A chart of the WLI, Gr. since 2000, from Doug Short’s blog of January 18 titled “ECRI's Public Indicators Continue to Undermine Their Insistence That We're in a Recession” :
-
Here is the latest chart, depicting 1-12-11 to 1-12-13:
-
As per the December 20 press release, the LEI was at 95.8 and the CEI was at 104.9 in November.
An excerpt from the December 20 release:
Says Ken Goldstein, economist at The Conference Board: “The indicators reflect an economy that remains weak in the face of strong domestic and international headwinds, as it faces a looming fiscal cliff. Growth will likely be slow through the early months of 2013.”
Here is a chart of the LEI from Doug Short’s blog post of December 20 titled “Conference Board Leading Economic Index: Six-Month Growth at Zero” :
_________
I post various indicators and indices because I believe they should be carefully monitored. However, as those familiar with this blog are aware, I do not necessarily agree with what they depict or imply.
_____
The Special Note summarizes my overall thoughts about our economic situation
SPX at 1493.53 as this post is written


No comments:
Post a Comment