I often write about interest rates and related topics as my analyses indicates that the overall bond market is an exceedingly large asset bubble.
The characteristics and price levels of corporate bonds is highly noteworthy.
For reference purposes, here are three bond indices and their FRED charts, as well as depictions of their spreads (as seen in OASs) :
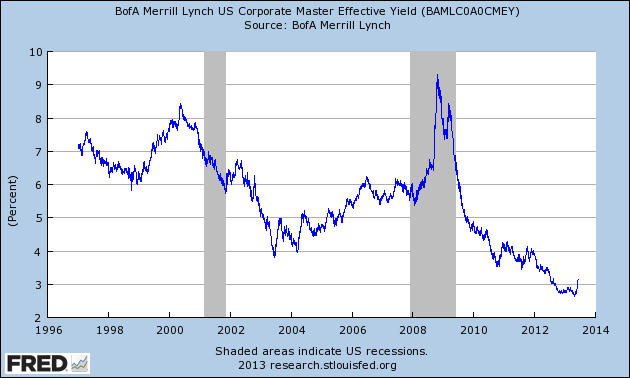
The BofA Merrill Lynch US Corporate Master Index
An excerpt from the FRED description of the BofA Merrill Lynch US Corporate Master Index :
This data represents the effective yield of the BofA Merrill Lynch US Corporate Master Index, which tracks the performance of US dollar denominated investment grade rated corporate debt publically issued in the US domestic market.
A chart of the BofA Merrill Lynch US Corporate Master Index, with an effective yield of 3.15% as of June 11, 2013:
(click on chart to enlarge images)(chart updated as of 6-12-13)
-
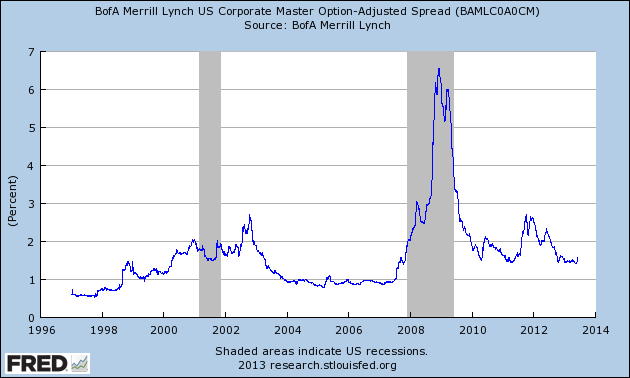
The BofA Merrill Lynch US Corporate Master Index Option-Adjusted Spread (OAS)
An excerpt from the FRED description of the BofA Merrill Lynch US Corporate Master Index Option-Adjusted Spread (OAS):
The BofA Merrill Lynch Option-Adjusted Spreads (OASs) are the calculated spreads between a computed OAS index of all bonds in a given rating category and a spot Treasury curve. An OAS index is constructed using each constituent bond’s OAS, weighted by market capitalization. The Corporate Master OAS uses an index of bonds that are considered investment grade (those rated BBB or better).
A chart of the The BofA Merrill Lynch US Corporate Master Index Option-Adjusted Spread (OAS), with a value of 1.58% as of June 11, 2013:
(click on chart to enlarge image)(chart updated as of 6-12-13)
-
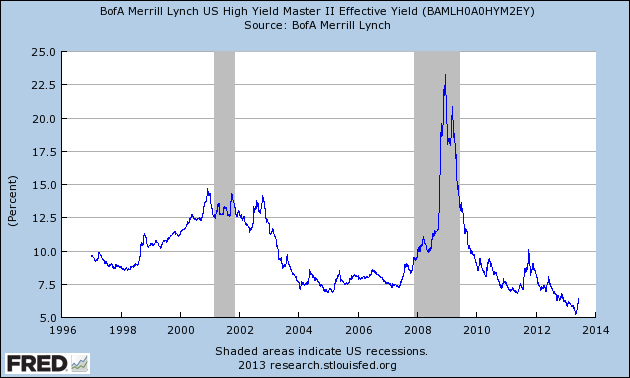
The BofA Merrill Lynch US High Yield Master II Index
An excerpt from the FRED description of the BofA Merrill Lynch US High Yield Master II Index:
This data represents the effective yield of the BofA Merrill Lynch US High Yield Master II Index, which tracks the performance of US dollar denominated below investment grade rated corporate debt publically issued in the US domestic market.
A chart of the The BofA Merrill Lynch US High Yield Master II Index, with an effective yield of 6.44% as of June 11, 2013:
(click on chart to enlarge image)(chart updated as of 6-12-13)
-
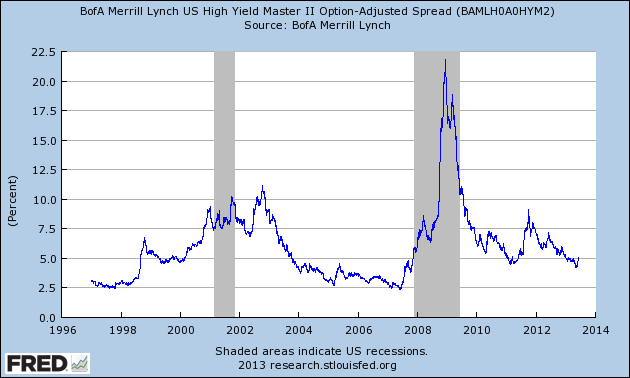
The BofA Merrill Lynch High Yield Master II Option-Adjusted Spread (OAS)
An excerpt from the FRED description of the BofA Merrill Lynch High Yield Master II Option-Adjusted Spread (OAS) :
The BofA Merrill Lynch Option-Adjusted Spreads (OASs) are the calculated spreads between a computed OAS index of all bonds in a given rating category and a spot Treasury curve. An OAS index is constructed using each constituent bond’s OAS, weighted by market capitalization. The BofA Merrill Lynch High Yield Master II OAS uses an index of bonds that are below investment grade (those rated BB or below).
A chart of the BofA Merrill Lynch High Yield Master II Option-Adjusted Spread (OAS), with a value of 5.08 percent as of June 11, 2013:
(click on chart to enlarge image)(chart updated as of 6-12-13)
-
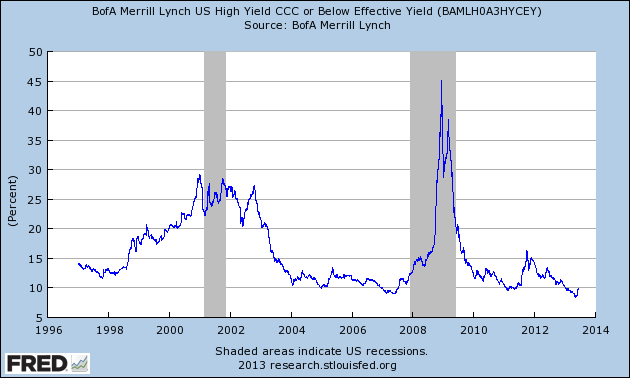
The BofA Merrill Lynch US High Yield CCC or Below Effective Yield
An excerpt from the FRED description of The BofA Merrill Lynch US High Yield CCC or Below Effective Yield :
This data represents the effective yield of the BofA Merrill Lynch US Corporate C Index, a subset of the BofA Merrill Lynch US High Yield Master II Index tracking the performance of US dollar denominated below investment grade rated corporate debt publically issued in the US domestic market. This subset includes all securities with a given investment grade rating CCC or below.
A chart of The BofA Merrill Lynch US High Yield CCC or Below Effective Yield, with an effective yield of 9.94% as of June 11, 2013:
(click on chart to enlarge image)(chart updated as of 6-12-13)
-
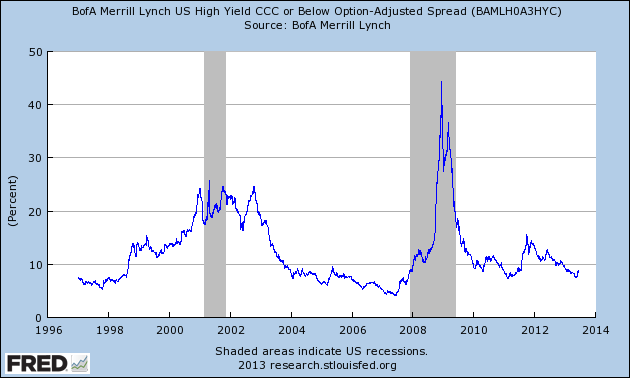
The BofA Merrill Lynch High Yield CCC or Below Option-Adjusted Spread (OAS)
An excerpt from the FRED description of The BofA Merrill Lynch High Yield CCC or Below Option-Adjusted Spread (OAS):
This data represents the Option-Adjusted Spread (OAS) of the BofA Merrill Lynch US Corporate C Index, a subset of the BofA Merrill Lynch US High Yield Master II Index tracking the performance of US dollar denominated below investment grade rated corporate debt publically issued in the US domestic market. This subset includes all securities with a given investment grade rating CCC or below.
A chart of The BofA Merrill Lynch High Yield CCC or Below Option-Adjusted Spread (OAS), with a value of 8.75 percent as of June 11, 2013:
(click on chart to enlarge image)(chart updated as of 6-12-13)
_____
The Special Note summarizes my overall thoughts about our economic situation
SPX at 1612.52 as this post is written
No comments:
Post a Comment