As I stated in my July 12, 2010 post (“ECRI WLI Growth History“):
For a variety of reasons, I am not as enamored with ECRI’s WLI and WLI Growth measures as many are.However, I do think the measures are important and deserve close monitoring and scrutiny.
The movement of the ECRI WLI and WLI, Gr. is particularly notable at this time, as ECRI publicly announced on September 30, 2011 that the U.S. was “tipping into recession,” and ECRI has reiterated the view that the U.S. economy is currently in a recession, seen most recently in these twelve sources :
- FOX Business video, January 22, 2014, “Secular Stagnation“
- BNN video, January 15, 2014, “Cyclical & Secular Outlook“
- CNBC interview, January 14, 2014, “Cyclical Outlook“
- BNN video, November 14, 2013, “Fed Policy & the Business Cycle“
- Bloomberg video, November 4, 2013, “Major Central Bank Actions in Line with ECRI“
- Bloomberg video, July 30, 2013, “U.S. Recession Began in 2012, ECRI’s Achuthan Says“
- ECRI, July 30, 2013, “Becoming Japan“
- ECRI, May 31, 2013, “What Wealth Effect?“
- ECRI, April 26, 2013, “Nominal GDP Growth Falls Again“
- ECRI, April 7, 2013, “Interview on Jobs & Recession” video
- ECRI, March 8, 2013, Interview Summary (provides links to 3 video interviews)
- ECRI, March 5, 2013, “Recession in the Yo-Yo Years“ (provides a link to a 17-page ECRI report dated March 2013 titled “The U.S. Business Cycle in the Context of the Yo-Yo Years”)
Other past notable year 2012 reaffirmations of the September 30, 2011 recession call by ECRI were seen (in chronological order) on March 15 (“Why Our Recession Call Stands”) as well as various interviews and statements the week of May 6, including:
- Bloomberg video, May 9, 2012: ”Lakshman Achuthan on Renewed U.S. Recession Call: Video“
- ECRI, May 9, 2012: ”Revoking Recession: 48th Time’s The Charm?”
- Wall Street Journal video, May 9, 2012: “Free Market Economies Have Business Cycles”
- ECRI, May 11, 2012: “Rising GDP Doesn’t Rule Out Recession”
Also, subsequent to May 2012:
- Bloomberg video, July 10, 2012: “Recession Here”
- ECRI, September 7, 2012: “Recession Evidence Obscured in Real Time”
- ECRI, September 13, 2012: “The 2012 Recession: Are We There Yet?”
- Bloomberg video, September 13, 2012: “Recession Update.”
- CNN video, November 29, 2012: “Official Recession Indicators“
- CNN video, November 29, 2012: “ECRI Recession Update“
- Yahoo video, November 29, 2012: “Ignore GDP and the Fiscal Cliff, U.S. Is Already in Recession“
- Bloomberg video, November 29, 2012: “Recession Underway“
- CNBC video, December 7, 2012: “Definitional Recession Indicators“
- ECRI, December 7, 2012: “The Tell-Tale Chart” including this excerpt: “Reviewing the indicators used to officially decide U.S. recession dates, it looks like the recession began around July 2012.”
__
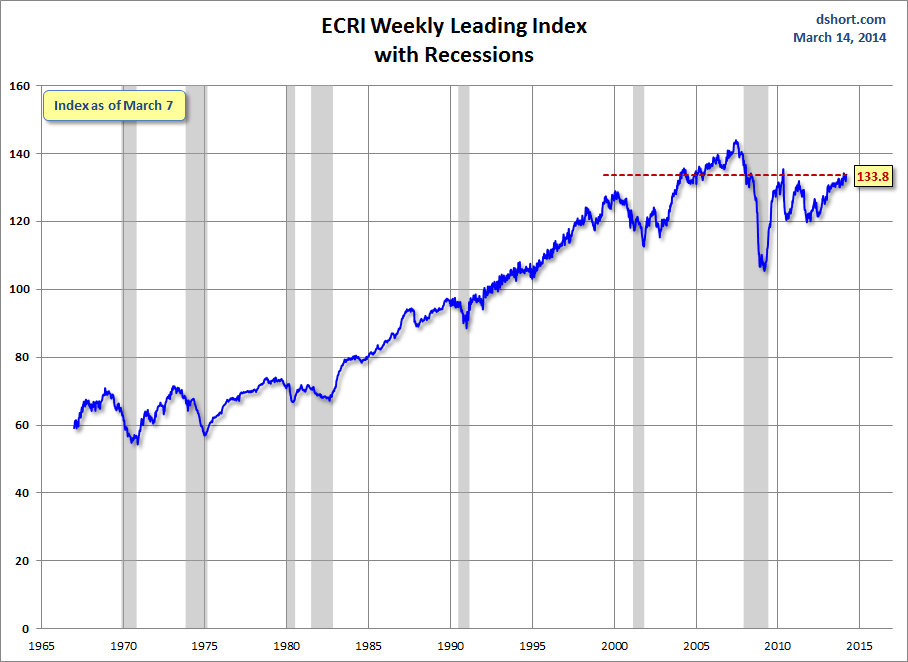
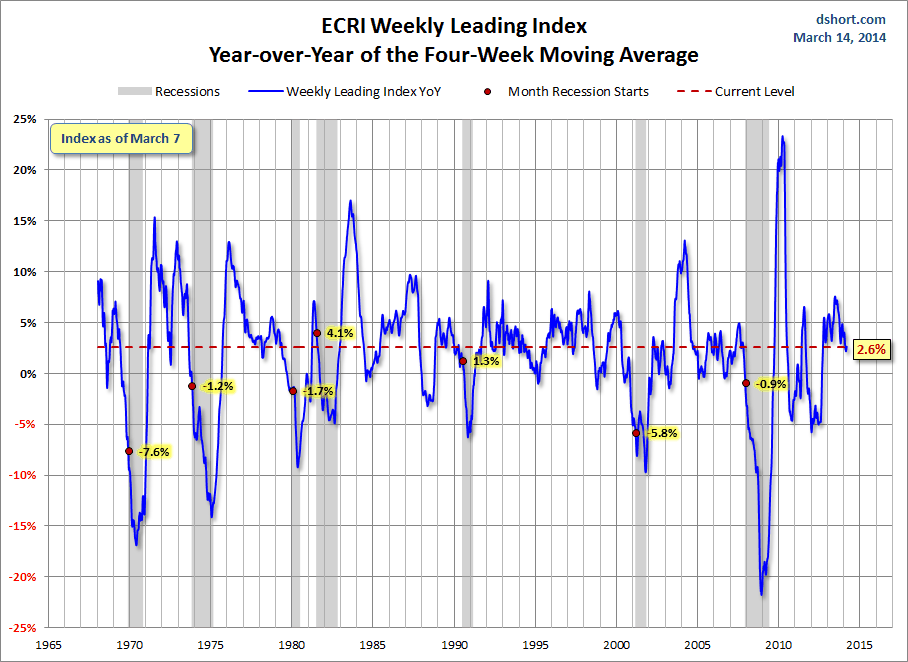
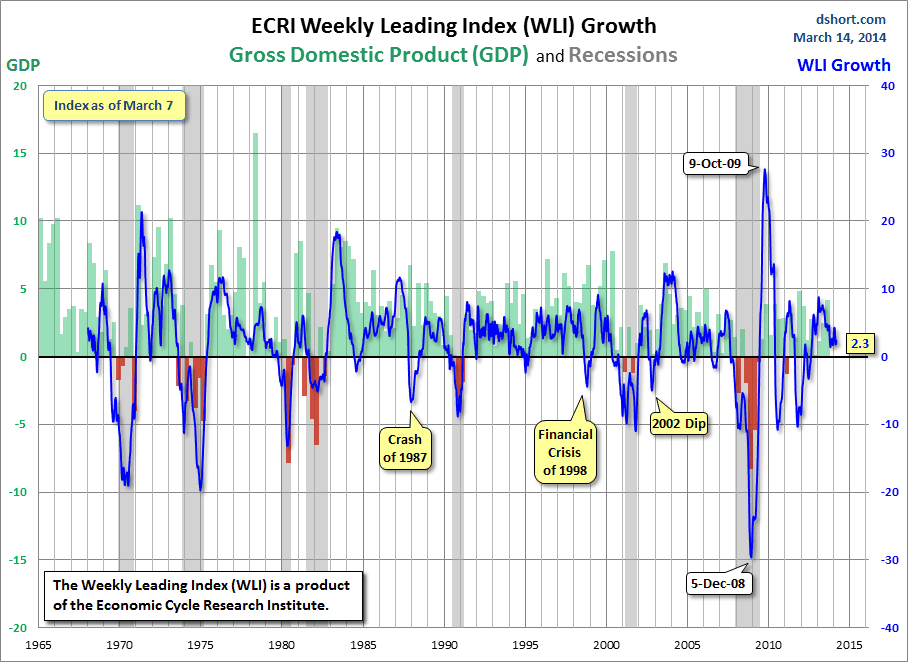
Below are three long-term charts, from Doug Short’s blog post of March 14, 2014 titled “ECRI Recession Watch: Weekly Update.” These charts are on a weekly basis through the March 14 release, indicating data through March 7, 2014.
Here is the ECRI WLI (defined at ECRI’s glossary):
-
This next chart depicts, on a long-term basis, the Year-over-Year change in the 4-week moving average of the WLI:
-
This last chart depicts, on a long-term basis, the WLI, Gr.:
_________
I post various economic indicators and indices because I believe they should be carefully monitored. However, as those familiar with this blog are aware, I do not necessarily agree with what they depict or imply.
_____
The Special Note summarizes my overall thoughts about our economic situation
SPX at 1842.15 as this post is written


No comments:
Post a Comment