In the last post (“Total Household Net Worth As A Percent Of GDP 1Q 2015“) I displayed a long-term chart depicting Total Household Net Worth as a percentage of GDP.
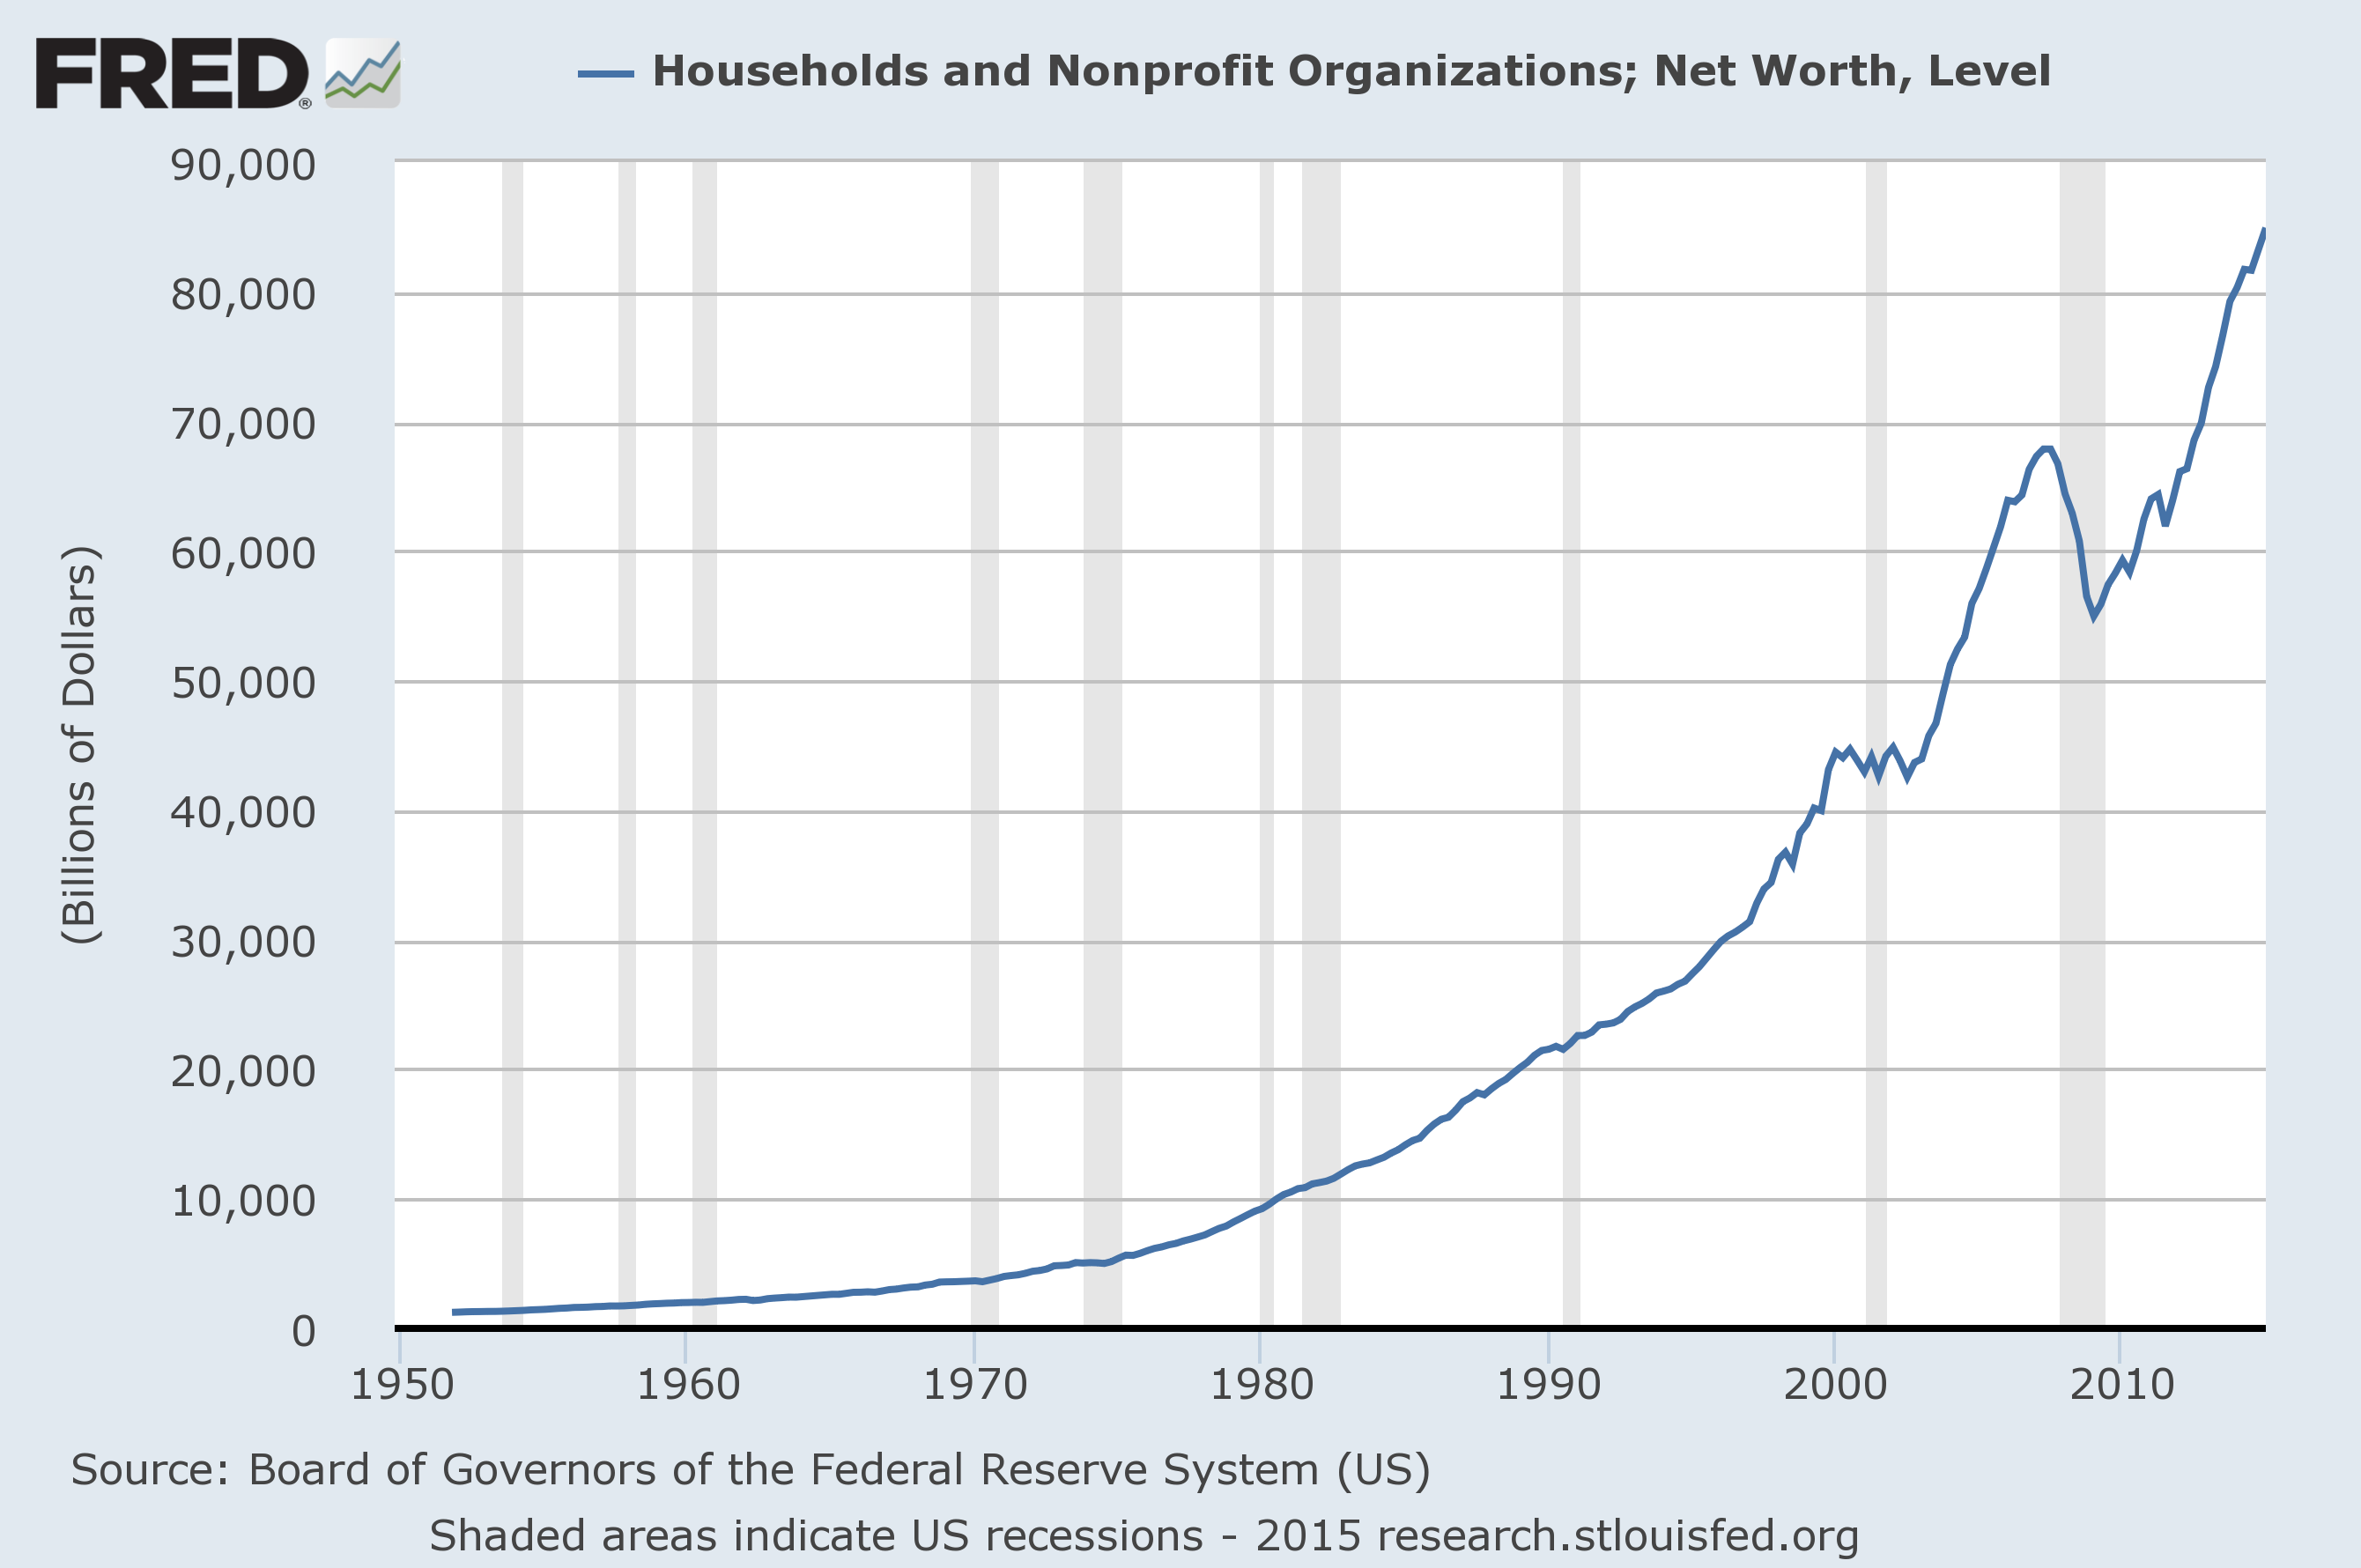
For reference purposes, here is Total Household Net Worth from a long-term perspective (from 1949:Q4 to 2015:Q1). The last value (as of June 11, 2015) is $84.92465 Trillion:
(click on each chart to enlarge image)
–
Also of interest is the same metric presented on a “Percent Change from a Year Ago” basis:
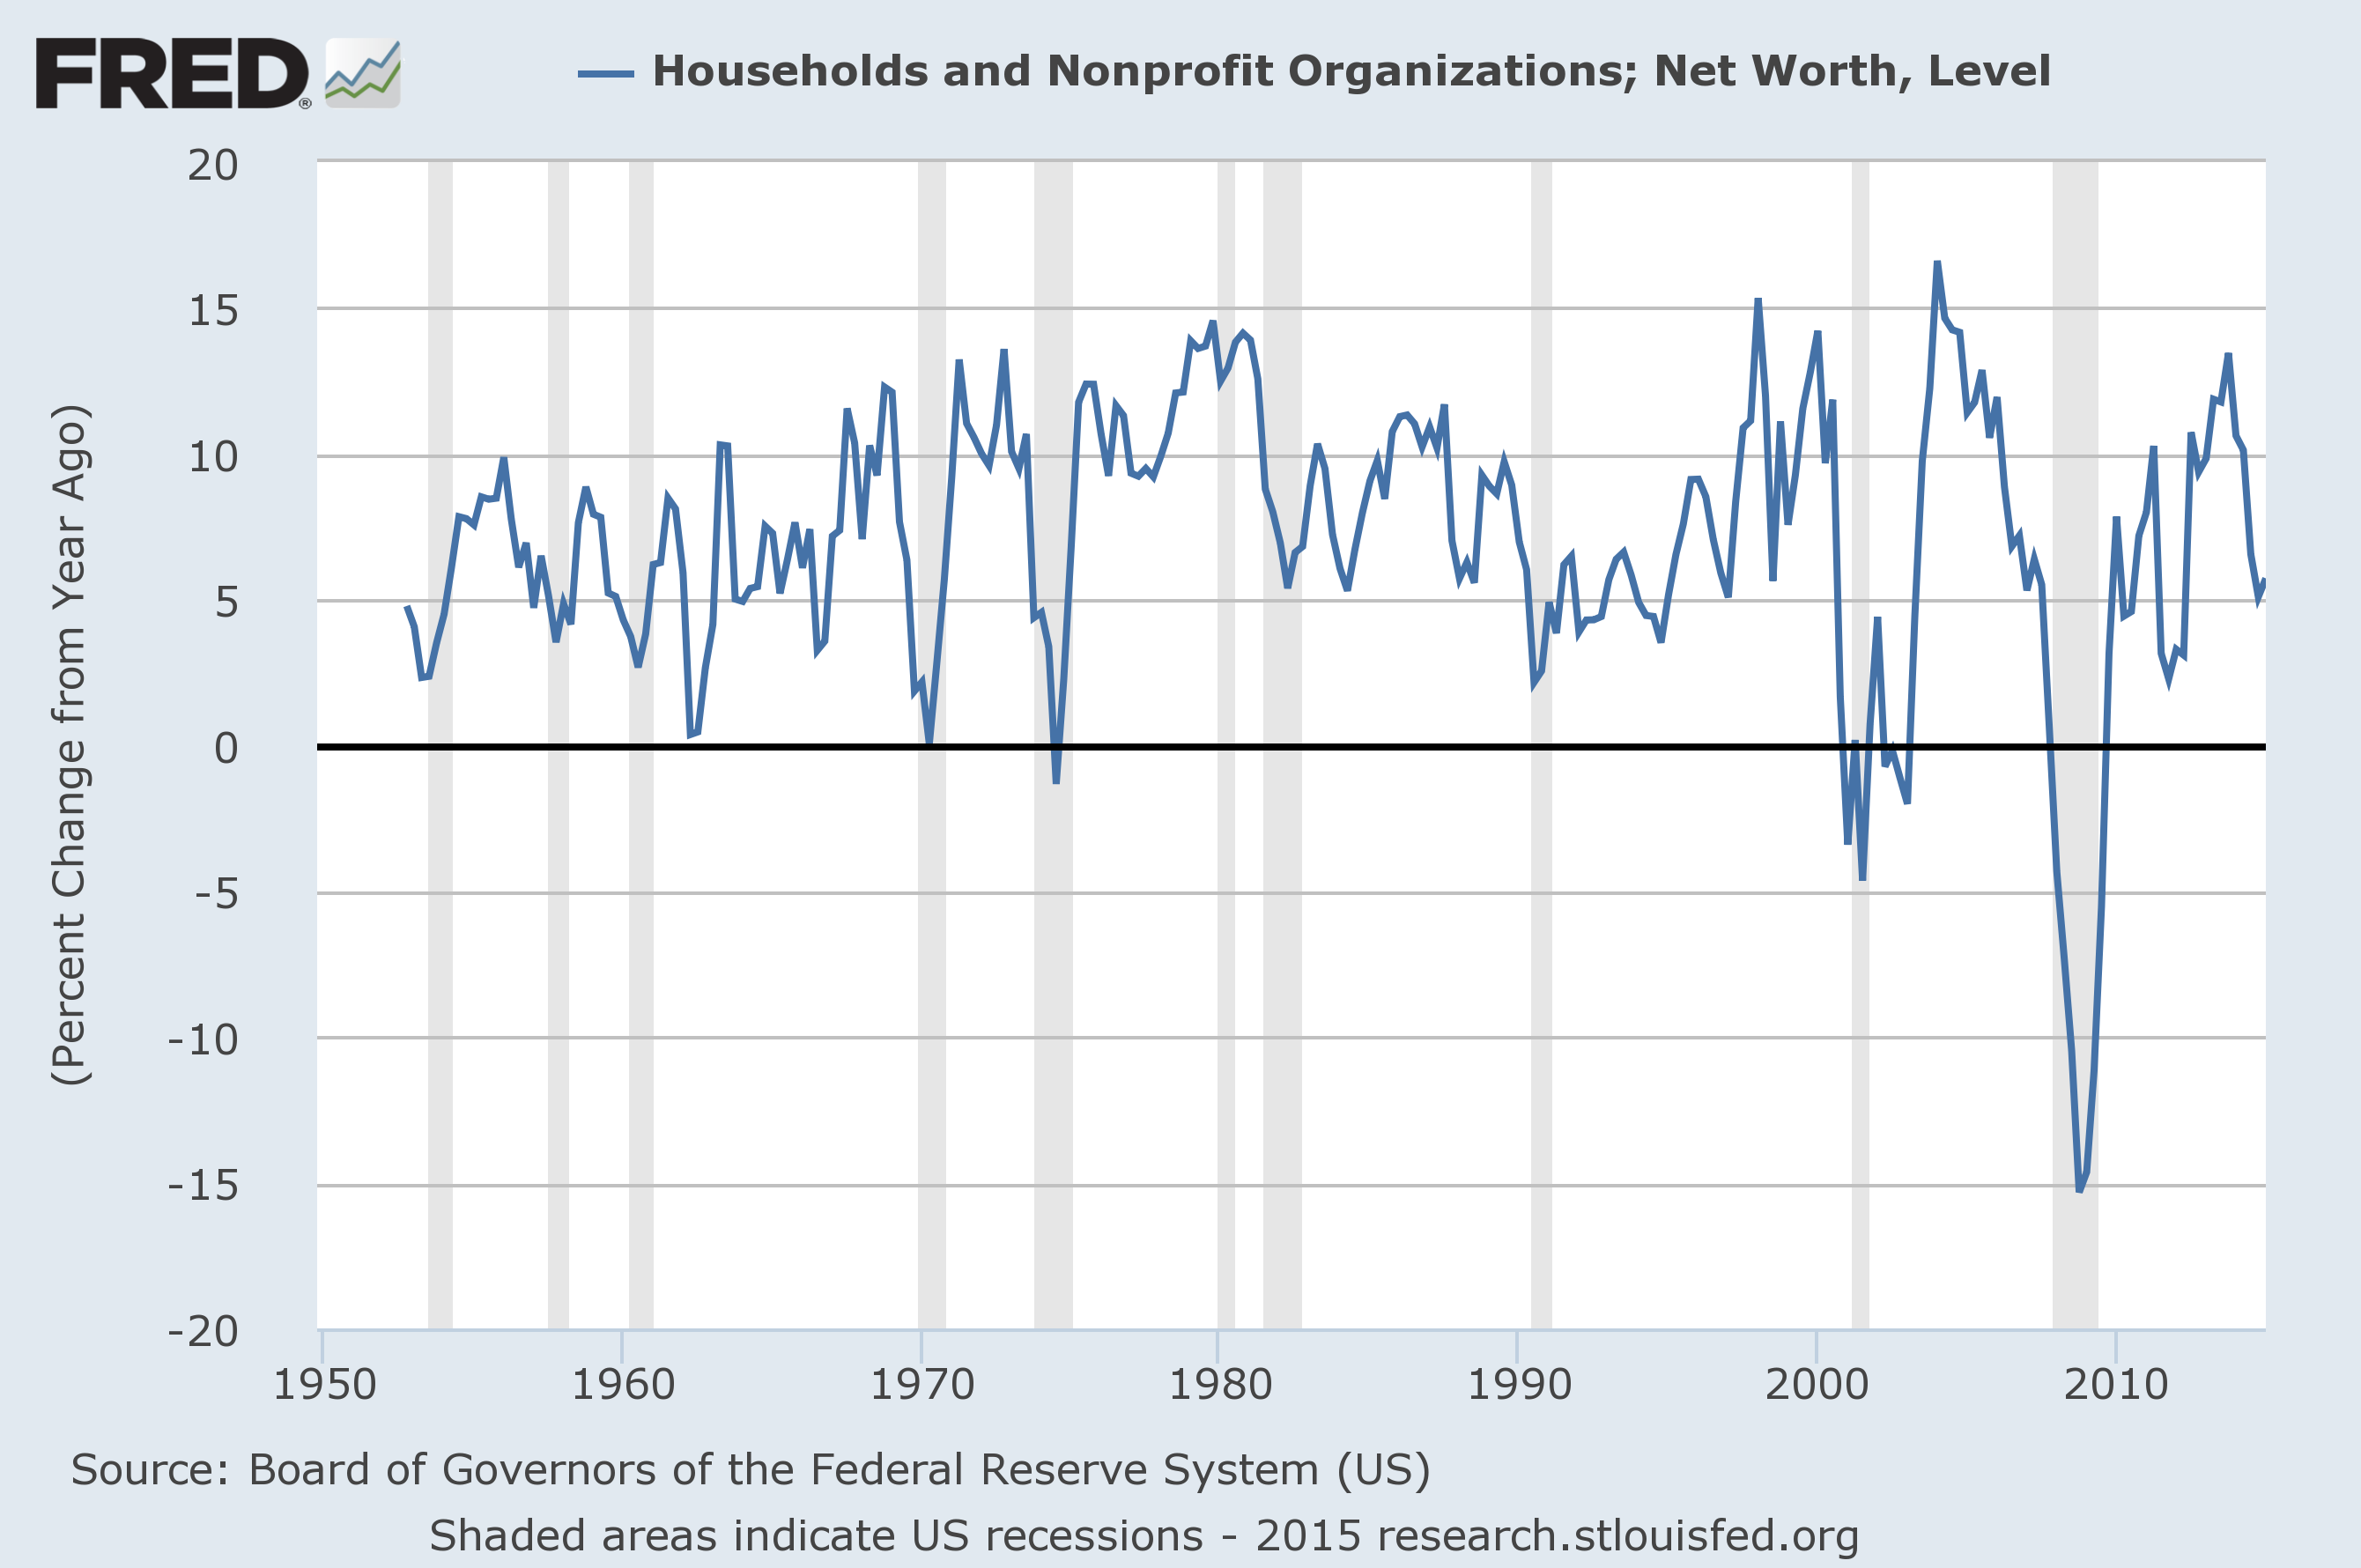
Data Source: FRED, Federal Reserve Economic Data, Board of Governors of the Federal Reserve System; accessed June 11, 2015:
_____
The Special Note summarizes my overall thoughts about our economic situation
SPX at 2108.86 as this post is written
No comments:
Post a Comment