While there are various similarities between the economic situation of 2008 and 2015, there are also many notable differences.
A comprehensive comparison would be extensively lengthy and would contain many complex aspects. As such, no short discussion can even begin to be a comprehensive discussion of the economic and financial similarities and differences of the two periods. However, in this post I would like to highlight various notable "high-level" aspects, and, for purposes of brevity, provide links to further relevant commentary.
Of course, latter-2008 was the beginning of the Financial Crisis, so this comparison will focus on 2008 prior to the Financial Crisis. As well, although this comparison is between 2008 and 2015, there are also notable similarities between 2015, 1987 and 1929.
Stocks
Both the stock markets of 2008 and 2015 had experienced multi-year bull markets. Both years had considerable price volatility:
(click on chart to enlarge images)(chart courtesy of StockCharts.com)
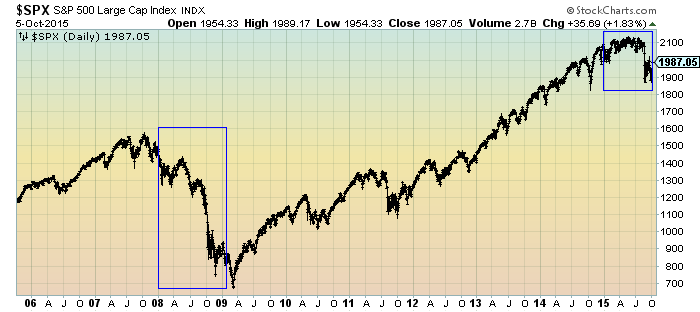
A critical question is what is the current level of stock market valuations. There are many different opinions regarding the current valuation levels of the stock market in general, with some believing the stock market's valuation is well-supported by earnings, while others think the stock market is in a bubble.
I continue to believe, as stated in numerous stock market posts, that the stock market is but one asset class of many that are experiencing exceedingly immense bubbles.
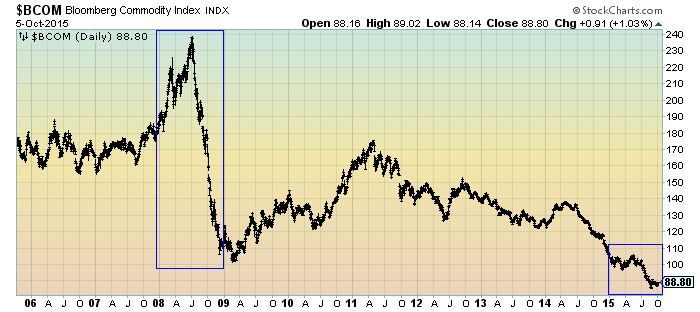
Commodity Weakness
Commodity weakness was a central theme in 2008, and certainly has been in 2015. This is seen in the chart below, using the Bloomberg Commodity Index as a proxy:
(click on chart to enlarge images)(chart courtesy of StockCharts.com)
Fed Funds Rate
There are many differences between 2008 and 2015 regarding monetary policy and its various measures. Of course, one major difference is the Fed Funds rate, which has been near zero since December 2008. This contrasts greatly with 2008 as well as previous longer-term history:
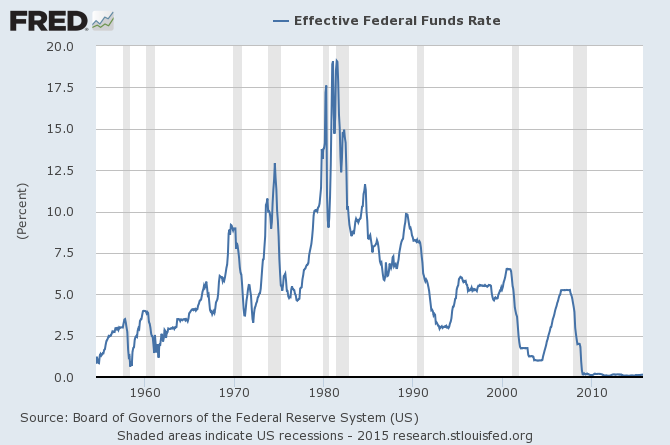
Board of Governors of the Federal Reserve System (US), Effective Federal Funds Rate[FEDFUNDS], retrieved from FRED, Federal Reserve Bank of St. Louis https://research.stlouisfed.org/fred2/series/FEDFUNDS/, October 5, 2015.
Other Interest Rates
There are many differences between 2008 and 2015 regarding interest rates, as seen in various measures. From an economic perspective, there is great significance in the current (ongoing) level of (ultra) low interest rates.
For reference, the 10 Year Treasury Note Yield is used as a proxy:
(click on chart to enlarge images)(chart courtesy of StockCharts.com)
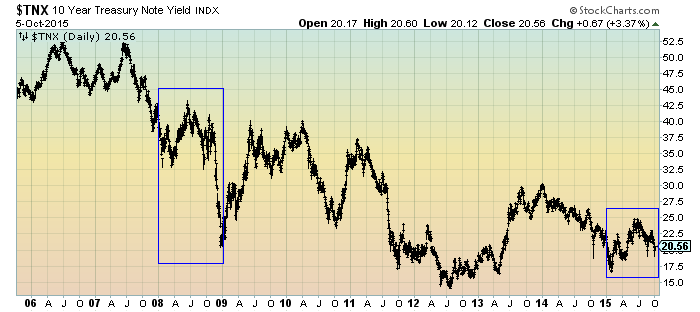
I continue to believe, as discussed in various posts concerning the bond market bubble, that interest rates will increase substantially as the bond bubble bursts/deflates.
Inflation
Inflation, as measured by the CPI and PCE Price Index (as well as variants) differs considerably between the 2008 and 2015 time periods. Inflation was a significant concern in 2008, whereas in 2015 "too-low inflation" remains a significant factor. In fact, the shortfall between the Federal Reserve’s stated inflation target (2% on the PCE Price Index) and the actual inflation reading continues. This 2% inflation target has been “missed” (inflation has been less than 2%) for well over three years.
Inflation, as measured by the PCE Price Index, is seen in the chart below, from Doug Short's post of September 28, 2015, titled "The PCE Price Index Remain Below Target":

In 2015, there have been significant "deflationary pressures" that have manifested in many different areas. I have written extensively concerning these "deflationary pressures" and my expectations of an impending prolonged U.S. deflation that will both accompany as well as cause substantial economic difficulties.
Levels Of Economic Activity
There are similarities in various aspects of economic activity in 2008 (through roughly August) and 2015. In 2008, there was continued debate throughout the summer as to whether the economy was headed into a recession. As of September 26, 2008, (then-stated) GDP for the first quarter of 2008 stood at .9%, and GDP for the second quarter stood at 2.8%. [As of this writing, those figures have been revised to -2.7% and 2.0%, respectively. Third quarter 2008 GDP currently stands at -1.9%.]
As of now in 2015, the overwhelming consensus among professional economic forecasters is for slow but steady growth, with the odds of recession seen as low, if not very much so.
However, despite this widespread consensus that the U.S. economy is “advancing” - and some believe to be “strong” - my analyses indicates that the economy continues to have many problematical areas of weakness and the widespread consensus concerning current economic vitality is (substantially) incorrect. While perhaps the strongest indication of significant economic growth is seen in the 2nd quarter 2015 GDP figure (third estimate) of 3.9%, this figure seems (very) high in relation to other various economic measures, some of which show (very) weak growth if not outright contraction. While the list of such measures is extensive, one such broad group of measures is seen in the Federal Reserve's regional economic surveys. A chart, from Doug Short's post of September 28, 2015, titled "Regional Fed Manufacturing Overview: September" shows these various readings since 2001:

Unemployment
Heading into the fall of 2008, unemployment was relatively low. In 2015, the official unemployment rate is also low, currently seen as 5.1%:
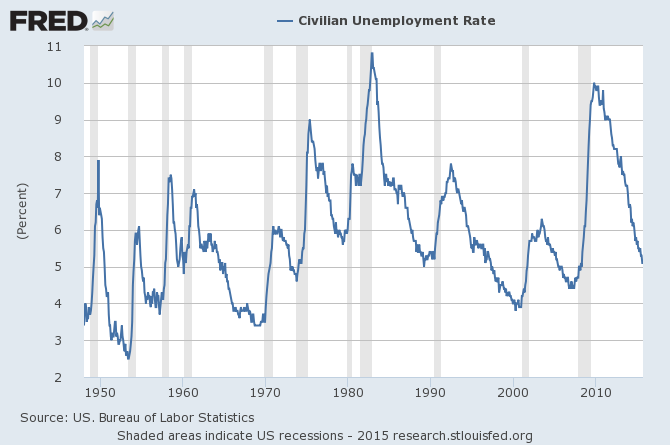
US. Bureau of Labor Statistics, Civilian Unemployment Rate [UNRATE], retrieved from FRED, Federal Reserve Bank of St. Louis https://research.stlouisfed.org/fred2/series/UNRATE/, October 5, 2015.
There has been widespread economic commentary concerning the low levels of unemployment. However, is this an accurate depiction of the underlying unemployment condition? While the subject is complex, my analyses indicate - contrary to widespread economic commentary - that many aspects (including its level) of actual unemployment are very problematical, and that future unemployment is even more problematical.
Credit Spreads
One problematical issue leading into and throughout 2008 was the widening of credit spreads and other related measures of financial stress. In 2015, there has been an increase in various measures depicting credit spreads and related financial stress. One well-known spread measure is the spread between Moody's Seasoned Baa Corporate Bond and the 10-Year Treasury Constant Maturity, as depicted below:
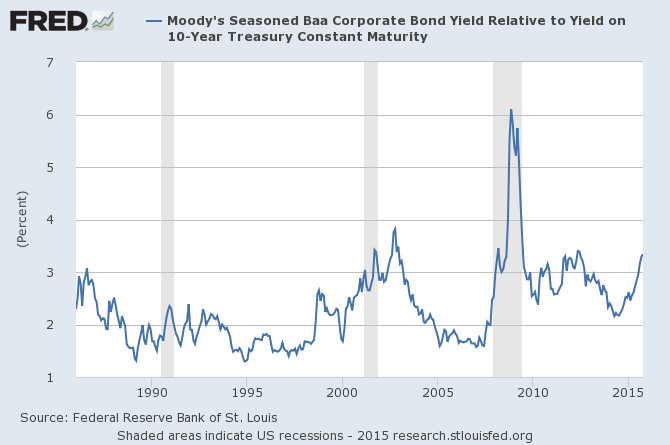
Federal Reserve Bank of St. Louis, Moody's Seasoned Baa Corporate Bond Yield Relative to Yield on 10-Year Treasury Constant Maturity [BAA10Y], retrieved from FRED, Federal Reserve Bank of St. Louis https://research.stlouisfed.org/fred2/series/BAA10Y/, October 5, 2015.
Banks
Problems in various banks and other financial institutions were rampant leading into and throughout 2008, and many believe that these problems "caused" the upheaval that became know as "The Financial Crisis." Many of the problematical issues were well-publicized at the time. Bank stocks were under substantial pressure prior to and throughout 2008.
In contrast, in 2015 there seems to be little, if any, ostensible problems in the banking/financial sector. Certainly any media coverage regarding such has been almost nonexistent.
In the chart below, financial stocks are depicted by the XLF in the top plot. In the lower plot, one can see the XLF relative to the S&P 500:
(click on charts to enlarge images)(chart courtesy of StockCharts.com)
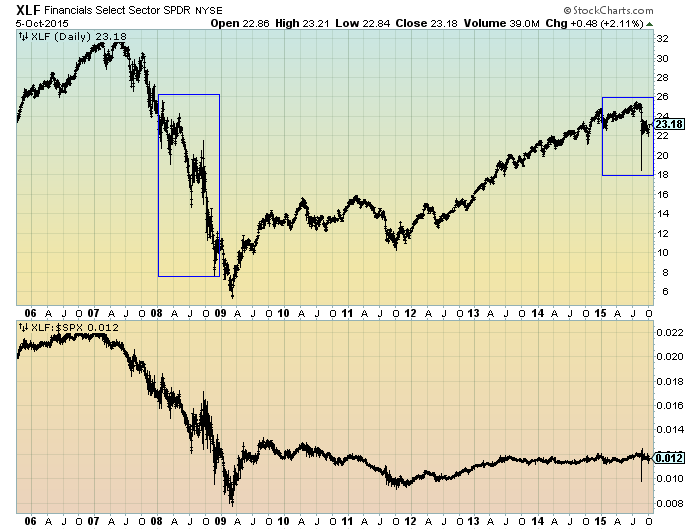
However, the question remains whether banks are as "healthy" as purported; as well, a tangential issue is whether the bank "stress tests" are an accurate predictor of how well banks will fare in a (substantial) economic downturn.
Financial System And Economic Risk
A critical question is whether overall financial and economic risk has been substantially reduced following the Financial Crisis? Based on very little widespread commentary in 2015 regarding a heightened level of U.S. financial risk, ostensibly overall U.S. financial risk would seem low. Relatively low (although recently rising) levels of stress is seen in the the St. Louis Fed Financial Stress Index (STLFSI) as well as other measures such as the Chicago Fed National Financial Conditions Index (NFCI) depicted below:
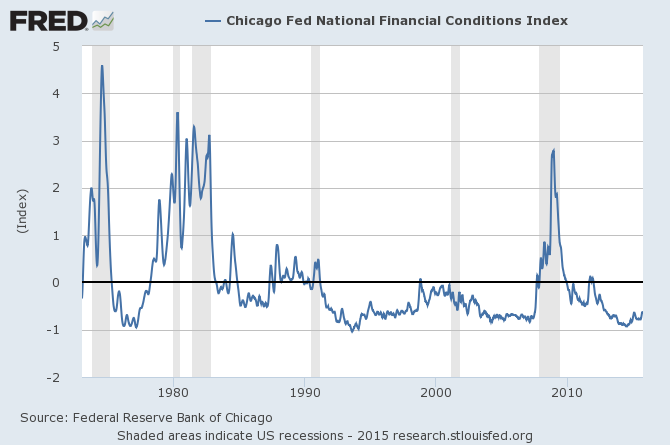
Federal Reserve Bank of St. Louis, St. Louis Fed Financial Stress Index© [STLFSI], retrieved from FRED, Federal Reserve Bank of St. Louis https://research.stlouisfed.org/fred2/series/STLFSI/, October 5, 2015.
Is this risk assessment accurate? While the subject is complex, my analyses indicate that the steps that have been taken to lessen risk in the economy and financial system will prove ineffectual relative to the problems - and vast peril - in the financial system. I have discussed this in various posts, including those featured in "The U.S. Economic Situation" updates.
_____
The Special Note summarizes my overall thoughts about our economic situation
SPX at 1987.05 as this post is written
No comments:
Post a Comment