While the concept of Americans’ incomes can be defined in a number of ways, many prominent measures continue to show disconcerting trends.
One prominent measure is the Employment Cost Index (ECI).
Here is a description from the BLS document titled “The Employment Cost Index: what is it?“:
The Employment Cost Index (ECI) is a quarterly measure of the change in the price of labor, defined as compensation per employee hour worked. Closely watched by many economists, the ECI is an indicator of cost pressures within companies that could lead to price inflation for finished goods and services. The index measures changes in the cost of compensation not only for wages and salaries, but also for an extensive list of benefits. As a fixed-weight, or Laspeyres, index, the ECI controls for changes occurring over time in the industrial-occupational composition of employment.
On October 30, 2015, the ECI for the third quarter was released. Here are two excerpts from the October 30, 2015 Wall Street Journal article titled “U.S. Employment Costs Rise .6%, Suggesting New Wage Pressure“:
Wages and salaries for civilian workers, which reflect more than two-thirds of employee costs, grew 0.6% in July through September, while benefits rose 0.5%.
also:
Compensation costs can ebb and flow from quarter to quarter. On an annual basis, wages and benefits are growing modestly. Total compensation grew 2% in the third quarter, compared with a year earlier. That was the same pace as in the spring.
Below are three charts, updated on October 30, 2015 that depict various aspects of the ECI.
The first depicts the ECI, with a value of 124.5:

US. Bureau of Labor Statistics, Employment Cost Index: Total compensation: All Civilian[ECIALLCIV], retrieved from FRED, Federal Reserve Bank of St. Louis: https://research.stlouisfed.org/fred2/series/ECIALLCIV/, October 30, 2015.
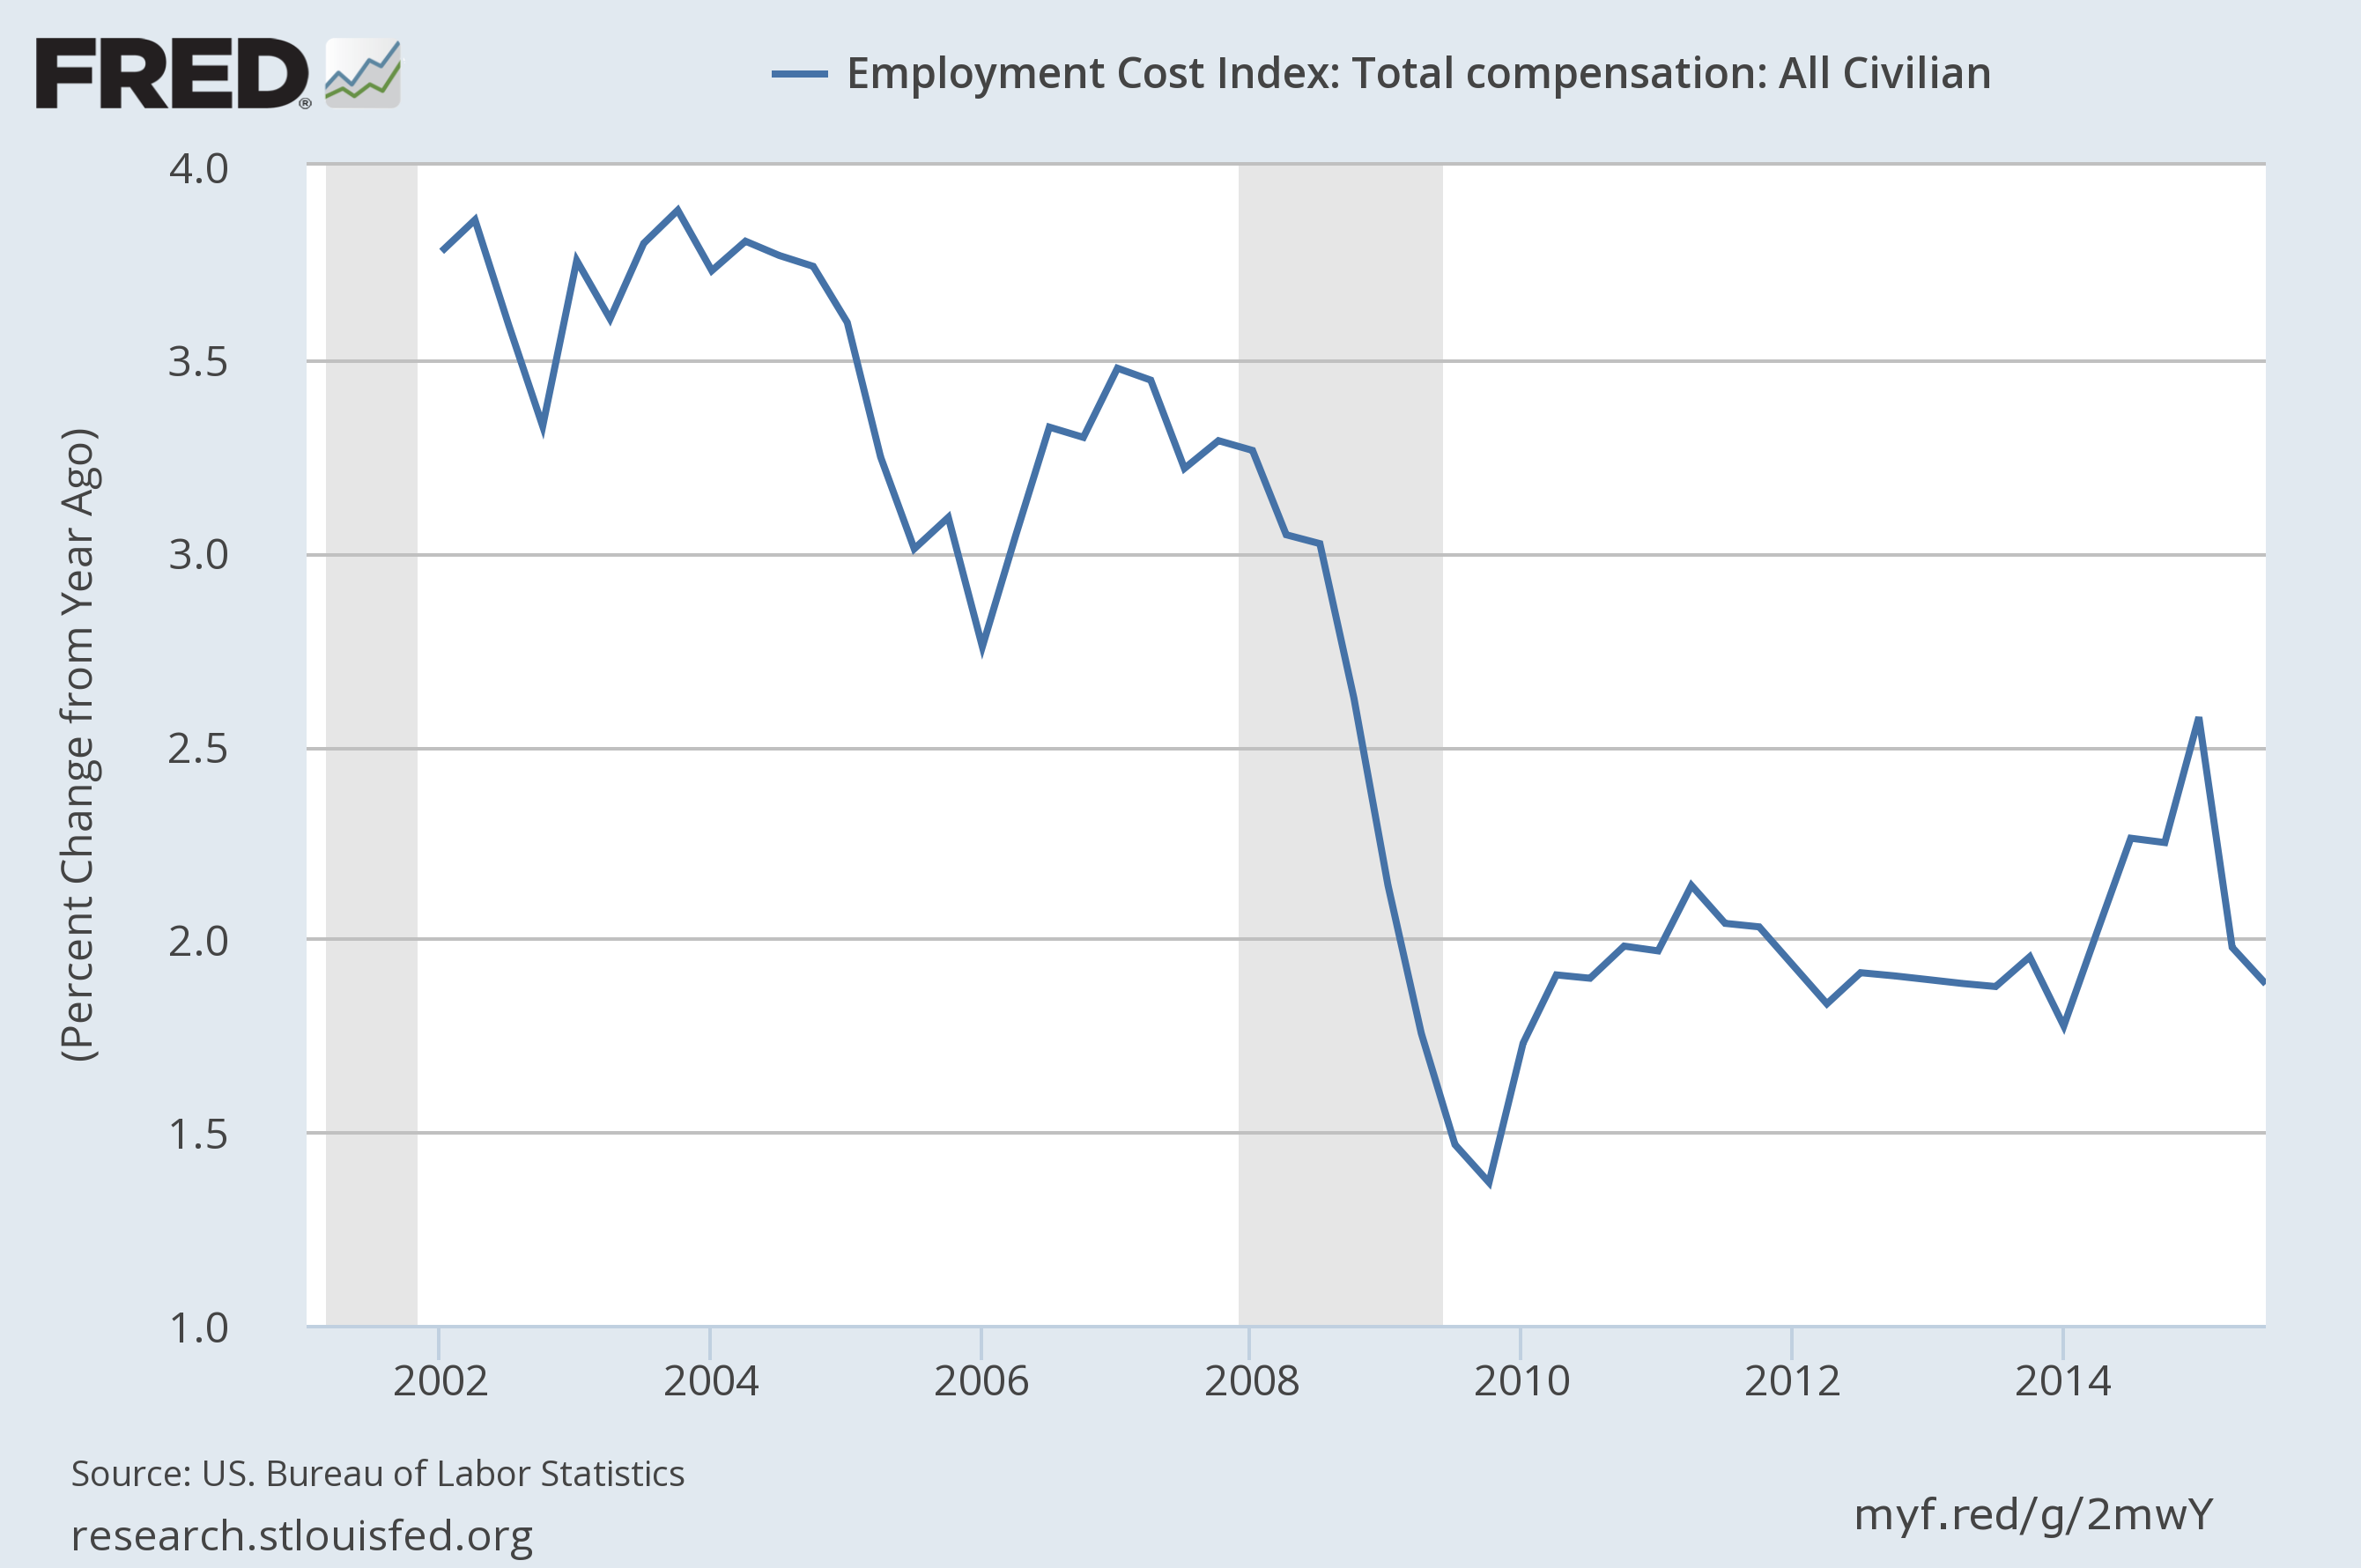
The second chart depicts the ECI on a “Percent Change from Year Ago” basis, showing a 1.89% increase Year-over-Year (YoY):
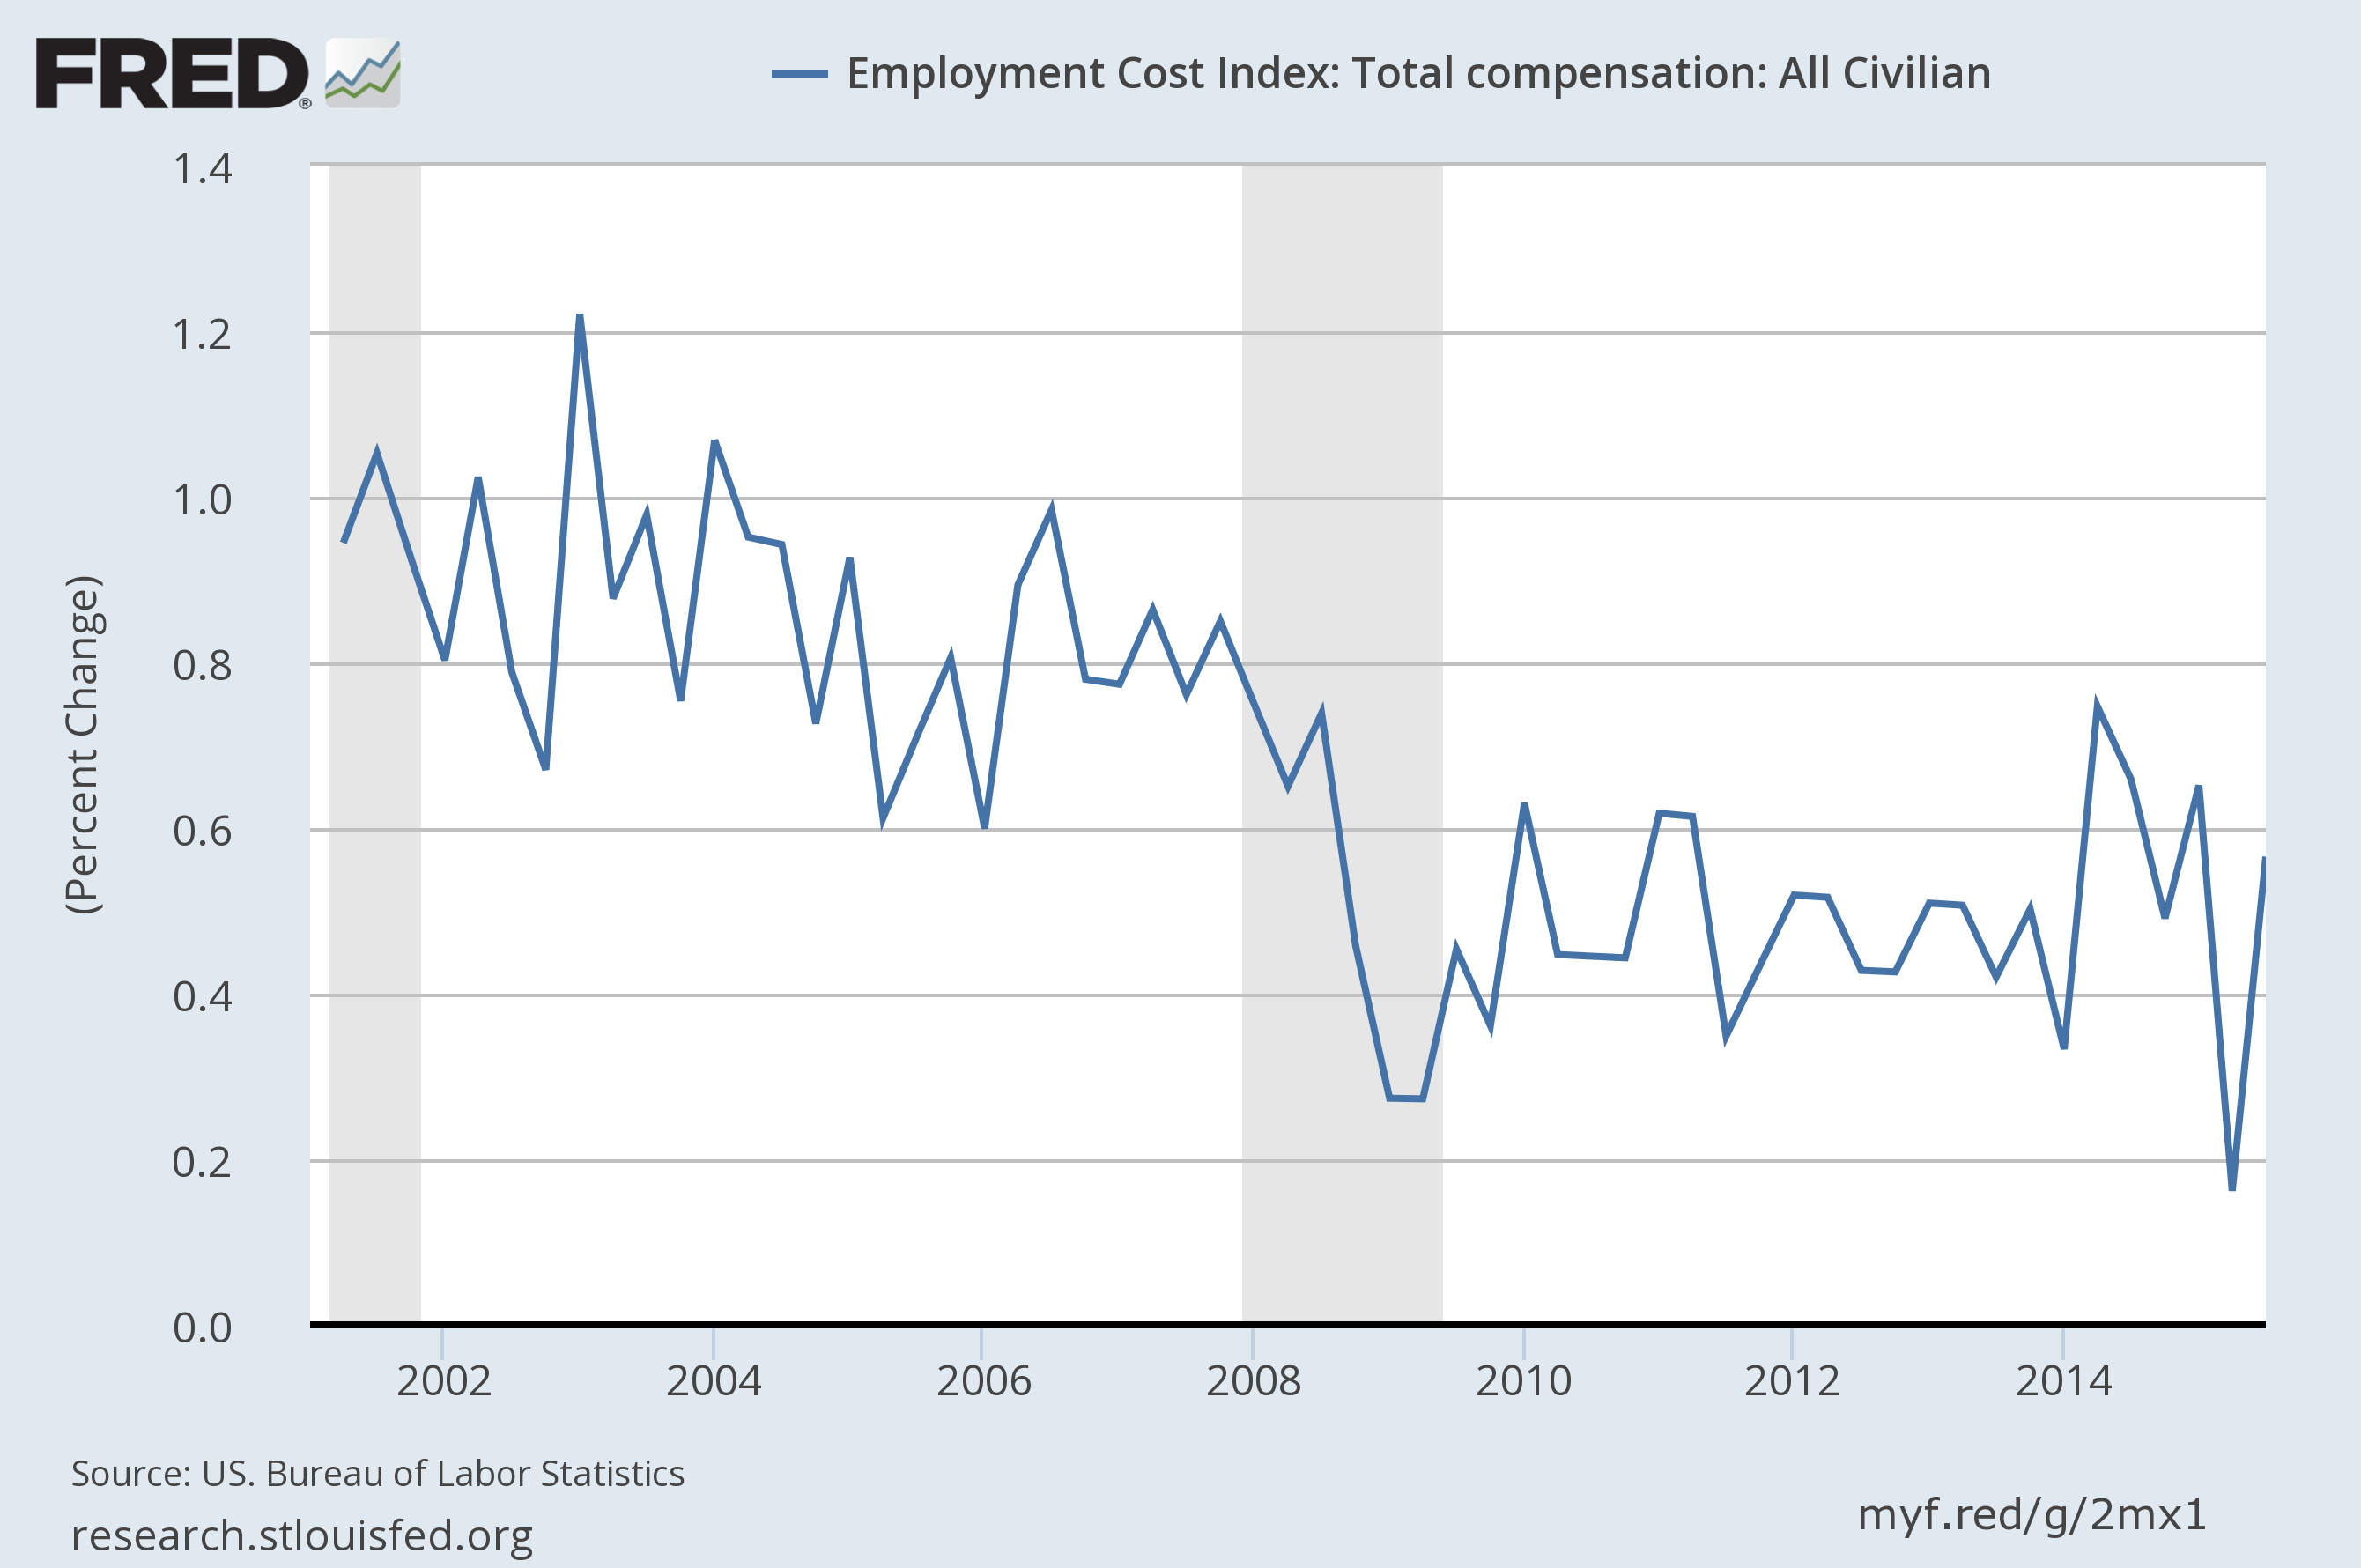
The third chart depicts the ECI on a “Percent Change” (from last quarter) basis, showing a .56% increase from the second quarter:
_____
The Special Note summarizes my overall thoughts about our economic situation
SPX at 2088.79 as this post is written
No comments:
Post a Comment