Friday, September 30, 2016

Consumer Confidence Surveys – As Of September 30, 2016

Doug Short had a blog post of September 30, 2016 (“Michigan Consumer Sentiment :  September Final Up Slightly“) in which he presents the latest Conference Board Consumer Confidence and Thomson/Reuters University of Michigan Consumer Sentiment Index charts.  They are presented below:
(click on charts to enlarge images)
Conference Board Consumer Confidence
Michigan Consumer Sentiment
There are a few aspects of the above charts that I find highly noteworthy.  Of course, until the recent sudden upswing, the continued subdued absolute levels of these two surveys was disconcerting.
Also, I find the “behavior” of these readings to be quite disparate as compared to the other post-recession periods, as shown in the charts between the gray shaded areas (the gray areas denote recessions as defined by the NBER.)
While I don’t believe that confidence surveys should be overemphasized, I find these readings to be very problematical, especially in light of a variety of other highly disconcerting measures highlighted throughout this site.
_____
The Special Note summarizes my overall thoughts about our economic situation
SPX at 2174.07 as this post is written

Thursday, September 29, 2016

Deloitte “CFO Signals” Report Q3 2016 – Notable Aspects

Recently Deloitte released their “CFO Signals” “High-Level Summary” report for the 3rd Quarter of 2016.
As seen in page 2 of the report, "One hundred twenty-two CFOs responded during the two-week period ending August 19. Seventy-three percent of respondents are from public companies, and 80% are from companies with more than $1B in annual revenue. For more information, please see the “About the survey” section of this report."
Here are some of the excerpts that I found notable:
from page 3:

Perceptions

How do you regard the current and future status of the North American, Chinese, and European economies? Forty-six percent of CFOs describe the North American economy as good or very good (up from 40% last quarter), and 37% expect better conditions in a year (down from 39%). Ten percent regard China’s economy as good (up from 9% last quarter), and 14% expect improvement (up from 10%). In the aftermath of the Brexit vote, just 4% describe Europe’s economy as good (down from 6%), and only 10% see it improving in a year (down from 15%). Page 8.
What is your perception of the capital markets? Seventy-one percent of CFOs say US equity markets are overvalued (up substantially from 56% last quarter and a new survey high). Eighty-nine percent say debt is currently an attractive financing option (up from 80%), and 42% of public company CFOs view equity financing favorably (up from 30% last quarter). Page 9.

Expectations

Compared to the past 12 months, how do you expect your key operating metrics to change over the next 12 months?* Revenue growth expectations rose slightly from last quarter’s 4.0% to 4.2%, but are still among their survey lows. Earnings growth expectations declined to 6.1%, well off last quarter’s 7.7% and near 1Q16’s survey low. Capital spending expectations, having increased sharply last quarter from 1Q16’s survey-low 1.7% to 5.4%, rose slightly to 5.6% this quarter. Domestic hiring growth expectations rose significantly to 2.3% from last quarter’s 1.1%. Pages 11-13.

Sentiment

Compared to three months ago, how do you feel now about the financial prospects for your company? This quarter’s net optimism declined from last quarter’s +30.0 to a still-strong +19.7, marking the fifteenth consecutive netpositive reading. Thirty-five percent of CFOs express rising optimism (down from 49% last quarter), and the proportion citing declining optimism fell from 19% to 16%. Page 14.
Overall, what risks worry you the most? CFOs mention global economic stagnation, low interest rates, a strong dollar, and regulatory uncertainty— concerns that appear amplified by worries about Brexit, US elections, and the tenor of geopolitics worldwide. Page 15.

Special topic: Business environment

How much are macroeconomic factors affecting your business planning? Nearly 90% of CFOs say low interest rates are significantly impacting their business planning, and more than 80% say the same for a strong US dollar. About 70% cite impacts from slow European growth, and nearly 65% cite slow Chinese growth. Fifty-seven percent cite impacts from both the upcoming US elections and the UK’s Brexit vote. Page 16.
*Averages are means that have been adjusted to eliminate the effects of stark outliers.
from page 4:

Mixed sentiment and expectations

This quarter’s net optimismof +19.7 is down from last quarter’s +30.0 (which came after a dismal +1.7 in the first quarter), but it still indicates considerable strength. Sentiment is net-positive across all industries except Retail/Wholesale, with Manufacturing and Technology indicating particular strength.
Despite this optimism, CFOs’ expectations for revenue, earnings, capital spending, and domestic hiring growth are mixed. This quarter’s 4.2%* expectation for yearover-year revenue growth is up from last quarter’s 4.0%* and from 3.3%* the quarter before that, but it is still among the lowest in the survey’s history. Similarly, this quarter’s earnings growth expectation of 6.1%* is barely above 1Q16’s survey-low 6.0%* and is well off last quarter’s 7.7%*.
On a more positive note, capital investment growth expectations, which bottomed out at just 1.7%* in 1Q16, rose to 5.4%* last quarter and to 5.6%* this quarter—well above the 4.7%* average over the past two years. Similarly, this quarter’s domestic hiring growth expectation of 2.3%* is well above the 1.1% to 1.4% levels we have seen over the last year and a half (and 1Q16’s low of 0.6%).
*Averages are means that have been adjusted to eliminate the effects of stark outliers.
¹ Net optimism is calculated as the difference between the proportions of those expressing rising and falling optimism. Accordingly, this metric does not explicitly account for the level of “no change” responses.
from page 11:

Revenue and earnings

Revenue[1]

Expectations remain among their survey lows; weakness is again evident across nearly all industries, but Energy/Resources continued to improve:
Other than one optimistic quarter in 4Q15, revenue growth has been on a downward trend since 2Q15 and come in at or near survey lows. This quarter’s 4.2% is up from last quarter’s 4.0% and from 3.3% the quarter below that, but it is still among the lowest in the survey’s history. The median this quarter repeated at 4.0%, and 83% of CFOs expect year-over-year gains (considerably up from the last two quarters). The distributionof this quarter’s responses is the lowest in almost two years.
Country expectations (this quarter/last quarter): US 3.9%/3.7%; Canada 6.2%/3.1%; Mexico 8.0%/8.6%.
Industry expectations (this quarter): Highest are T/M/E (8.0%) and Healthcare/Pharma (6.0%); lowest are Services (0.9%) and Manufacturing (2.8%).

Earnings1

Expectations declined across all geographies; Retail/Wholesale showed strength, while Financial Services came in near its survey low:
Earnings expectations have mostly been trending downward since the survey was launched in 2Q10. This quarter’s earnings growth expectations came in at 6.1%, barely above the 1Q16 survey low of 6.0% and well off of last quarter’s 7.7%. The median fell from 7.0% to 5.0%, and the percentage of CFOs expecting year-overyear gains rose from 76% last quarter to 81%. The distributionof responses was well below the average for this metric.
Country expectations (this quarter/last quarter): US 6.2%/7.3%; Canada 3.8%/9.4%); Mexico 8.5%/9.7%.
Industry expectations (this quarter): Highest are Retail/Wholesale (10.4%) and T/M/E (7.5%); lowest are Services (3.2%) and Financial Services (4.2%); notable is Healthcare/Pharma (5.7%, down from 10.9%).
[1] All averages have been adjusted to eliminate the effects of stark outliers.
[2] “Distribution” refers to the spread of the middle 90% of responses.
from page 13:

Domestic and offshore hiring

Domestic hiring[1]

Expectations rebounded with several industries showing significant improvement:
Domestic hiring expectations have been around 1.2% since 2Q15 and bottomed out in 1Q16 at 0.6%. This quarter’s 2.3% breaks that trend and is well up from last quarter’s 1.1%. The median remained 1.0%, and the proportion of CFOs expecting gains declined slightly from 55% to 53% (about even with the survey average). The distributionof responses is among the lowest for this metric.
Country expectations (this quarter/last quarter): US 1.9%/0.9% (secondlowest level in three years); Canada 4.8%/0.9%; Mexico 7.0%/3.9%.
Industry expectations (this quarter): Highest are T/M/E (7.3%), Healthcare/Pharma (3.6%), and Technology (3.3%); lowest are  Manufacturing (1.0%), Energy/Resources (1.3%), and Services (2.1%).

Offshore hiring1

Expectations remain near their three-year low:
Offshore hiring growth expectations fell markedly in 1Q16 and have stayed low since then. This quarter’s 1.9% is only slightly up from last quarter’s three-year-low of 1.8%. The median remains at 0.0%, and 43% of CFOs expect gains (up from last quarter’s 39%).
Country expectations (this quarter/last quarter): US 1.9%/1.9%; Canada 1.1%/0.0%; Mexico 4.5%/1.6%.
Industry expectations (this quarter): Highest is Technology (4.1%); lowest are Energy/Resources (0.5%) and Manufacturing (1.3%).

Domestic wage growth1

Expectations down somewhat, but still comparatively high:
Domestic wage growth declined to 2.7% from last quarter’s 3.1%. The median held at 3.0%, and 97% of CFOs expect gains.
Country expectations (this quarter/last quarter): US 2.7%/3.1%; Canada 2.6%/2.2%; Mexico 4.3%/4.6%.
Industry expectations (this quarter): Highest is T/M/E (4.0%); lowest are Energy/Resources (2.3%) and Manufacturing (2.6%).
[1] All averages have been adjusted to eliminate the effects of stark outliers.
[2] “Distribution” refers to the spread of the middle 90% of responses.
from page 15:

Most worrisome risks

External concerns

Rising concerns about the tenor and potential economic impact of geopolitics—especially in Europe and the US: 
Heightened election and policy concerns: Regulatory concerns are again strong and industry dependent. US election worries skyrocketed last quarter and increased this quarter (again with concerns around international trade and tax policy). Concerns about the tenor of the worldwide political environment rose sharply.
Concerns about broader global economic performance: For several quarters, including this one, CFOs’ concerns have appeared to be shifting from a specific focus on Europe and China to a more generalized focus on global economic stagnation and volatility.
Moderating concerns about the US economy: Perhaps influenced by equity and real estate markets that are near all-time highs, strengthening consumer sentiment, and mostly positive economic news this quarter, CFOs’ concerns about the US economy appeared to decline. Still, rising concerns about political and policy uncertainty and lagging business spending suggest CFOs see potential risks to future US economic performance.
Less concern about capital markets; more about interest rates: With equity markets having recovered strongly, concerns about financial market risk appear to have declined. Concerns about a strong dollar and global debt levels also decreased, but concerns about interest rates (the possibility of rate increases and the longterm impacts of continuing low rates) rose sharply.
Falling commodity price worries: After climbing sharply over the last two quarters, worries about oil and other commodity prices fell significantly this quarter.

Internal concerns

Talent again the top internal challenge:
Consistent talent challenges: Concerns around securing and retaining key personnel continued this quarter, as did those related to leadership succession.
Escalating growth and execution concerns: CFOs again voiced concerns about executing their growth initiatives, innovating, and executing against their strategies and plans.
Among the various charts and graphics in the report are graphics depicting trends in “Own Company Optimism” and “Economic Optimism” found on page 6.
_____
I post various business and economic surveys because I believe they should be carefully monitored.  However, as those familiar with this blog are aware, I do not necessarily agree with many of the consensus estimates and much of the commentary in these surveys.
_____
The Special Note summarizes my overall thoughts about our economic situation
SPX at 2149.85 as this post is written
Wednesday, September 28, 2016

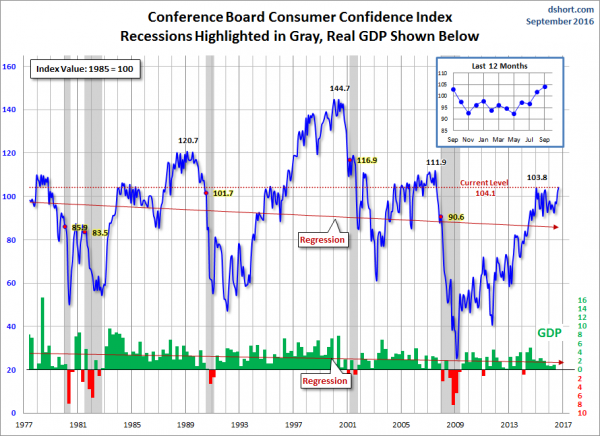
Chicago Fed National Financial Conditions Index (NFCI)

The St. Louis Fed’s Financial Stress Index (STLFSI) is one index that is supposed to measure stress in the financial system.  Its reading as of the September 22, 2016 update (reflecting data through September 16) is -1.007.
Of course, there are a variety of other measures and indices that are supposed to measure financial stress and other related issues, both from the Federal Reserve as well as from private sources.
Two other indices that I regularly monitor include the Chicago Fed National Financial Conditions Index (NFCI) as well as the Chicago Fed Adjusted National Financial Conditions Index (ANFCI).
Here are summary descriptions of each, as seen in FRED:
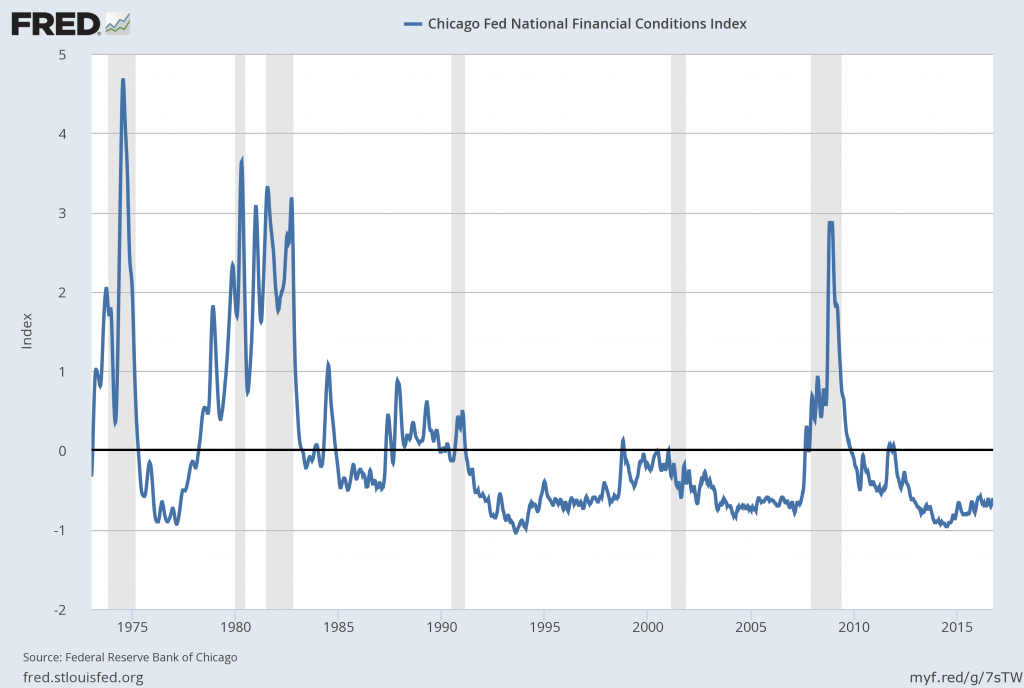
The National Financial Conditions Index (NFCI) measures risk, liquidity and leverage in money markets and debt and equity markets as well as in the traditional and “shadow” banking systems. Positive values of the NFCI indicate financial conditions that are tighter than average, while negative values indicate financial conditions that are looser than average.
The adjusted NFCI (ANFCI). This index isolates a component of financial conditions uncorrelated with economic conditions to provide an update on how financial conditions compare with current economic conditions.
For further information, please visit the Federal Reserve Bank of Chicago’s web site:
Below are the most recently updated charts of the NFCI and ANFCI, respectively.
The NFCI chart below was last updated on September 28, 2016 incorporating data from January 5,1973 to September 23, 2016, on a weekly basis.  The September 23, 2016 value is -.60:
NFCI
Data Source: FRED, Federal Reserve Economic Data, Federal Reserve Bank of St. Louis; accessed September 28, 2016:
The ANFCI chart below was last updated on September 28, 2016 incorporating data from January 5,1973 to September 23, 2016, on a weekly basis.  The September 23 value is .22:
ANFCI
Data Source: FRED, Federal Reserve Economic Data, Federal Reserve Bank of St. Louis; accessed September 28, 2016:
_________
I post various indicators and indices because I believe they should be carefully monitored.  However, as those familiar with this blog are aware, I do not necessarily agree with what they depict or imply.
_____
The Special Note summarizes my overall thoughts about our economic situation
SPX at 2159.66 as this post is written

Durable Goods New Orders – Long-Term Charts Through August 2016

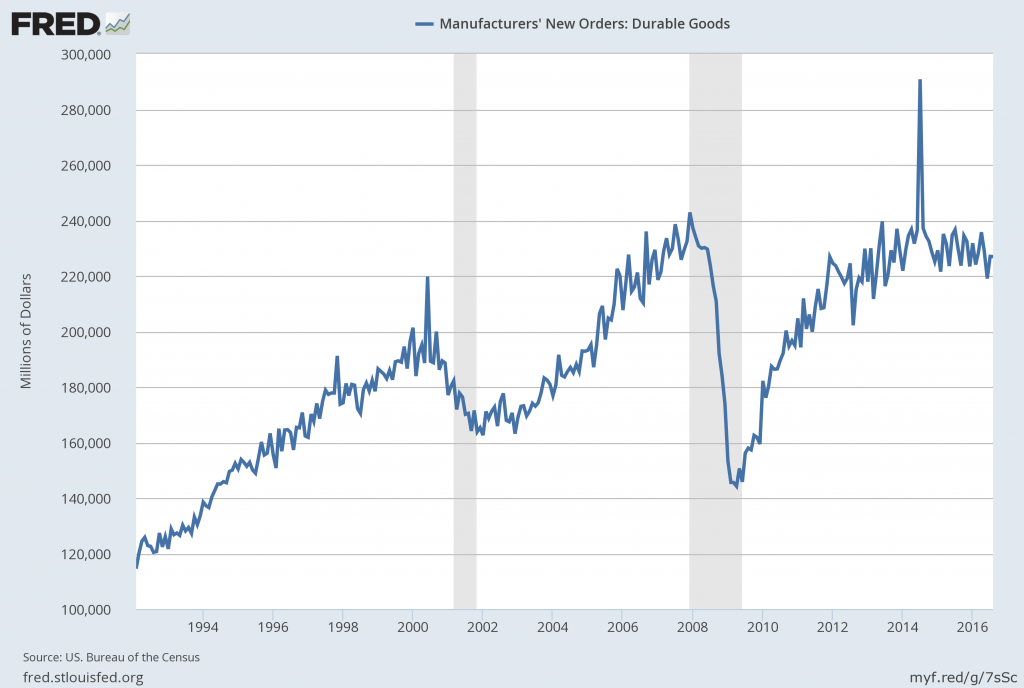
Many people place emphasis on Durable Goods New Orders as a prominent economic indicator and/or leading economic indicator.
For reference, below are two charts depicting this measure.
First, from the St. Louis Fed site (FRED), a chart through August 2016, updated on September 28, 2016. This value is $226,937 ($ Millions):
(click on charts to enlarge images)
Durable Goods New Orders August 2016
Second, here is the chart depicting this measure on a “Percentage Change from a Year Ago” basis:
dgorder_9-28-16-226937-percent-change-from-year-ago
Data Source: FRED, Federal Reserve Economic Data, Federal Reserve Bank of St. Louis: Manufacturers’ New Orders:  Durable Goods [DGORDER]; U.S. Department of Commerce: Census Bureau; accessed September 28, 2016;
_________
I post various indicators and indices because I believe they should be carefully monitored.  However, as those familiar with this blog are aware, I do not necessarily agree with what they depict or imply.
_____
The Special Note summarizes my overall thoughts about our economic situation
SPX at 2156.02 as this post is written

Monday, September 26, 2016

Money Supply Charts Through August 2016

For reference purposes, below are two sets of charts depicting growth in the money supply.
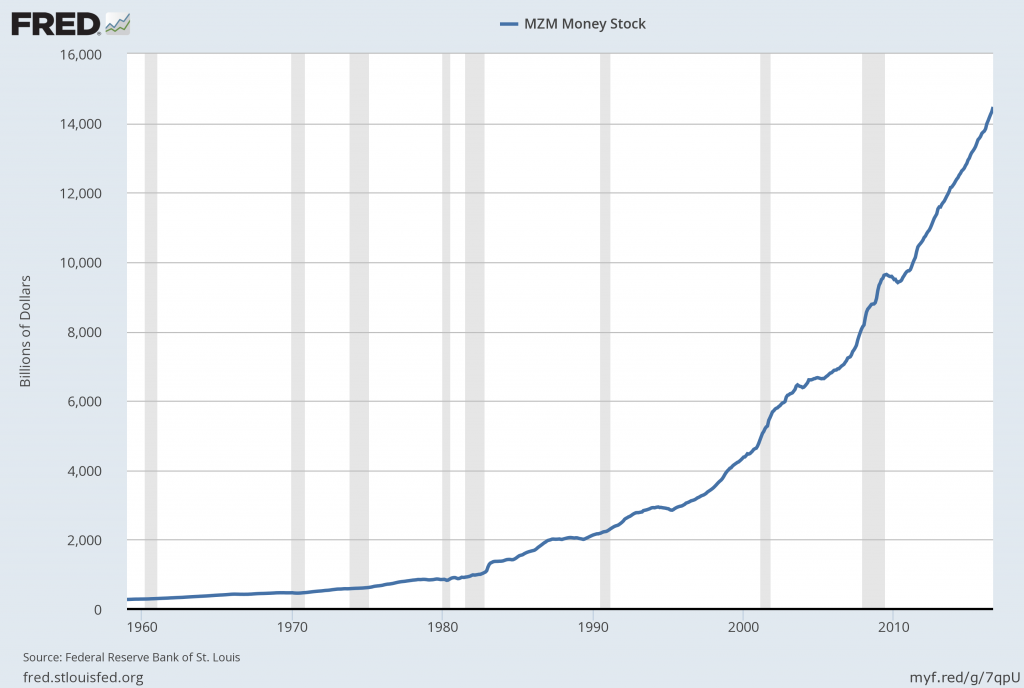
The first shows the MZM (Money Zero Maturity), defined in FRED as the following:
M2 less small-denomination time deposits plus institutional money funds.
Money Zero Maturity is calculated by the Federal Reserve Bank of St. Louis.
Here is the “MZM Money Stock” (seasonally adjusted) chart, updated on September 23, 2016 depicting data through August 2016, with a value of $14,668.7 Billion:
MZMSL
Here is the “MZM Money Stock” chart on a “Percent Change From Year Ago” basis:
MZMSL percent change from year ago
Data Source: FRED, Federal Reserve Economic Data, Federal Reserve Bank of St. Louis; accessed September 26, 2016:
The second set shows M2, defined in FRED as the following:
M2 includes a broader set of financial assets held principally by households. M2 consists of M1 plus: (1) savings deposits (which include money market deposit accounts, or MMDAs); (2) small-denomination time deposits (time deposits in amounts of less than $100,000); and (3) balances in retail money market mutual funds (MMMFs). Seasonally adjusted M2 is computed by summing savings deposits, small-denomination time deposits, and retail MMMFs, each seasonally adjusted separately, and adding this result to seasonally adjusted M1.
Here is the “M2 Money Stock” (seasonally adjusted) chart, updated on September 22, 2016, depicting data through August 2016, with a value of $13,008.0 Billion:
M2SL 9-22-16
Here is the “M2 Money Stock” chart on a “Percent Change From Year Ago” basis:
M2SL percent change from year ago
Data Source: FRED, Federal Reserve Economic Data, Federal Reserve Bank of St. Louis; accessed September 26, 2016:
_____
The Special Note summarizes my overall thoughts about our economic situation
SPX at 2164.69 as this post is written

Friday, September 23, 2016

Long-Term Charts Of The ECRI WLI & ECRI WLI, Gr. – September 23, 2016 Update

As I stated in my July 12, 2010 post (“ECRI WLI Growth History“):
For a variety of reasons, I am not as enamored with ECRI’s WLI and WLI Growth measures as many are.
However, I do think the measures are important and deserve close monitoring and scrutiny.
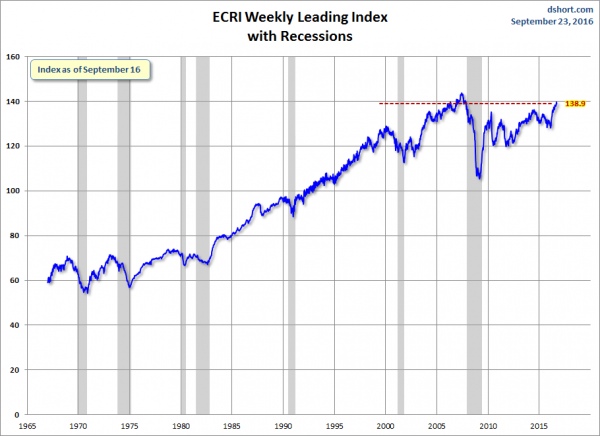
Below are three long-term charts, from Doug Short’s ECRI update post of September 23, 2016 titled “ECRI Weekly Leading Index:  WLIg Highest Since February 2013.”  These charts are on a weekly basis through the September 23, 2016 release, indicating data through September 16, 2016.
Here is the ECRI WLI (defined at ECRI’s glossary):
ECRI WLI
This next chart depicts, on a long-term basis, the Year-over-Year change in the 4-week moving average of the WLI:
dshort-9-23-16-ecri-yoy
This last chart depicts, on a long-term basis, the WLI, Gr.:
ECRI WLI,Gr.
_________
I post various economic indicators and indices because I believe they should be carefully monitored.  However, as those familiar with this blog are aware, I do not necessarily agree with what they depict or imply.
_____
The Special Note summarizes my overall thoughts about our economic situation
SPX at 2167.77 as this post is written
The U.S. Economic Situation – September 23, 2016 Update

Perhaps the main reason that I write of our economic situation is that I continue to believe, based upon various analyses, that our economic situation is in many ways misunderstood.  While no one likes to contemplate a future rife with economic adversity, current and future economic problems must be properly recognized and rectified if high-quality, sustainable long-term economic vitality is to be realized.
There are an array of indications and other “warning signs” – many readily apparent – that current economic activity and financial market performance is accompanied by exceedingly perilous dynamics.
I have written extensively about this peril, including in the following:
Building Financial Danger” (ongoing updates)
My analyses continues to indicate that the growing level of financial danger will lead to the next stock market crash that will also involve (as seen in 2008) various other markets as well.  Key attributes of this next crash is its outsized magnitude (when viewed from an ultra-long term historical perspective) and the resulting economic impact.  This next financial crash is of tremendous concern, as my analyses indicate it will lead to a Super Depression – i.e. an economy characterized by deeply embedded, highly complex, and difficult-to-solve problems.
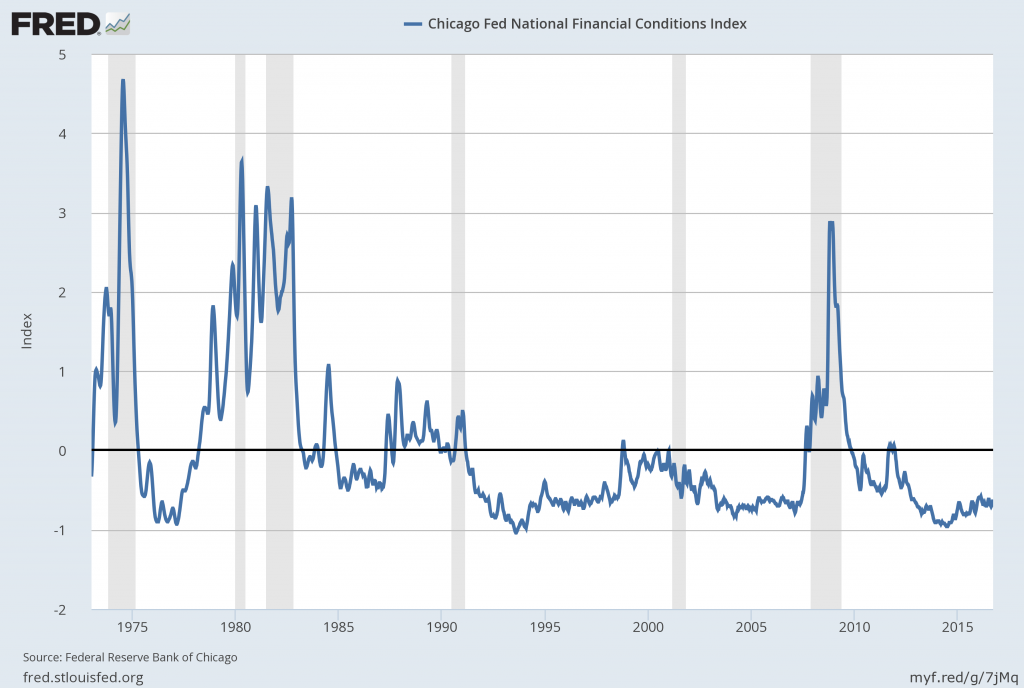
For long-term reference purposes, here is a chart of the Dow Jones Industrial Average since 1900, depicted on a monthly basis using a LOG scale (updated through September 16, 2016, with a last value of 18123.80):
(click on chart to enlarge image)(chart courtesy of StockCharts.com)
DJIA since 1900
_____
The Special Note summarizes my overall thoughts about our economic situation
SPX at 2177.18 as this post is written

Thursday, September 22, 2016

Updates Of Economic Indicators September 2016

Here is an update of various indicators that are supposed to predict and/or depict economic activity. These indicators have been discussed in previous blog posts:
The September 2016 Chicago Fed National Activity Index (CFNAI) updated as of September 22, 2016: (current reading of CFNAI is -.55; current reading of CFNAI-MA3 is -.07):
CFNAI-MA3
As of September 16, 2016 (incorporating data through September 9, 2016) the WLI was at 139.6 and the WLI, Gr. was at 8.7%.
A chart of the WLI,Gr., from Doug Short’s ECRI update post of September 16, 2016:
ECRI WLI,Gr.
Here is the latest chart, depicting the ADS Index from December 31, 2007 through September 17, 2016:
ADS Index
The Conference Board Leading (LEI), Coincident (CEI) Economic Indexes, and Lagging Economic Indicator (LAG):
As per the September 22, 2016 press release, titled “The Conference Board Leading Economic Index (LEI) for the U.S. Declined,” (pdf) the LEI was at 124.1, the CEI was at 114.1, and the LAG was 122.1 in August.
An excerpt from the September 22 release:
“While the U.S. LEI declined in August, its trend still points to moderate economic growth in the months ahead,” said Ataman Ozyildirim, Director of Business Cycles and Growth Research at The Conference Board. “Although strengths and weaknesses among the leading indicators are roughly balanced, positive contributions from the financial indicators were more than offset by weakening of nonfinancial indicators, such as leading indicators of labor markets, suggesting some risks to growth persist.”
Here is a chart of the LEI from Doug Short’s Conference Board Leading Economic Index update of September 22:
Conference Board LEI
_________
I post various indicators and indices because I believe they should be carefully monitored.  However, as those familiar with this blog are aware, I do not necessarily agree with what they depict or imply.
_____
The Special Note summarizes my overall thoughts about our economic situation
SPX at 2177.18 as this post is written
Janet Yellen’s September 21, 2016 Press Conference – Notable Aspects

On Wednesday, September 21, 2016 Janet Yellen gave her scheduled September 2016 FOMC Press Conference. (link of video and related materials)
Below are Janet Yellen’s comments I found most notable – although I don’t necessarily agree with them – in the order they appear in the transcript.  These comments are excerpted from the “Transcript of Chairman Yellen’s Press Conference“ (preliminary)(pdf) of September 21, 2016, with the accompanying “FOMC Statement” and “Economic Projections of Federal Reserve Board Members and Federal Reserve Bank Presidents, September 2016“ (pdf).
From Janet Yellen’s opening comments:
Economic growth, which was subdued during the first half of the year, appears to have picked up. Household spending continues to be the key source of that growth. This spending has been supported by solid increases in household income as well as by relatively high levels of consumer sentiment and wealth. Business investment, however, remains soft, both in the energy sector and more broadly. The energy industry has been hard hit by the drop in oil prices since mid-2014, and investment in that sector continued to contract through the first half of the year. However, drilling is now showing signs of stabilizing. Overall, we expect that the economy will expand at a moderate pace over the next few years.
also:
Ongoing economic growth and an improving job market are key factors supporting our inflation outlook. Overall consumer price inflation--as measured by the price index for personal consumption expenditures--was less than 1 percent over the 12 months ending in July, still short of our 2 percent objective. Much of this shortfall continues to reflect earlier declines in energy and import prices. Core inflation--which excludes energy and food prices that tend to be more volatile than other prices--has been running about 1-1/2 percent. As transitory influences holding down inflation fade, and as the job market strengthens further, we continue to expect inflation to rise to 2 percent over the next two to three years.
Janet Yellen’s responses as indicated to the various questions:
NANCY MARSHALL-GENZER. Nancy Marshall-Genzer with Marketplace. You mentioned commercial real estate. Are you worried that bubbles could form in the economy because of our prolonged low interest rates?
CHAIR YELLEN. Yes. Of course, we are worried that bubbles could form in the economy, and we routinely monitor asset evaluations. While nobody can know for sure what type of valuation represents a bubble--that's only something one can tell in hindsight--we are monitoring these measures of valuation, and commercial real estate valuations are high. Rents have moved up over time, but still valuations are high relative to rents. And so, it is something we've discussed. We called this out in our Monetary Policy Report and in other presentations.
And we are, in our supervision with banks, as I indicated, we have issued supervisory guidance to make sure that underwriting standards are sound on these loans, and we're aware-- this is something also that we look at in stress tests of the large-- the larger banks to see what would happen to their capital positions and to make sure that the hold sufficient capital. And, of course, I think the soundness and state of the banking system is improved substantially, but of course we are focused on such things.
also:
KAREN MRACEK. Karen Mracek with Market News International. You mentioned in the previous answer the need to be forward looking but you've also pointed to the economy not overheating as a reason you could, you know, hold off on raising rates at this one. Monetary policy is traditionally operated with long and variable lags. Do you think this timeline has changed since the financial crisis or due to the use of unconventional tools the Fed used and how does that factor into your decision making?
CHAIR YELLEN. So, I think the notion that monetary policy operates with long and variable lags, that statement is due to Milton Friedman and it is one of the essential things to understand about monetary policy and it is not fundamentally changed at all. And that is why I believe we have to be forward looking and I'm not in favor of the whites of their eyes rights sort of approach. We need to operate based on forecasts. But the global economy and the US economy have changed a lot. History doesn't always exactly replay itself. Many of the-- those of us sitting around the table, we learned the lesson that if policy is not forward looking, that inflation can pick up to highly undesirable levels that inflation expectations can be dislodged upward and the consequence of that can be that endemically higher inflation takes place which it is very costly to reduce. And absolutely, none of us want to relive an episode like that. And so I believe and my colleagues that it is important to be forward looking. We're going to make that mistake again. But the structure of the economy changes, things do change. The nature of the inflation process is changed I think significantly since the bad days of the '70s when the Fed had to face this chronic high inflation problem. We've seen inflation respond less to the economy, to movements in the unemployment rate that sometimes said the Phillips curve has become flatter. So we've seen less of a response, that's something we need to factor into our decision making. Inflation expectations appear to be better anchored, and perhaps that's been a result of a long period of low and stable inflation. That's an asset, it's something we didn't have in the 1970s. And in addition, we have to be attentive to the fact there we've now had a long period in which inflation is actually undershooting our 2 percent objective. And we see some signs that what I-- I would conclude inflation expectations are reasonably well-anchored at 2 percent. But we are seeing signs suggesting possible slippage there and we're long way from being-- facing the problems that Japan faces. But there always a-- should be a reminder to us that we also would not want to find ourselves in a period where inflation is chronically running below our objective. Inflation expectations are slipping and with a low neutral rate that becomes more important. So, things are changed, but principle of forward looking absolutely hold.

_____
The Special Note summarizes my overall thoughts about our economic situation
SPX at 2177.18 as this post is written
Wednesday, September 21, 2016

Chicago Fed National Financial Conditions Index (NFCI)

The St. Louis Fed’s Financial Stress Index (STLFSI) is one index that is supposed to measure stress in the financial system.  Its reading as of the September 15, 2016 update (reflecting data through September 9) is -1.134.
Of course, there are a variety of other measures and indices that are supposed to measure financial stress and other related issues, both from the Federal Reserve as well as from private sources.
Two other indices that I regularly monitor include the Chicago Fed National Financial Conditions Index (NFCI) as well as the Chicago Fed Adjusted National Financial Conditions Index (ANFCI).
Here are summary descriptions of each, as seen in FRED:
The National Financial Conditions Index (NFCI) measures risk, liquidity and leverage in money markets and debt and equity markets as well as in the traditional and “shadow” banking systems. Positive values of the NFCI indicate financial conditions that are tighter than average, while negative values indicate financial conditions that are looser than average.
The adjusted NFCI (ANFCI). This index isolates a component of financial conditions uncorrelated with economic conditions to provide an update on how financial conditions compare with current economic conditions.
For further information, please visit the Federal Reserve Bank of Chicago’s web site:
Below are the most recently updated charts of the NFCI and ANFCI, respectively.
The NFCI chart below was last updated on September 21, 2016 incorporating data from January 5,1973 to September 16, 2016, on a weekly basis.  The September 16, 2016 value is -.62:
NFCI 9-21-16
Data Source: FRED, Federal Reserve Economic Data, Federal Reserve Bank of St. Louis; accessed September 21, 2016:
The ANFCI chart below was last updated on September 21, 2016 incorporating data from January 5,1973 to September 16, 2016, on a weekly basis.  The September 16 value is .22:
anfci_9-21-16-22
Data Source: FRED, Federal Reserve Economic Data, Federal Reserve Bank of St. Louis; accessed September 21, 2016:
_________
I post various indicators and indices because I believe they should be carefully monitored.  However, as those familiar with this blog are aware, I do not necessarily agree with what they depict or imply.
_____
The Special Note summarizes my overall thoughts about our economic situation
SPX at 2150.40 as this post is written

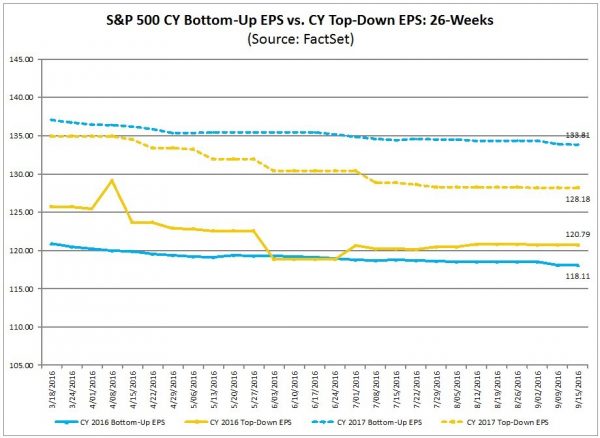
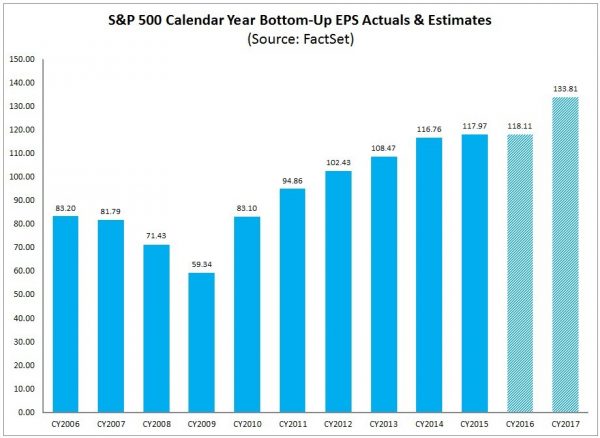
Trends Of S&P500 Earnings Forecasts

S&P500 earnings trends and estimates are a notably important topic, for a variety of reasons, at this point in time.
FactSet publishes a report titled “Earnings Insight” that contains a variety of information including the trends and expectations of S&P500 earnings.
For reference purposes, here are two charts as seen in the “Earnings Insight” (pdf) report of September 16, 2016:
from page 19:
(click on charts to enlarge images)
S&P500 earnings estimate trends
from page 20:
S&P500 EPS 2006-2017
_____
I post various economic forecasts because I believe they should be carefully monitored.  However, as those familiar with this blog are aware, I do not agree with many of the consensus estimates and much of the commentary in these forecast surveys.
_____
The Special Note summarizes my overall thoughts about our economic situation
SPX at 2139.76 as this post is written