Doug Short has recently published a post depicting this “stock market capitalization to GDP” metric.
As seen in his August 3, 2017 post titled “Market Cap to GDP: An Updated Look at the Buffett Valuation Indicator” he shows two different versions, varying by the definition of stock market capitalization. (note: additional explanation is provided in his post.)
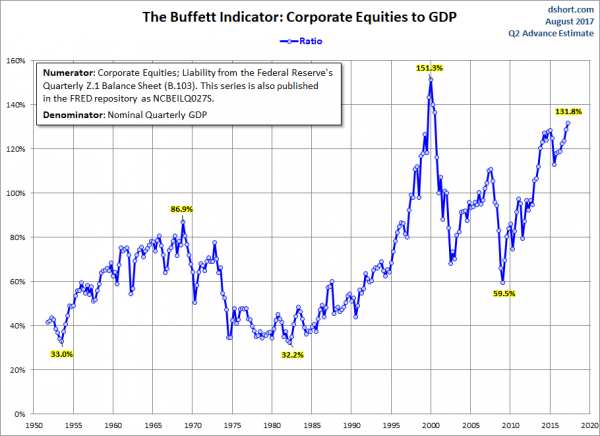
For reference purposes, here is the first chart, with the stock market capitalization as defined by the Federal Reserve:
(click on charts to enlarge images)
–
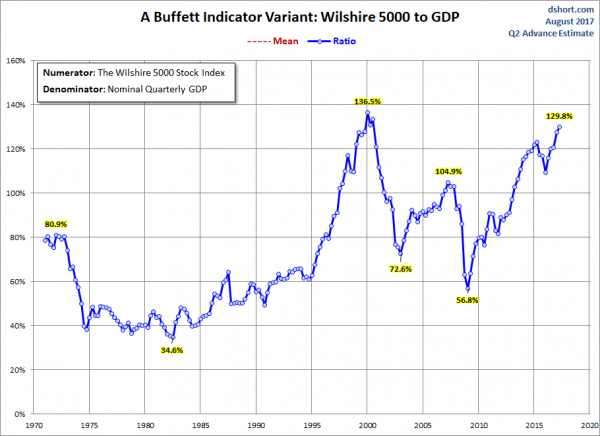
Here is the second chart, with the stock market capitalization as defined by the Wilshire 5000:
–
As one can see in both measures depicted above, “stock market capitalization to GDP” is at notably high levels from a long-term historical perspective.
_____
The Special Note summarizes my overall thoughts about our economic situation
SPX at 2472.84 as this post is written
No comments:
Post a Comment