Here is an update of various indicators that are supposed to predict and/or depict economic activity. These indicators have been discussed in previous blog posts:
The October 2017 Chicago Fed National Activity Index (CFNAI) updated as of October 23, 2017:
The CFNAI, with current reading of .17:
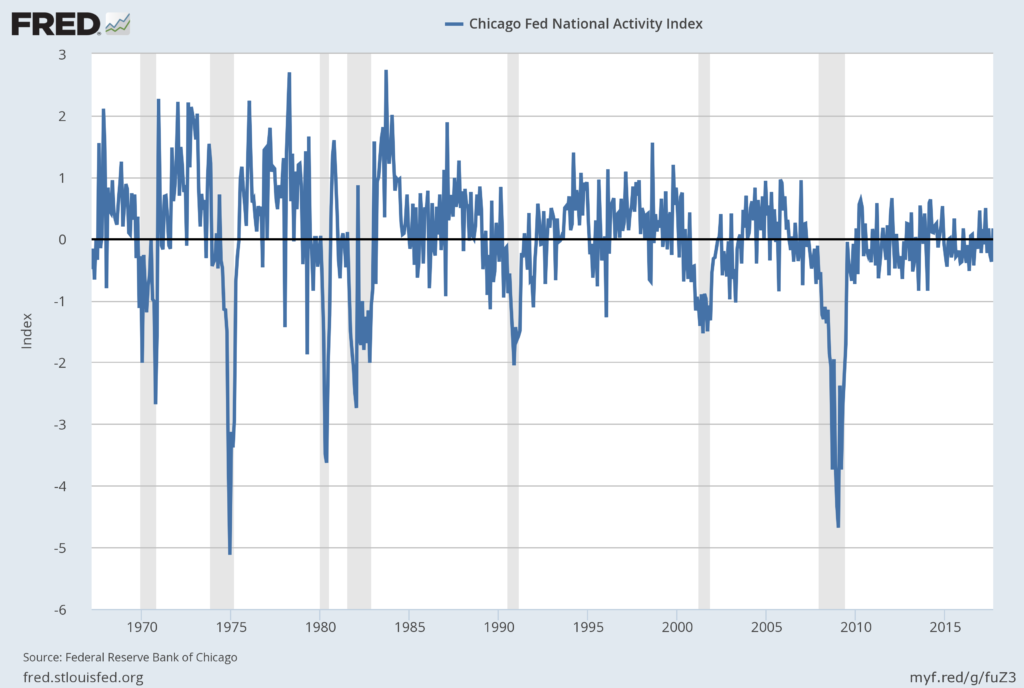
Federal Reserve Bank of Chicago, Chicago Fed National Activity Index [CFNAI], retrieved from FRED, Federal Reserve Bank of St. Louis, October 23, 2017;
The CFNAI-MA3, with current reading of -.16:
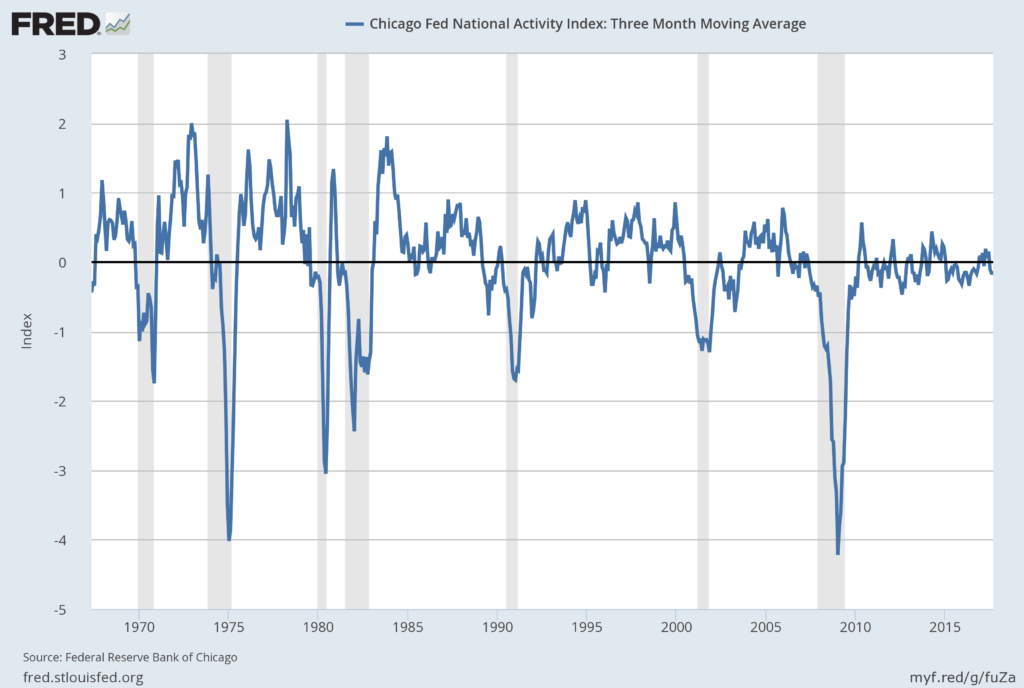
Federal Reserve Bank of Chicago, Chicago Fed National Activity Index: Three Month Moving Average [CFNAIMA3], retrieved from FRED, Federal Reserve Bank of St. Louis, October 23, 2017;
–
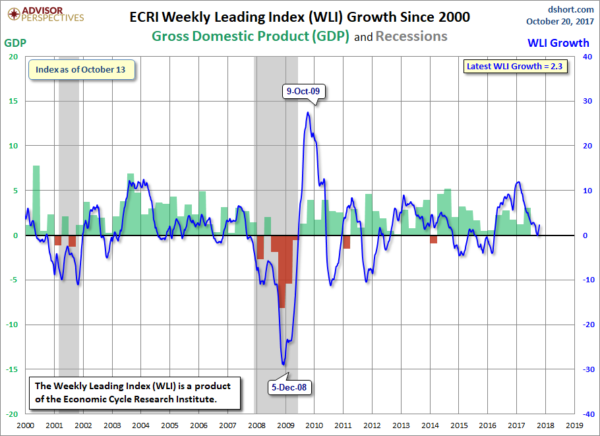
As of October 20, 2017 (incorporating data through October 20, 2017) the WLI was at 146.6 and the WLI, Gr. was at 2.3%.
A chart of the WLI,Gr., from Doug Short’s ECRI update post of October 20, 2017:
–
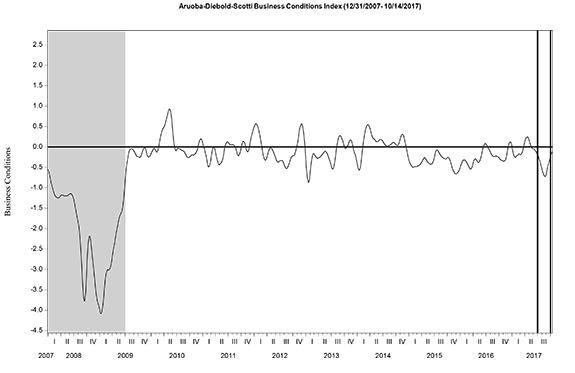
Here is the latest chart, depicting the ADS Index from December 31, 2007 through October 14, 2017:
–
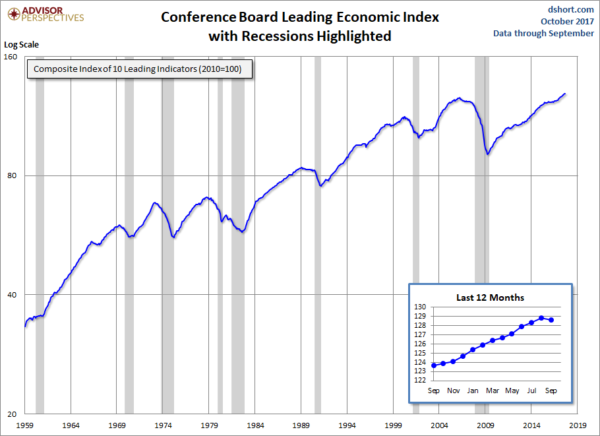
The Conference Board Leading (LEI), Coincident (CEI) Economic Indexes, and Lagging Economic Indicator (LAG):
As per the October 19, 2017 press release, titled “The Conference Board Leading Economic Index (LEI) for the U.S. Declined in September” (pdf) the LEI was at 128.6, the CEI was at 115.7, and the LAG was 125.2 in September.
An excerpt from the release:
“The US LEI declined slightly in September for the first time in the last twelve months, partly a result of the temporary impact of the recent hurricanes,” said Ataman Ozyildirim, Director of Business Cycles and Growth Research at The Conference Board. “The source of weakness was concentrated in labor markets and residential construction, while the majority of the LEI components continued to contribute positively. Despite September’s decline, the trend in the US LEI remains consistent with continuing solid growth in the US economy for the second half of the year.”
Here is a chart of the LEI from Doug Short’s Conference Board Leading Economic Index update of October 19, 2017:
_________
I post various indicators and indices because I believe they should be carefully monitored. However, as those familiar with this site are aware, I do not necessarily agree with what they depict or imply.
_____
The Special Note summarizes my overall thoughts about our economic situation
SPX at 2574.30 as this post is written
No comments:
Post a Comment