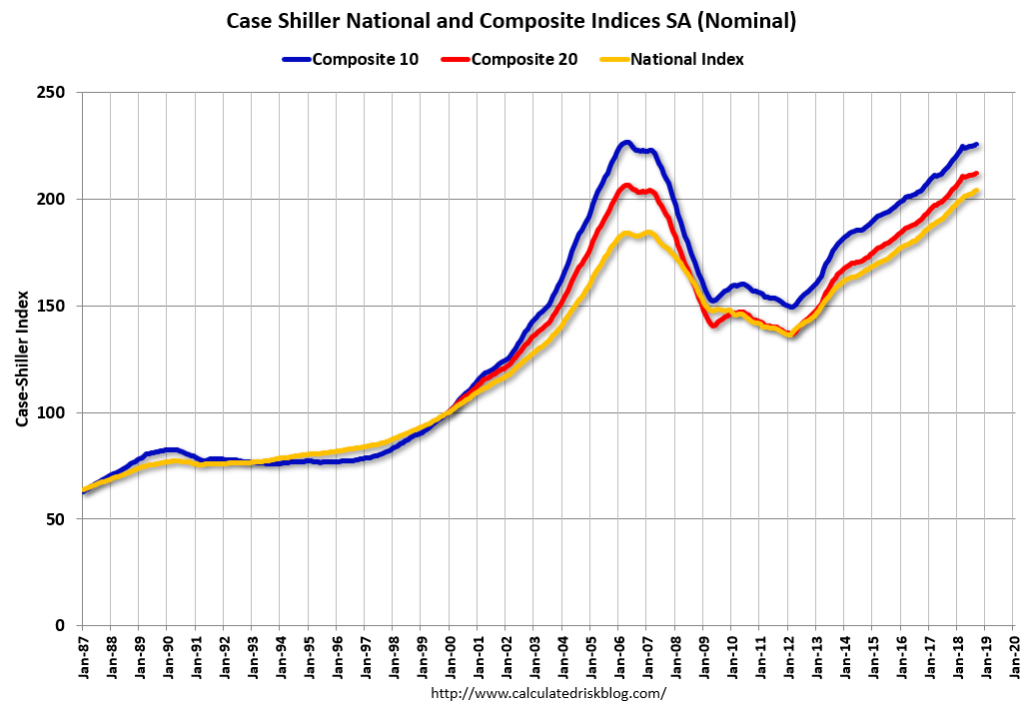
As a reference for long-term house price index trends, below is a chart, updated with the most current data (through September) from the CalculatedRisk blog post of November 27, 2018 titled “Case-Shiller: National House Price Index increased 5.5% year-over-year in September”:
_________
I post various indicators and indices because I believe they should be carefully monitored. However, as those familiar with this site are aware, I do not necessarily agree with what they depict or imply.
_____
The Special Note summarizes my overall thoughts about our economic situation
SPX at 2675.07 as this post is written
No comments:
Post a Comment