As I have commented previously, as in the October 6, 2009 post (“A Note About Unemployment Statistics”), in my opinion the official methodologies used to measure the various job loss and unemployment statistics do not provide an accurate depiction; they serve to understate the severity of unemployment.
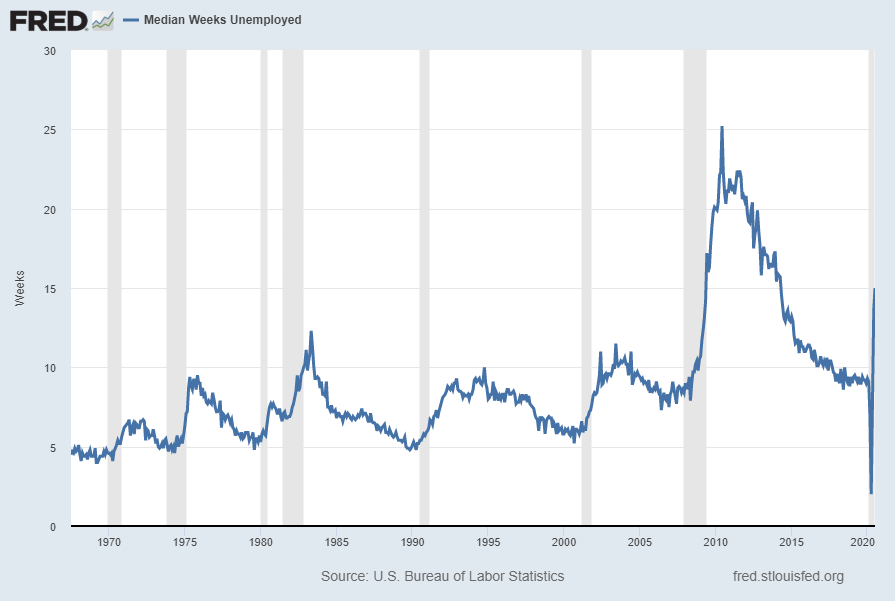
The three charts below are from the St. Louis Fed site. Here is the Median Duration of Unemployment (current value = 15.0 weeks):
(click on charts to enlarge images)(charts updated as of 8-7-20)

Data Source: FRED, Federal Reserve Economic Data, Federal Reserve Bank of St. Louis: Median Duration of Unemployment [UEMPMED] ; U.S. Department of Labor: Bureau of Labor Statistics; accessed August 7, 2020:
http://research.stlouisfed.org/fred2/series/UEMPMED
–
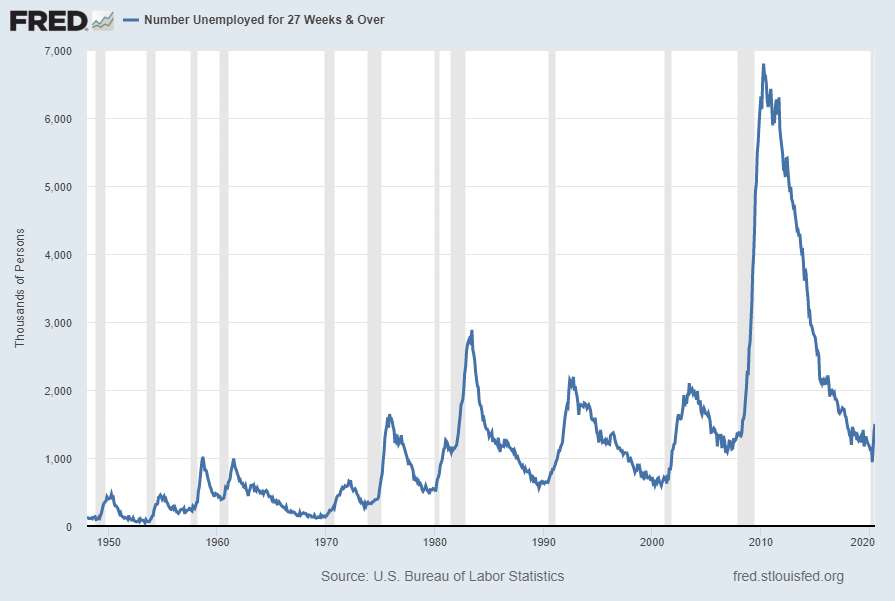
Here is the chart for Unemployed 27 Weeks and Over (current value = 1.501 million):

Data Source: FRED, Federal Reserve Economic Data, Federal Reserve Bank of St. Louis: Civilians Unemployed for 27 Weeks and Over [UEMP27OV] ; U.S. Department of Labor: Bureau of Labor Statistics; accessed August 7, 2020:
http://research.stlouisfed.org/fred2/series/UEMP27OV
–
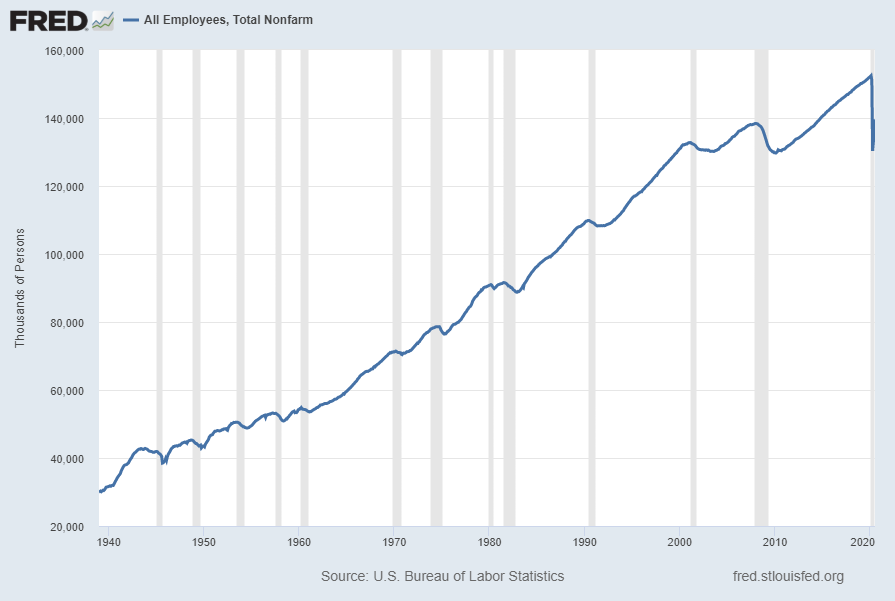
Here is the chart for Total Nonfarm Payroll (current value = 139.582 million):

Data Source: FRED, Federal Reserve Economic Data, Federal Reserve Bank of St. Louis: All Employees: Total Nonfarm [PAYEMS] ; U.S. Department of Labor: Bureau of Labor Statistics; accessed August 7, 2020:
https://research.stlouisfed.org/fred2/series/PAYEMS
–
No comments:
Post a Comment