U.S. Economic Indicators
Throughout this site there are many discussions of economic indicators. This post is the latest in a series of posts indicating U.S. economic weakness or a notably low growth rate.
The level and trend of economic growth is especially notable at this time. As seen in various measures and near-term projections, the U.S. economy has undergone an outsized level of economic contraction. However, most people believe (and virtually all prominent economic forecasts indicate) that this historic level of contraction will be temporary in nature and that a sustainable economic rebound will have started in the third quarter of 2020.
As seen in the November 2020 Wall Street Journal Economic Forecast Survey the consensus (average estimate) among various economists is for -2.66% GDP growth in 2020, 3.58% GDP growth in 2021, and 2.88% GDP growth in 2022.
Charts Indicating U.S. Economic Weakness
Below are a small sampling of charts that depict weak growth or contraction, and a brief comment for each:
The Weekly Economic Index (WEI)
A recently-introduced indicator, the Weekly Economic Index, is an economic indicator that is a composite of 10 different weekly indicators. It is (purportedly) designed to provide a timely depiction of the U.S. economic trend. As seen below, it depicts the severity of the recent plunge in economic activity.
The Weekly Economic Index (WEI) with a value of -2.68, updated as of November 12, 2020 (incorporating data through November 7, 2020):
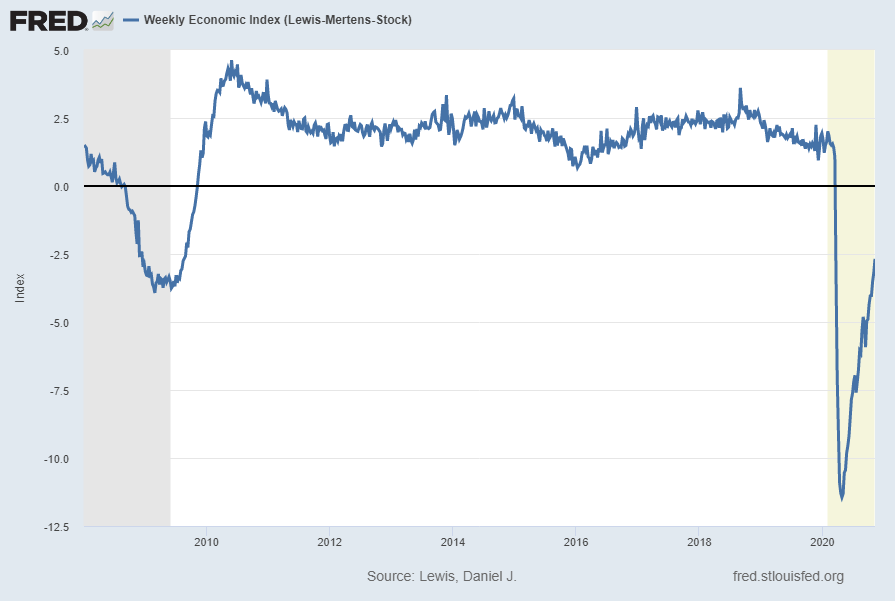
source: Lewis, Daniel J., Mertens, Karel and Stock, James H., Weekly Economic Index (Lewis-Mertens-Stock) [WEI], retrieved from FRED, Federal Reserve Bank of St. Louis; accessed November 13, 2020: https://fred.stlouisfed.org/series/WEI
__
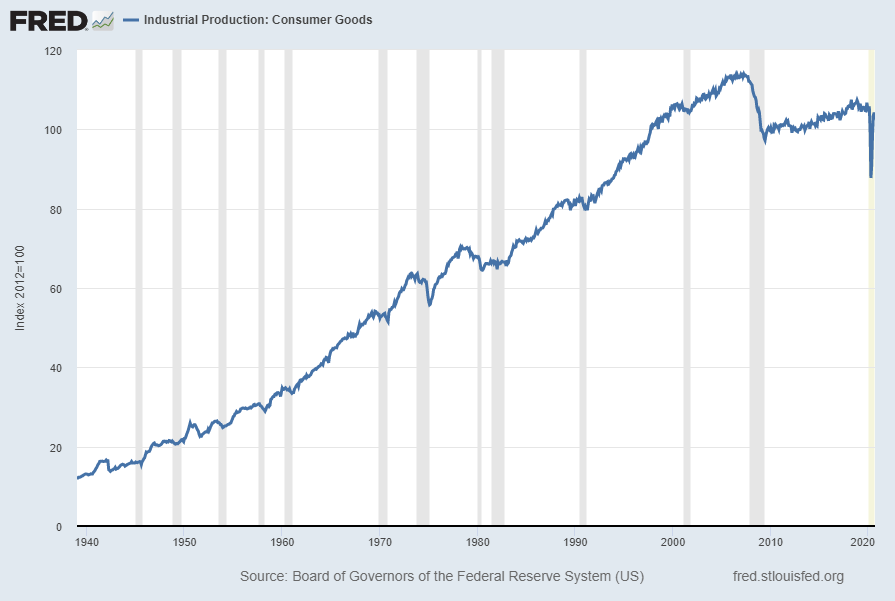
Industrial Production: Consumer Goods (IPCONGD)
The “Industrial Production: Consumer Goods” measure is another measure exhibiting an outsized contraction followed by a partial rebound. Shown below is a long-term chart of this measure (displayed from 1939), with last value of 102.5015 through September 2020, last updated October 16, 2020:
Displayed below is this same IPCONGD measure on a “Percent Change From Year Ago” basis with value -2.1%:
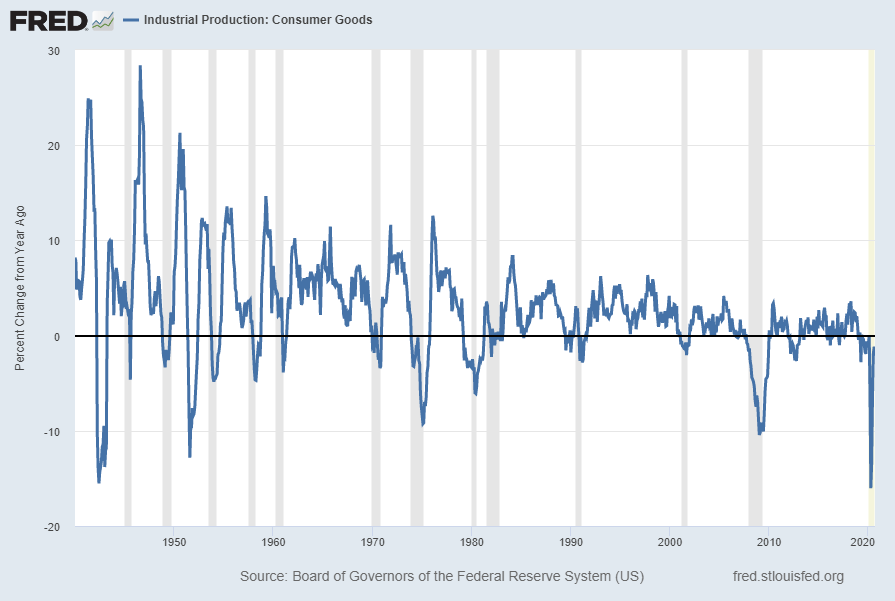
source: Board of Governors of the Federal Reserve System (US), Industrial Production: Consumer Goods [IPCONGD], retrieved from FRED, Federal Reserve Bank of St. Louis; accessed November 13, 2020: https://fred.stlouisfed.org/series/IPCONGD
__
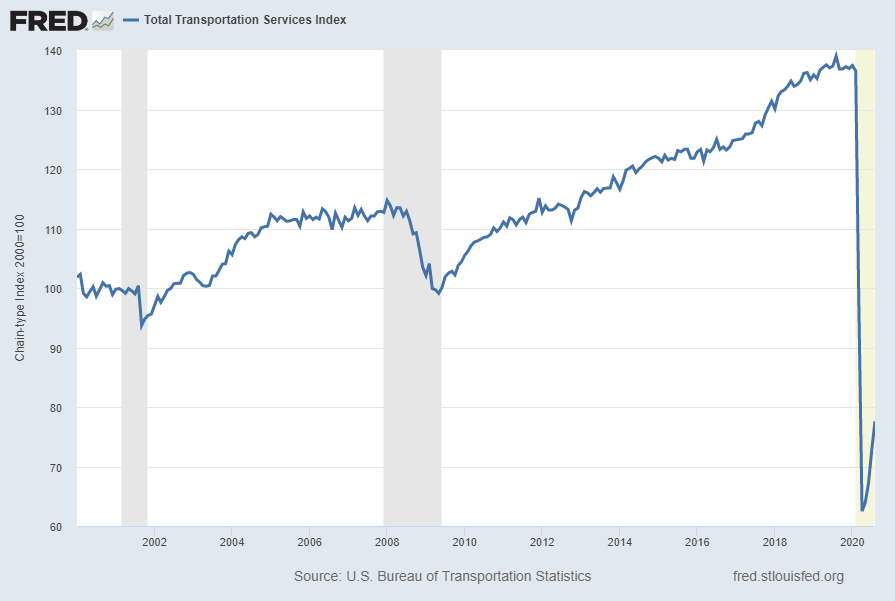
Total Transportation Services Index (TSITTL)
“Total Transportation Services Index” (TSITTL), like other transportation measures, is exhibiting recent substantial weakness. Shown below is this measure with last value of 77.6 through August, last updated November 12, 2020:
Below is this measure displayed on a “Percent Change From Year Ago” basis with value -44.2%:
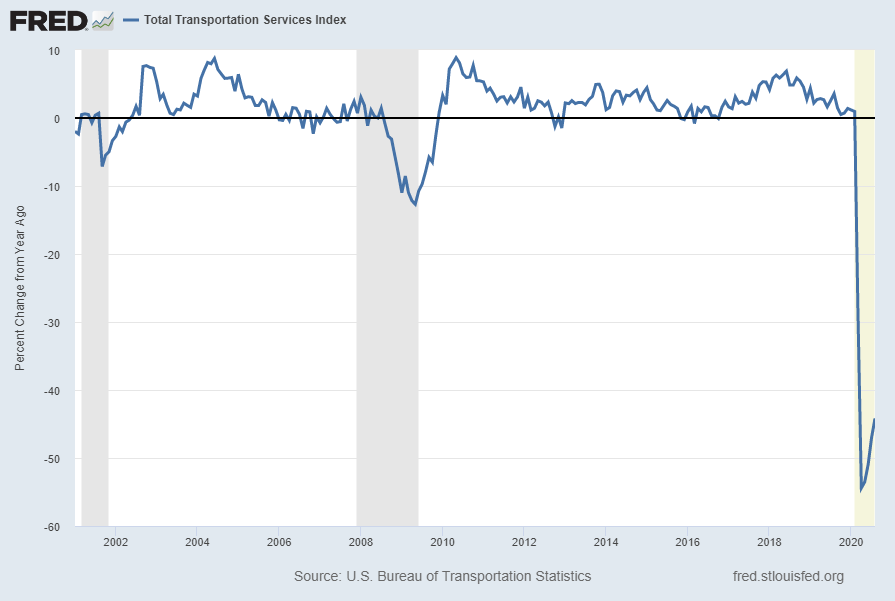
source: U.S. Bureau of Transportation Statistics, Total Transportation Services Index [TSITTL], retrieved from FRED, Federal Reserve Bank of St. Louis; accessed November 13, 2020; https://fred.stlouisfed.org/series/TSITTL
__
Vehicle Miles Traveled (TRFVOLUSM227SFWA)
Another indication of transportation and mobility is the Vehicle Miles Traveled indicator.
Shown below is this measure (seasonally adjusted (SA)) with last value of 247,238 (Millions of Miles) through September, last updated November 13, 2020:
![Vehicle Miles Traveled [TRFVOLUSM227SFWA]](https://www.economicgreenfield.com/wp-content/uploads/2020/11/TRFVOLUSM227SFWA_11-13-20-247238.png)
Below is this measure displayed on a “Percent Change From Year Ago” basis with value -9.7%:

source: U.S. Federal Highway Administration, Vehicle Miles Traveled [TRFVOLUSM227SFWA], retrieved from FRED, Federal Reserve Bank of St. Louis; accessed November 13, 2020: https://fred.stlouisfed.org/series/TRFVOLUSM227SFWA
__
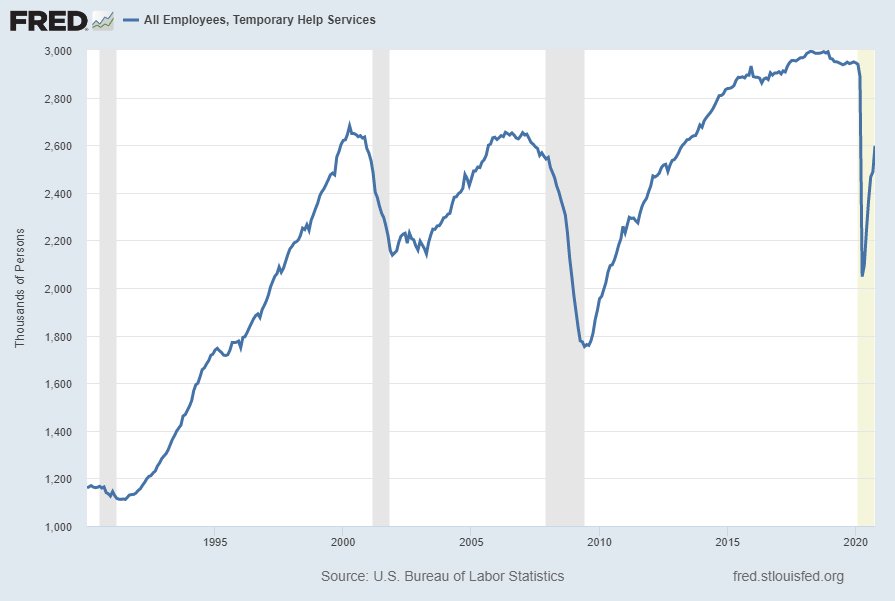
All Employees, Temporary Help Services (TEMPHELPS)
I have written extensively about many facets of employment and unemployment, as the current and future unemployment issue is of tremendous importance.
One theory regarding employment is that hiring cycles typically begin with an uptake in temporary employment.
Shown below is this measure with last value of 2,597.1 (Thousands) through October, last updated November 6, 2020:
Below is this measure displayed on a “Percent Change From Year Ago” basis with value -11.8%:
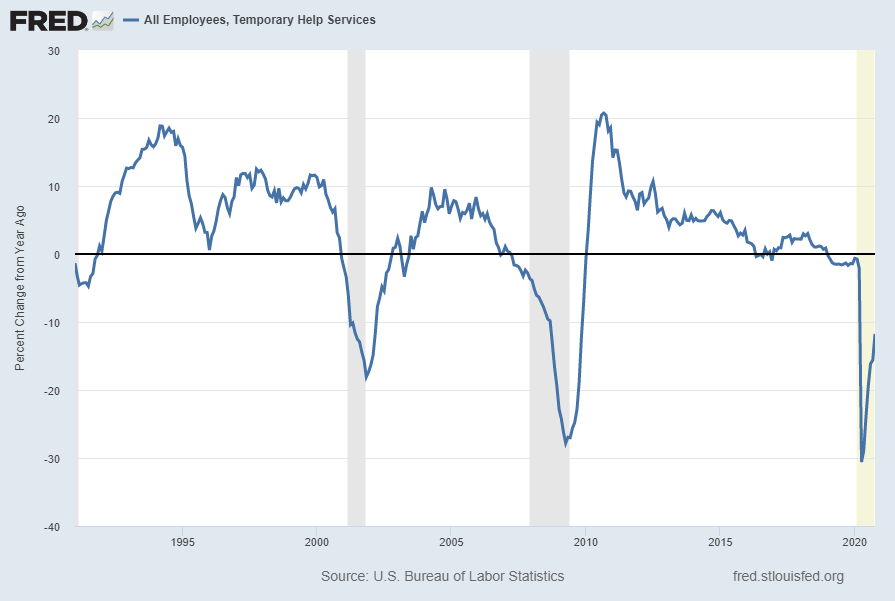
source: U.S. Bureau of Labor Statistics, All Employees, Temporary Help Services [TEMPHELPS], retrieved from FRED, Federal Reserve Bank of St. Louis; accessed November 14, 2020: https://fred.stlouisfed.org/series/TEMPHELPS
__
Other Indicators
As mentioned previously, many other indicators discussed on this site indicate slow economic growth or economic contraction, if not outright (gravely) problematical economic conditions.
_____
The Special Note summarizes my overall thoughts about our economic situation
SPX at 3585.15 as this post is written
No comments:
Post a Comment