Throughout this site there are many discussions of economic indicators. This post is the latest in a series of posts indicating facets of U.S. economic weakness or a notably low growth rate.
The level and trend of economic growth is especially notable at this time. As seen in various estimates, the probability of recession has grown significantly and the second consecutive quarter of Real GDP contraction was (first) reported on July 28.
As seen in the July 2022 Wall Street Journal Economic Forecast Survey the consensus (average estimate) among various economists is for .71% GDP growth in 2022, 1.14% GDP growth in 2023, and 2.05% GDP growth in 2024.
Charts Indicating U.S. Economic Weakness
Below are a small sampling of charts that depict weak growth or contraction, and a brief comment for each:
__
The Yield Curve (T10Y2Y)
Many people believe that the Yield Curve is a leading economic indicator for the United States economy.
On March 1, 2010, I wrote a post on the issue, titled “The Yield Curve As A Leading Economic Indicator.”
While I continue to have the stated reservations regarding the “Yield Curve” as an indicator, I do believe that it should be monitored.
The U.S. Yield Curve (one proxy seen below) has turned negative and is (all things considered) notably low when viewed from a long-term perspective. Below is the spread between the 10-Year Treasury Constant Maturity and the 2-Year Treasury Constant Maturity from June 1976 through the September 6, 2022 update, showing a value of -.17% [10-Year Treasury Yield (FRED DGS10) of 3.20% as of the September 6 update, 2-Year Treasury Yield (FRED DGS2) of 3.40% as of the September 6 update]:
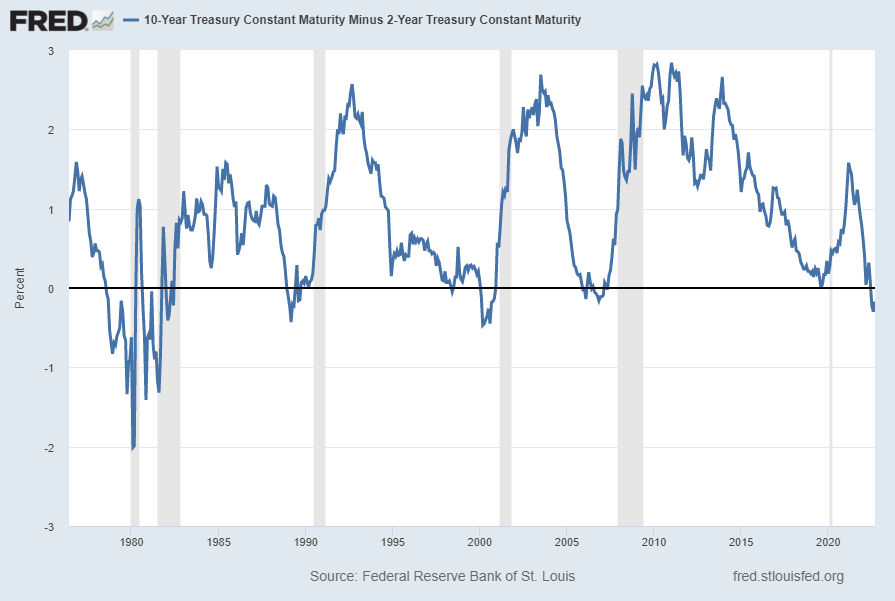
source: Federal Reserve Bank of St. Louis, 10-Year Treasury Constant Maturity Minus 2-Year Treasury Constant Maturity [T10Y2Y], retrieved from FRED, Federal Reserve Bank of St. Louis; accessed September 7, 2022: https://fred.stlouisfed.org/series/T10Y2Y
__
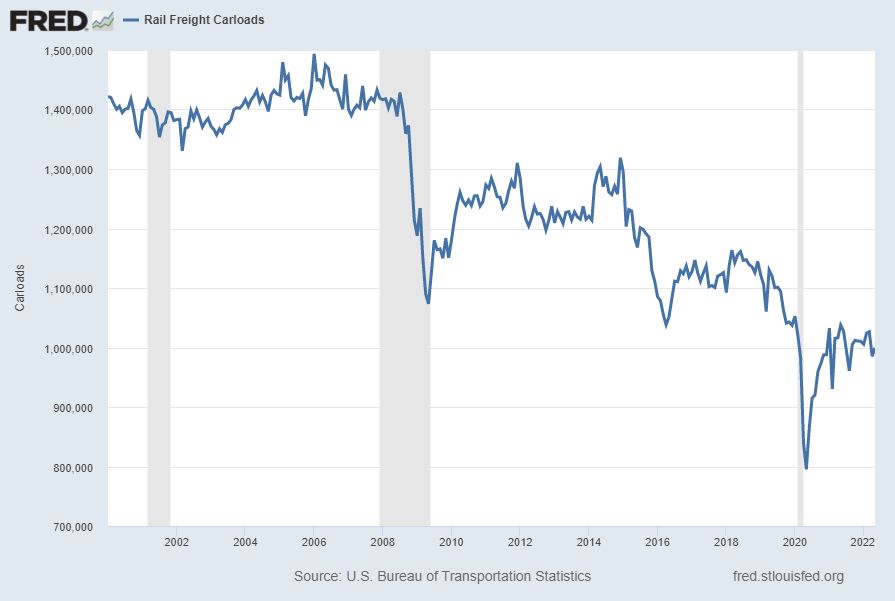
Rail Freight Carloads (RAILFRTCARLOADSD11)
“Rail Freight Carloads” continues to show a generally downward progression from a longer-term perspective. Shown below is a chart with data through May 2022 (last value of 999,661), last updated August 10, 2022:
Here is the same measure on a “Percent Change From Year Ago” basis, with value -3.7%:
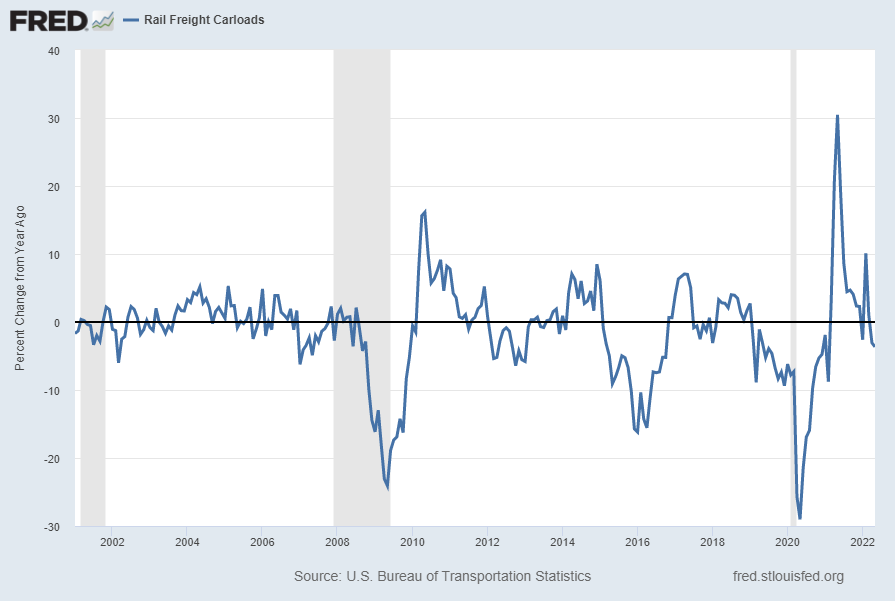
source: U.S. Bureau of Transportation Statistics, Rail Freight Carloads [RAILFRTCARLOADSD11], retrieved from FRED, Federal Reserve Bank of St. Louis; accessed September 6, 2022: https://fred.stlouisfed.org/series/RAILFRTCARLOADSD11
__
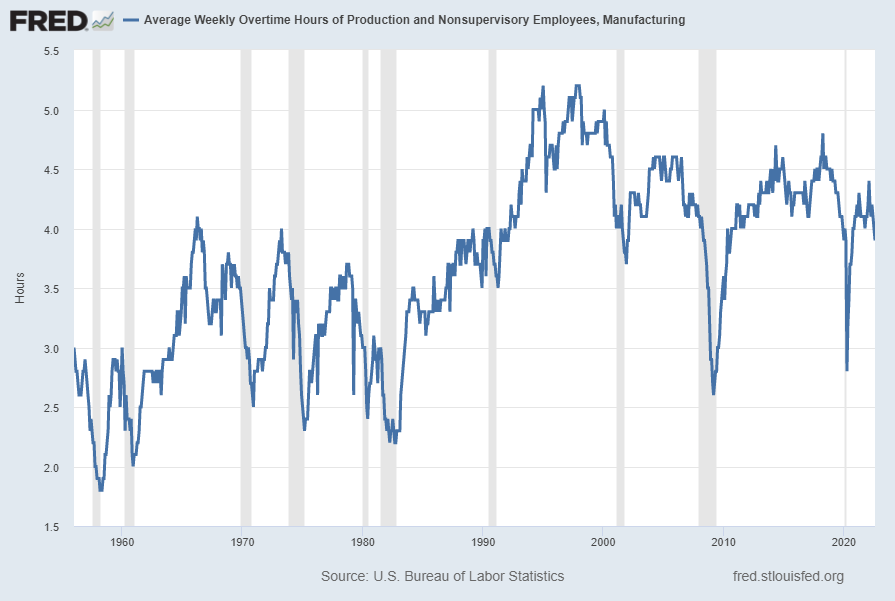
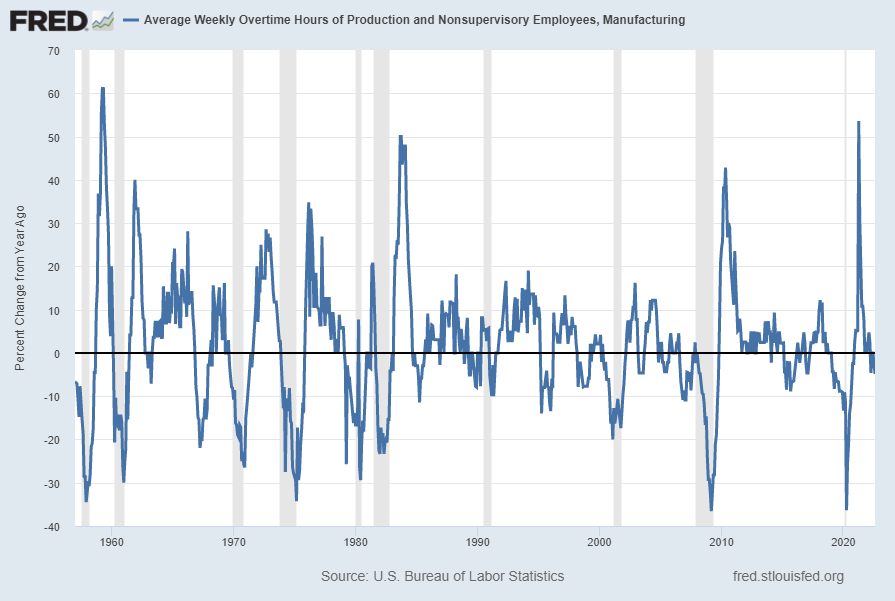
Average Weekly Overtime Hours of Production and Nonsupervisory Employees: Manufacturing (AWOTMAN)
Various U.S. manufacturing measures continue to indicate growth. However, overtime hours for manufacturing is somewhat subdued by recent-era economic expansion standards and the measure on a Percent Change From Year Ago level has recently gone negative.
Shown below is the “Average Weekly Overtime Hours of Production and Nonsupervisory Employees: Manufacturing” measure (with last value of 3.9 hours through August) last updated September 2, 2022:
Below is this measure displayed on a “Percent Change From Year Ago” basis with value -4.9%:
source: U.S. Bureau of Labor Statistics, Average Weekly Overtime Hours of Production and Nonsupervisory Employees: Manufacturing [AWOTMAN], retrieved from FRED, Federal Reserve Bank of St. Louis; accessed September 6, 2022: https://fred.stlouisfed.org/series/AWOTMAN
__
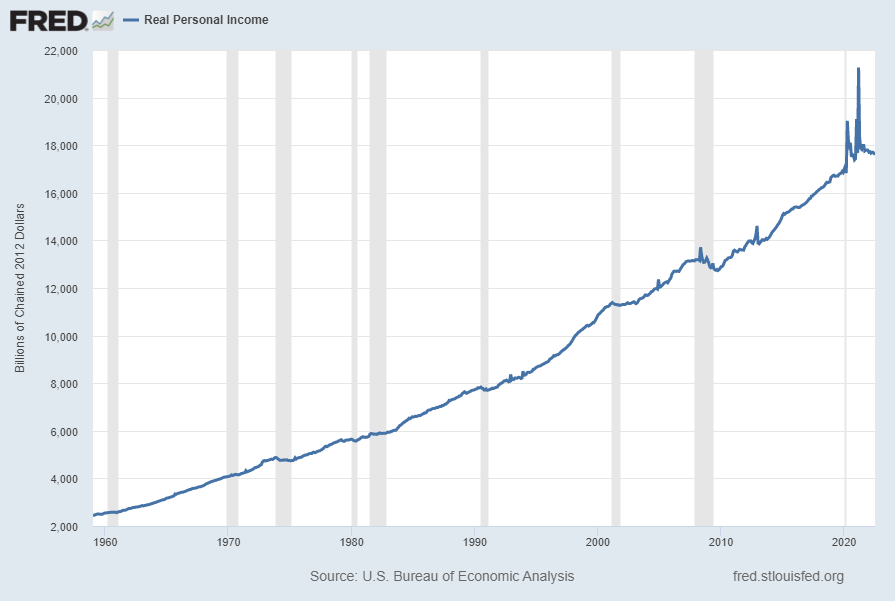
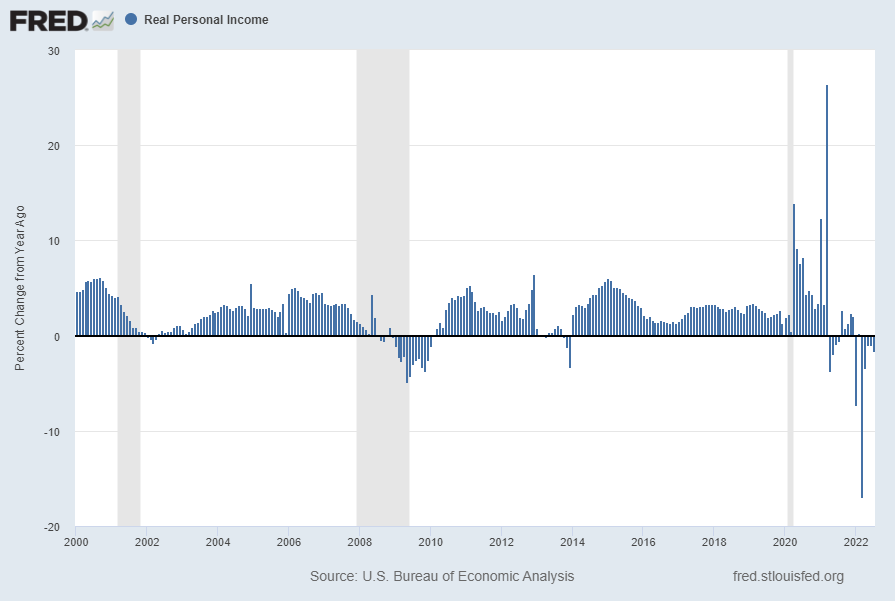
Real Personal Income (RPI)
“Real Personal Income” (RPI), has been volatile; it is faltering following the 2020 & 2021 spikes. Shown below is this measure with last value of $17,703.249 Billion through July, last updated August 26, 2022:
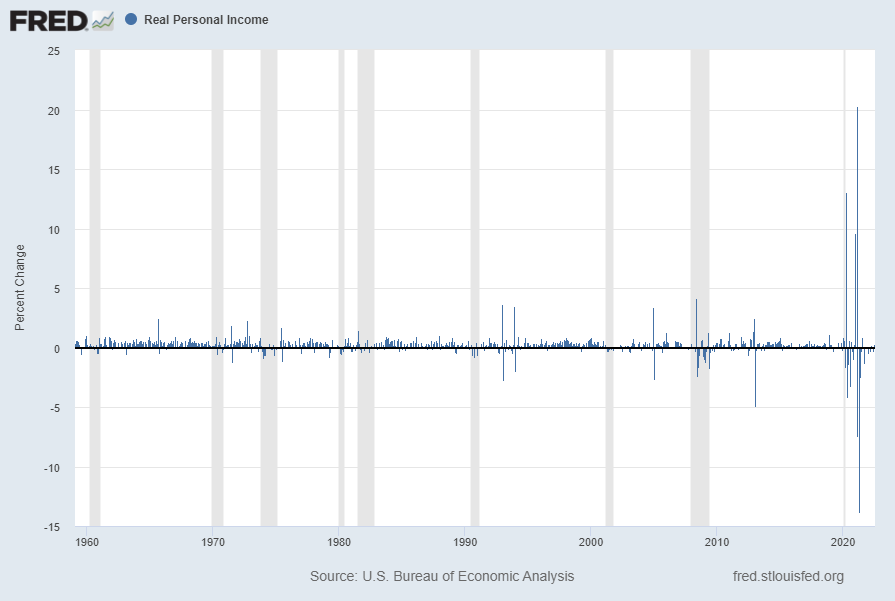
Below is this measure displayed on a “Percent Change” (from prior month) basis with last value of .3%:
Below is this measure displayed on a “Percent Change From Year Ago” basis with value -1.6%:
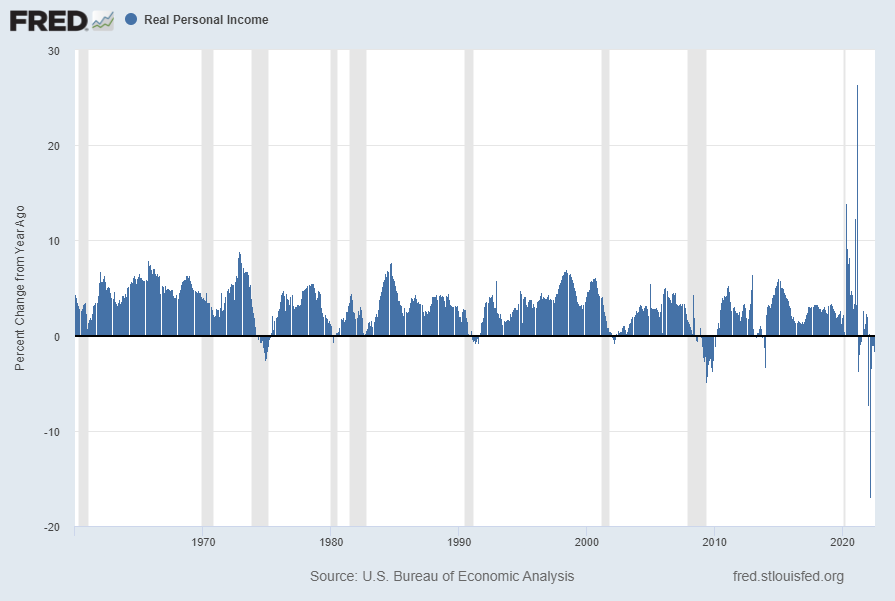
Below is this same measure (“Percent Change From Year Ago” basis) but from the year 2000 onward:
source: U.S. Bureau of Economic Analysis, Real Personal Income [RPI], retrieved from FRED, Federal Reserve Bank of St. Louis; accessed September 6, 2022: https://fred.stlouisfed.org/series/RPI
__
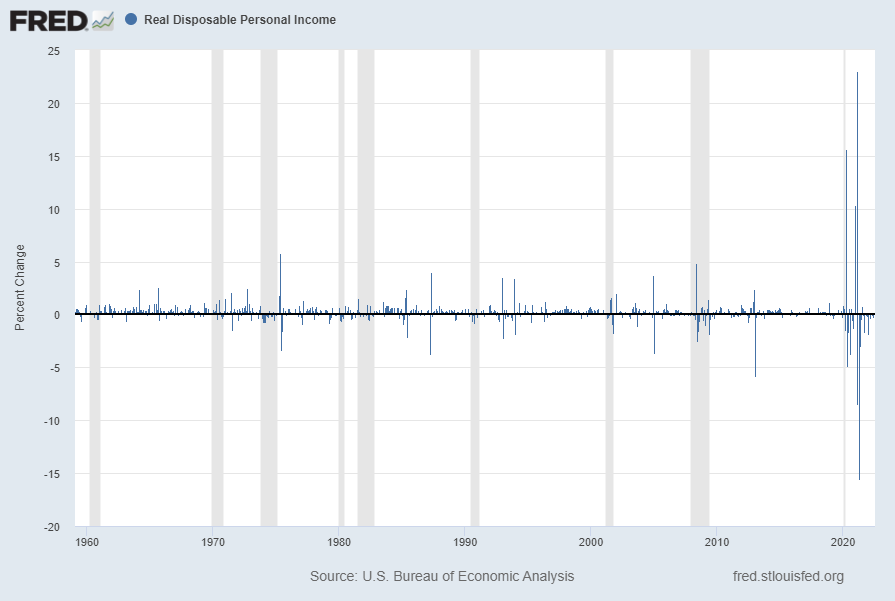
Real Disposable Personal Income (DSPIC96)
“Real Disposable Personal Income” (DSPIC96) has been volatile since 2020, and ongoing high inflation is presenting a hurdle to its continued growth. Shown below is this measure with last value of $15,145.6 Billion through July, last updated August 26, 2022:

Below is this measure displayed on a “Percent Change” (from prior month) basis with last value of 0.3%:
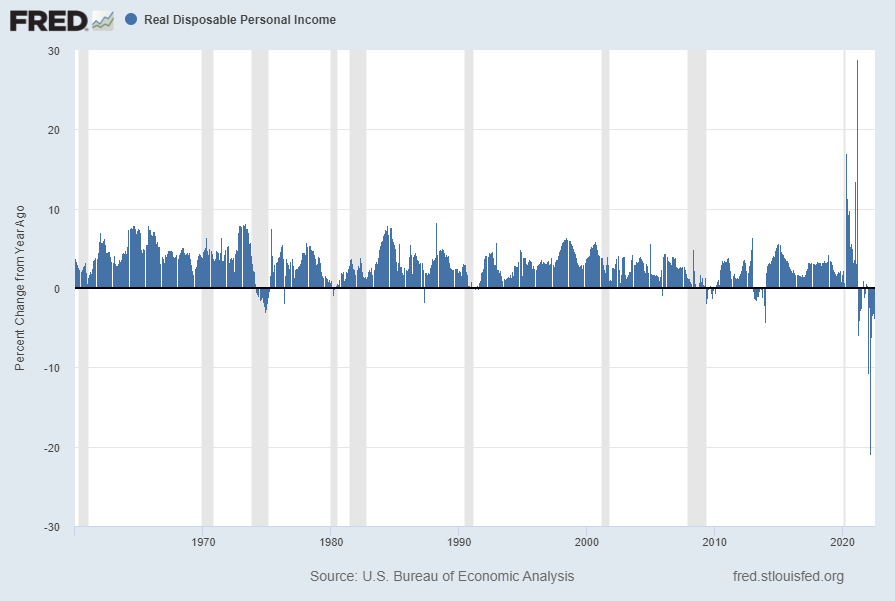
Below is this measure displayed on a “Percent Change From Year Ago” basis with value -3.7%:
Below is this same measure (“Percent Change From Year Ago” basis) but from the year 2000 onward:
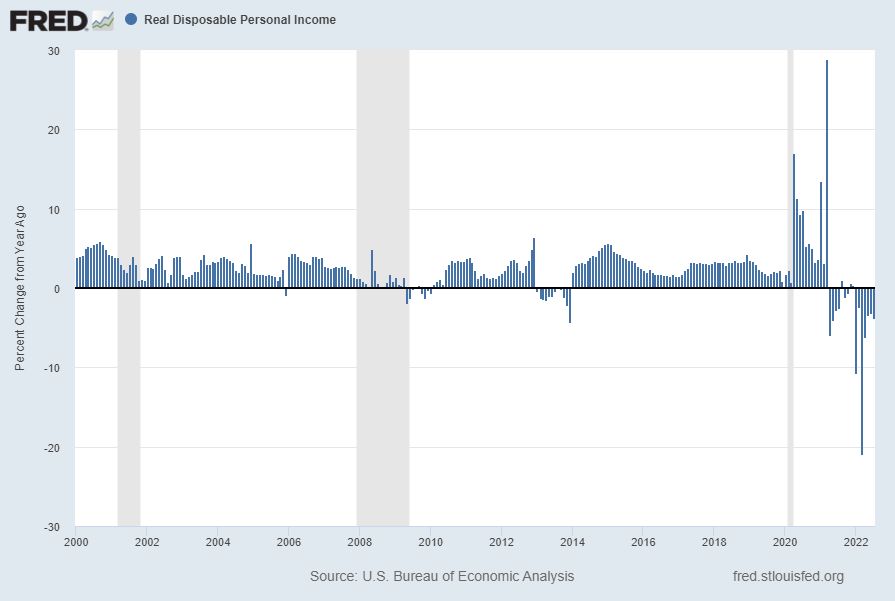
source: U.S. Bureau of Economic Analysis, Real Disposable Personal Income [DSPIC96], retrieved from FRED, Federal Reserve Bank of St. Louis; accessed September 6, 2022: https://fred.stlouisfed.org/series/DSPIC96
__
Other Indicators
As mentioned previously, many other indicators discussed on this site indicate slow economic growth or economic contraction, if not outright (gravely) problematical economic conditions.
_____
The Special Note summarizes my overall thoughts about our economic situation
SPX at 3912.36 as this post is written
No comments:
Post a Comment