StockCharts.com maintains long-term historical charts of various major stock market indices, interest rates, currencies, commodities, and economic indicators.
As a long-term reference, below are charts depicting various stock market indices for the dates shown. All charts are depicted on a monthly basis using a LOG scale.
(click on charts to enlarge images)(charts courtesy of StockCharts.com)
The Dow Jones Industrial Average, from 1900 – September 29, 2023:
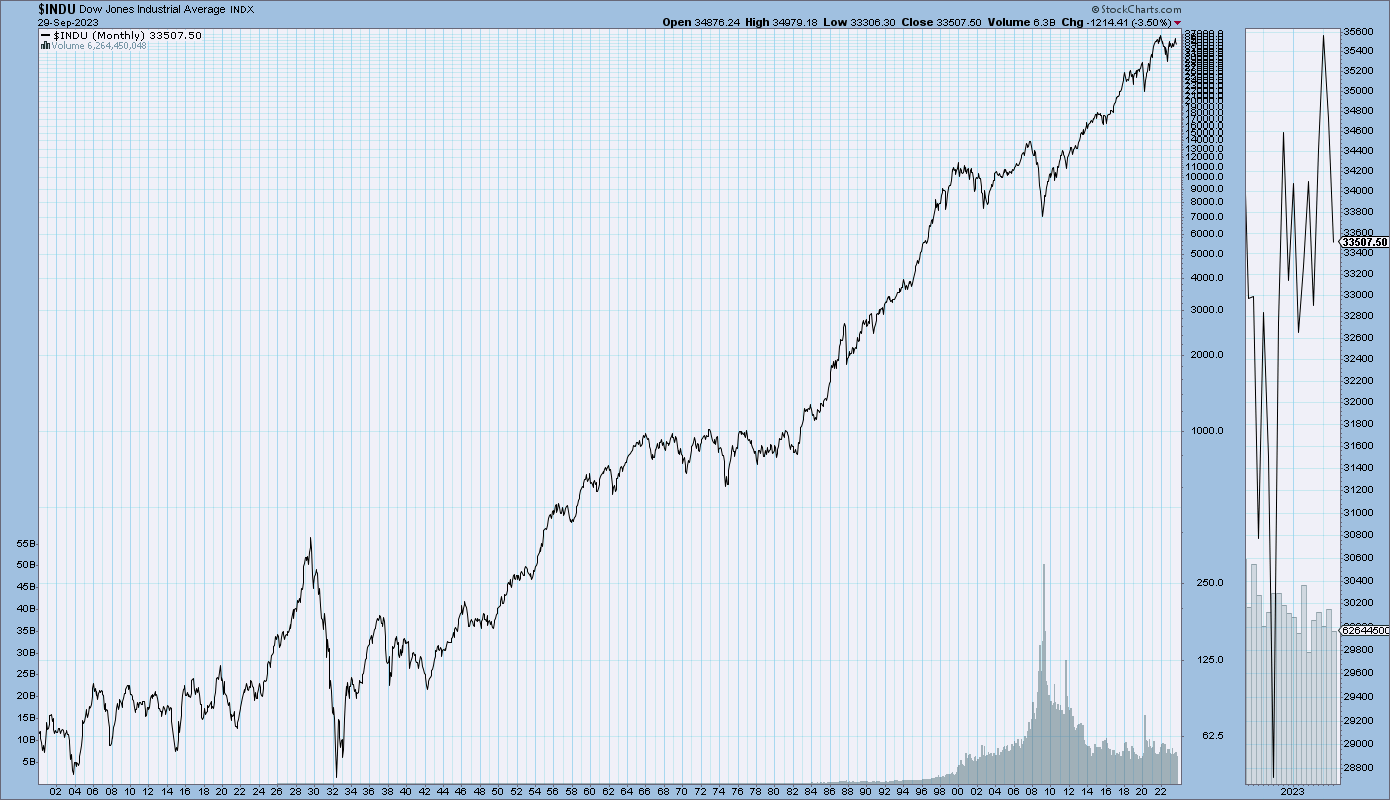
–
The Dow Jones Transportation Average, from 1900 – September 29, 2023:
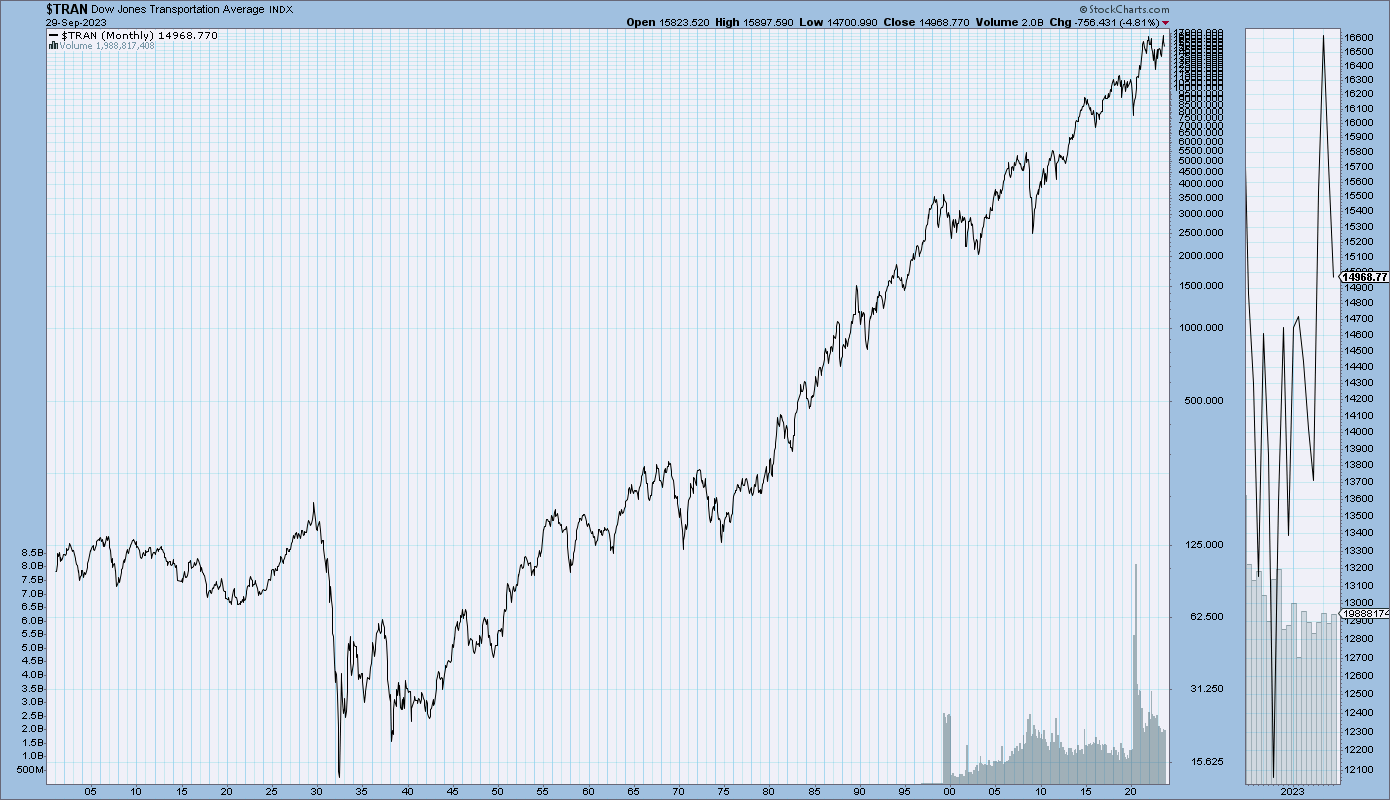
–
The S&P500, from 1925 – September 29, 2023:
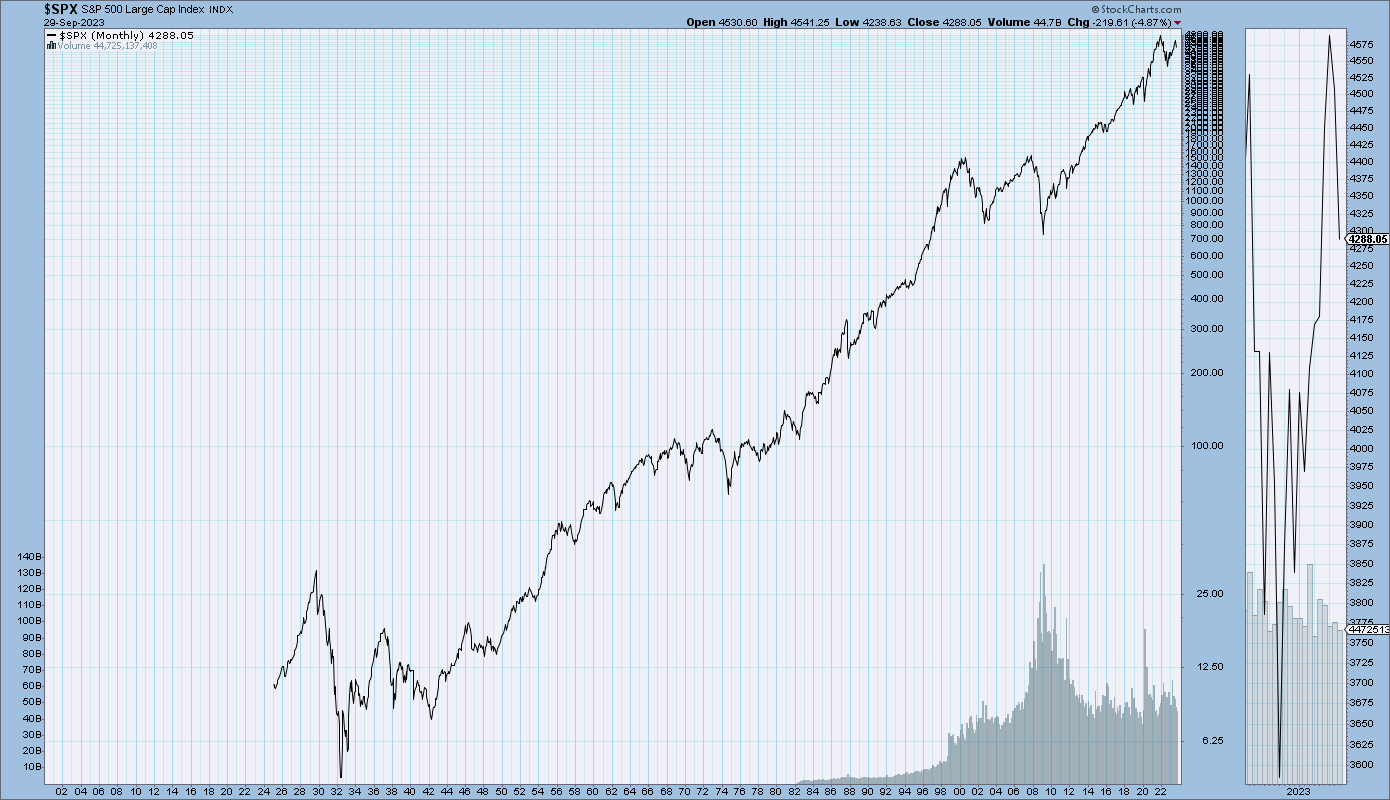
–
The Nasdaq Composite, from 1978 – September 29, 2023:
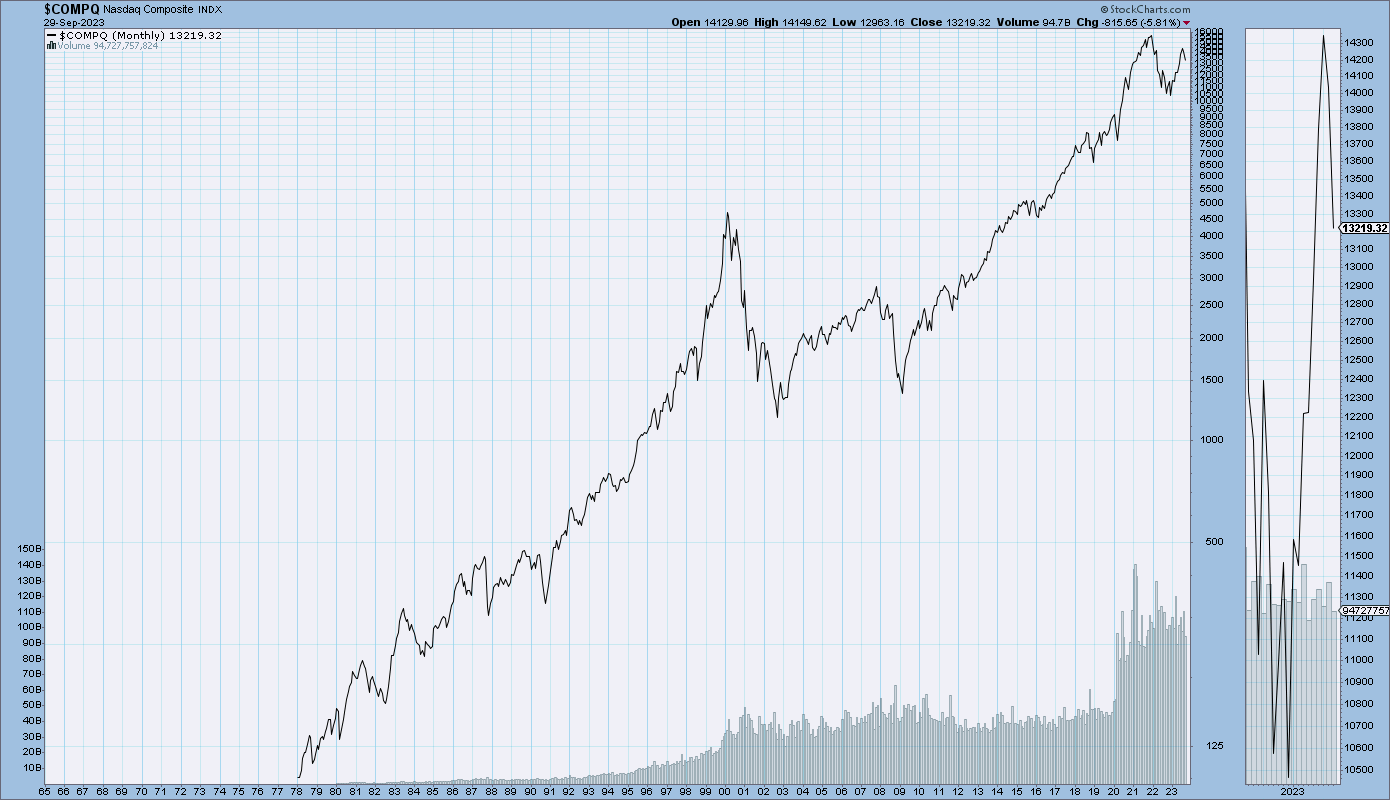
_____
The Special Note summarizes my overall thoughts about our economic situation
SPX at 4288.05 as this post is written
No comments:
Post a Comment