Thursday, July 9, 2015

CEO Confidence Surveys 2Q 2015 – Notable Excerpts

On July 8, 2015, The Conference Board and PwC released the 2nd Quarter Measure Of CEO Confidence.   The overall measure of CEO Confidence was at 58, up from 57 in the first quarter. [note:  a reading of more than 50 points reflects more positive than negative responses]
Notable excerpts from this July 8 Press Release include:
CEOs’ appraisal of current economic conditions was less positive than last quarter. Now, just 46 percent claim conditions are better compared to six months ago, down from 55 percent in the first quarter of the year. However, business leaders’ assessment of conditions in their own industries was more positive, with 49 percent saying conditions in their own industries have improved, compared with 35 percent in the prior quarter.
CEOs were more optimistic overall regarding the short-term outlook than earlier this year. Slightly over 38 percent of business leaders anticipate economic conditions will improve over the next six months, up marginally from last quarter. Expectations for their own industries were more upbeat, with 40 percent of CEOs anticipating an improvement versus 34 percent in the first quarter of this year.
The Business Roundtable last month also released its CEO Economic Outlook Survey for the 2nd Quarter of 2015.   Notable excerpts from the June 8 release, titled “CEO Economic Outlook Dims for Second Half of 2015”:
CEOs have tempered business plans for capital investment and hiring, reflecting concerns about the continued sub-par growth trajectory of the U.S. economy, according to the Business Roundtable second quarter 2015 CEO Economic Outlook Survey, released today.
also:
CEOs said that they expect sales, investment and hiring to decrease almost 10 points, 9.8 points and 8.9 points, respectively, in the next six months. And they expect GDP growth of 2.5 percent in 2015, 0.3 percentage point lower than last quarter. Importantly, the survey was conducted prior to the Commerce Department’s recently released Q1 GDP downward revision to negative 0.7 percent, a contraction of 0.9 percent from their advance estimate.
also:
The Business Roundtable CEO Economic Outlook Index – a composite index of CEO plans for the next six months of sales, capital spending and employment – declined from 90.8 in the first quarter of 2015 to 81.3 in the second quarter of 2015. The long-term average of the Index is 80.5.
_____
I post various economic forecasts because I believe they should be carefully monitored.  However, as those familiar with this blog are aware, I do not necessarily agree with many of the consensus estimates and much of the commentary in these forecast surveys.
_____
The Special Note summarizes my overall thoughts about our economic situation
SPX at 2058.33 as this post is written

Broad-Based Indicators Of Economic Activity

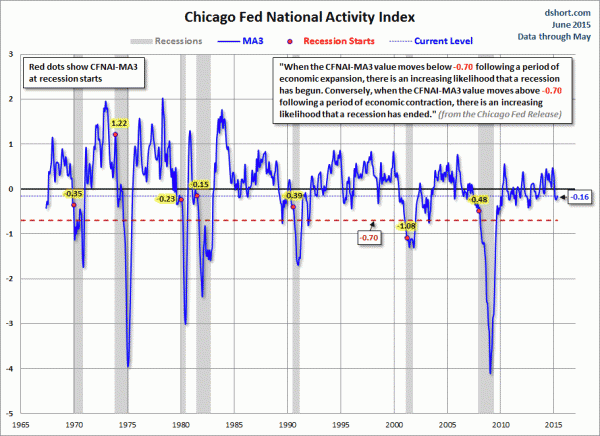
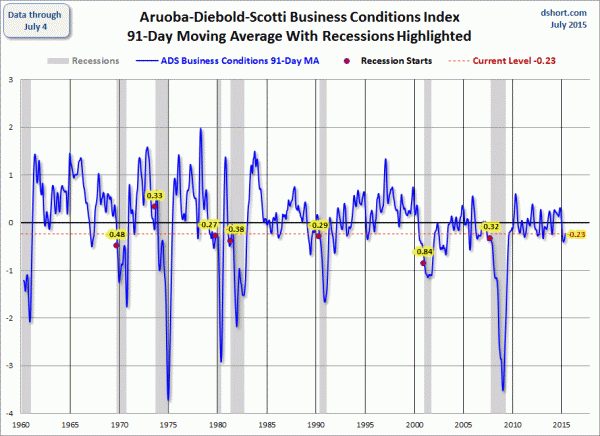
The Chicago Fed National Activity Index (CFNAI) and the Aruoba-Diebold-Scotti Business Conditions Index (ADS Index) are two broad-based economic indicators that I regularly feature in this site.
The short-term and long-term trends of each continue to be notable.
Doug Short, in his blog post of July 9, 2015, titled “Today's Update:  The Philly Fed ADS Index Business Conditions Index” displays both the CFNAI MA-3 (3-month Moving Average) and ADS Index (91-Day Moving Average) from a variety of perspectives.
Of particular note, two of the charts, shown below, denote where the current levels of each reading is relative to the beginning of past recessionary periods, as depicted by the red dots.
The CFNAI MA-3:
(click on charts to enlarge images)
CFNAI-MA3
The ADS Index, 91-Day MA:
ADS Index
Also shown in the Doug Short’s aforementioned post is a chart of each with a long-term trendline (linear regression) as well as a chart depicting GDP for comparison purposes.
_________
I post various indicators and indices because I believe they should be carefully monitored.  However, as those familiar with this blog are aware, I do not necessarily agree with what they depict or imply.
_____
The Special Note summarizes my overall thoughts about our economic situation
SPX at 2058.74 as this post is written

Median Household Income Chart

I have written many blog posts concerning the worrisome trends in income and earnings.
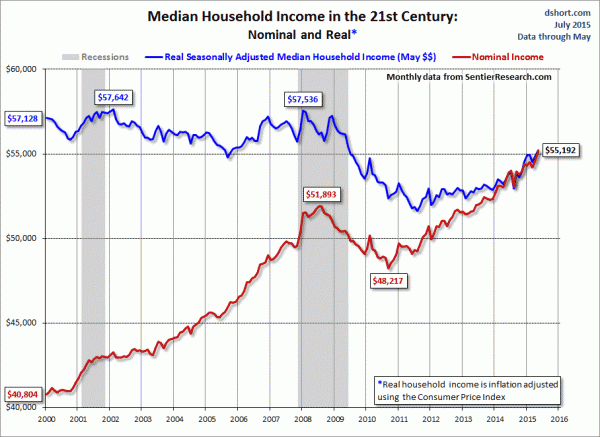
Doug Short, in his July 8, 2015 post titled “Median Household Income Rose Again in May” produced the chart below.  It is based upon data from Sentier Research, and it shows both nominal and real median household incomes since 2000, as depicted.  As one can see, post-recession real median household income (seen in the blue line since 2009) is especially worrisome.
(click on chart to enlarge image)
median household income
As Doug mentions in his aforementioned post:
As the excellent data from Sentier Research makes clear, the mainstream U.S. household was struggling before the Great Recession. At this point, real household incomes are in worse shape than they were in mid-2009 when the recession ended.
Among other items seen in his blog post is a chart depicting each of the two (nominal and real household incomes) data series’ percent change over time since 2000.
_____
The Special Note summarizes my overall thoughts about our economic situation
SPX at 2046.68 as this post is written

Building Financial Danger – July 9, 2015 Update

On October 17, 2011 I wrote a post titled “Danger Signs In The Stock Market, Financial System And Economy.”  This post is a brief 50th update to that post.
My overall analysis indicates a continuing elevated and growing level of financial danger which contains many worldwide and U.S.-specific “stresses” of a very complex nature. I have written numerous posts in this blog of some of what I consider both ongoing and recent “negative developments.”  These developments, as well as other exceedingly problematic conditions, have presented a highly perilous economic environment that endangers the overall financial system.
Also of ongoing immense importance is the existence of various immensely large asset bubbles, a subject of which I have extensively written.  While all of these asset bubbles are wildly pernicious and will have profound adverse future implications, hazards presented by the bond market bubble are especially notable.
Predicting the specific timing and extent of a stock market crash is always difficult, and the immense complexity of today’s economic situation makes such a prediction even more challenging. With that being said, my analyses indicate that the danger inherent in the financial system has surpassed the level at which a near-term outsized (from an ultra-long term perspective) stock market crash – that would also involve (as seen in 2008) various other markets as well – is of tremendous concern.
(note: the “next crash” has great significance and implications, as discussed in the post of January 6, 2012 titled “The Next Crash And Its Significance“ and various subsequent posts in the “Economic Depression” category)
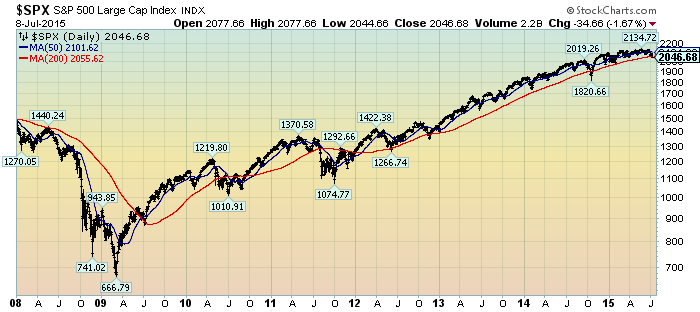
As reference, below is a daily chart since 2008 of the S&P500 (through July 8, 2015 with a last price of 2046.68), depicted on a LOG scale, indicating both the 50dma and 200dma as well as price labels:
(click on chart to enlarge image)(chart courtesy of StockCharts.com; chart creation and annotation by the author)
S&P500 since 2008
_____
The Special Note summarizes my overall thoughts about our economic situation
SPX at 2046.68 as this post is written

Wednesday, July 8, 2015

Chicago Fed National Financial Conditions Index (NFCI)

The St. Louis Fed’s Financial Stress Index (STLFSI) is one index that is supposed to measure stress in the financial system.  Its reading as of the July 2, 2015 update (reflecting data through June 26) is -1.053.
Of course, there are a variety of other measures and indices that are supposed to measure financial stress and other related issues, both from the Federal Reserve as well as from private sources.
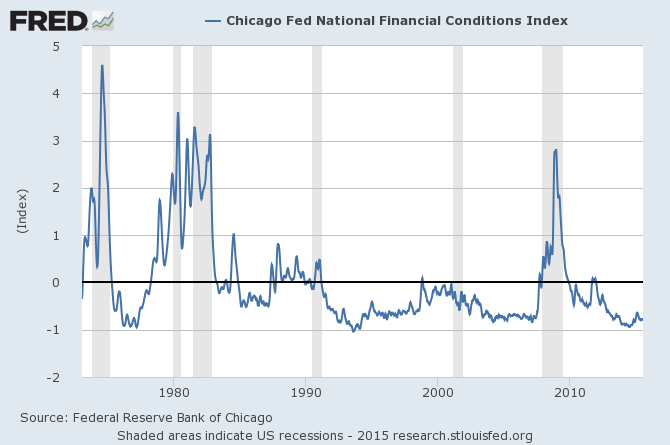
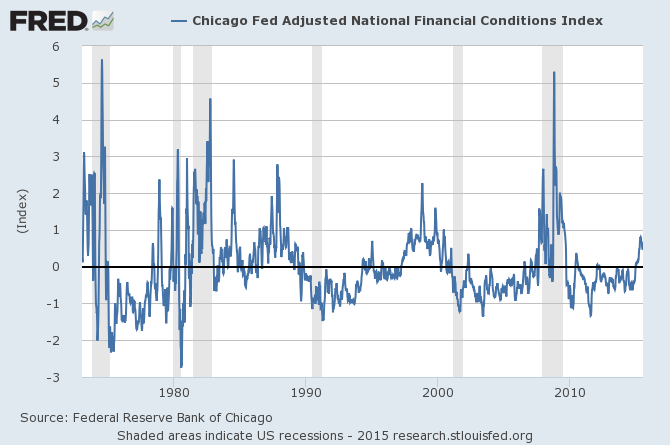
Two other indices that I regularly monitor include the Chicago Fed National Financial Conditions Index (NFCI) as well as the Chicago Fed Adjusted National Financial Conditions Index (ANFCI).
Here are summary descriptions of each, as seen in FRED:
The National Financial Conditions Index (NFCI) measures risk, liquidity and leverage in money markets and debt and equity markets as well as in the traditional and “shadow” banking systems. Positive values of the NFCI indicate financial conditions that are tighter than average, while negative values indicate financial conditions that are looser than average.
The adjusted NFCI (ANFCI). This index isolates a component of financial conditions uncorrelated with economic conditions to provide an update on how financial conditions compare with current economic conditions.
For further information, please visit the Federal Reserve Bank of Chicago’s web site:
Below are the most recently updated charts of the NFCI and ANFCI, respectively.
The NFCI chart below was last updated on July 8, 2015 incorporating data from January 5,1973 to July 3, 2015, on a weekly basis.  The July 3, 2015 value is -.77:
(click on chart to enlarge image)
NFCI_7-8-15
Data Source: FRED, Federal Reserve Economic Data, Federal Reserve Bank of St. Louis; accessed July 8, 2015:
The ANFCI chart below was last updated on July 8, 2015 incorporating data from January 5,1973 to July 3, 2015, on a weekly basis.  The July 3 value is .51:
ANFCI_7-8-15
Data Source: FRED, Federal Reserve Economic Data, Federal Reserve Bank of St. Louis; accessed July 8, 2015:
_________
I post various indicators and indices because I believe they should be carefully monitored.  However, as those familiar with this blog are aware, I do not necessarily agree with what they depict or imply.
_____
The Special Note summarizes my overall thoughts about our economic situation
SPX at 2058.53 as this post is written

Tuesday, July 7, 2015

July 7, 2015 Gallup Poll Results On Economic Confidence – Notable Excerpts

On July 7, 2015 Gallup released the poll results titled “U.S. Economic Confidence Index Holds at Seven-Month Low.”
Notable excerpts include:
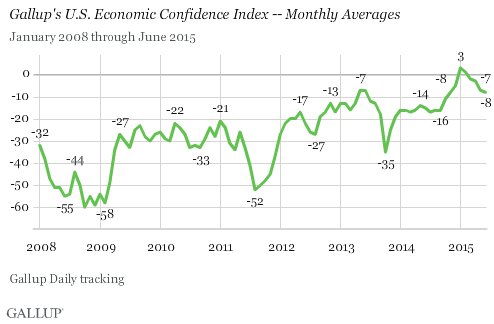
Gallup's U.S. Economic Confidence Index was essentially steady in June, averaging -8 for the month. This is statistically tied with May's -7 score, keeping the index at its lowest monthly reading since November.
also:
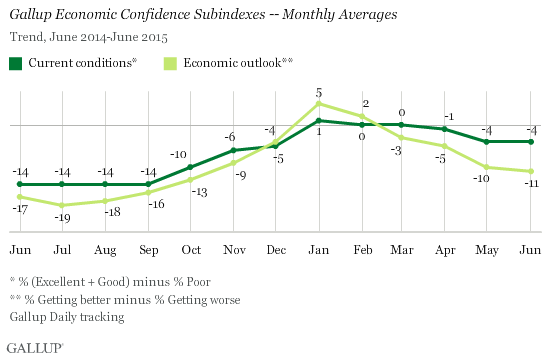
Gallup's Economic Confidence Index is the average of two components: Americans' ratings of current economic conditions and whether they feel the economy is improving or getting worse.
The economic outlook component score was -11 in June, based on 42% of Americans saying the economy is getting better and 53% saying it is getting worse. This is similar to the -10 found in May, and is the lowest monthly economic outlook score in Gallup Daily tracking since October.
Meanwhile, the current conditions score in June was -4 -- the same as in May -- based on 25% of Americans saying the economy is "excellent" or "good" and 29% calling it "poor."
Here is an accompanying chart of the two components (Sub-Indexes) of the Gallup Economic Confidence Index, discussed above:
Gallup U.S. Economic Confidence Subindexes - Monthly Averages
Here is an accompanying chart of the Gallup Economic Confidence Index:
 Gallup U.S. Economic Confidence Index - Monthly Averages

_____
The Special Note summarizes my overall thoughts about our economic situation
SPX at 2060.33 as this post is written

Deflation Probabilities – July 6, 2015 Update

While I do not agree with the current readings of the measure – I think the measure dramatically understates the probability of deflation, as measured by the CPI – the Federal Reserve Bank of Atlanta maintains an interesting data series titled “Deflation Probabilities.”
As stated on the site:
Using estimates derived from Treasury Inflation-Protected Securities (TIPS) markets, described in a technical appendix, this weekly report provides two measures of the probability of consumer price index (CPI) deflation through 2020.
A chart shows the trends of the probabilities.  As one can see in the chart, the readings are volatile.
As for the current weekly reading, the July 6, 2015 update states the following:
The estimates of 2015–20 deflation probabilities—based on the 5-year TIPS issued in April and the 10-year TIPS issued in July 2010—have all been 0 percent for April 30 through July 2. The 2014–19 deflation probability is also 0 percent as of July 2.
Prices of Treasury Inflation-Protected Securities (TIPS) with similar maturity dates can be used to measure probabilities of a net decline in the consumer price index over the five-year period starting in early 2014 or the five-year period starting in early 2015.
I plan on providing updates to this measure on a regular interval.
_________
I post various economic indicators and indices because I believe they should be carefully monitored.  However, as those familiar with this blog are aware, I do not necessarily agree with what they depict or imply.
_____
The Special Note summarizes my overall thoughts about our economic situation
SPX at 2068.76 this post is written

Recession Probability Models – July 2015

There are a variety of economic models that are supposed to predict the probabilities of recession.
While I don’t agree with the methodologies employed or probabilities of impending economic weakness as depicted by the following two models, I think the results of these models should be monitored.
Please note that each of these models is updated regularly, and the results of these – as well as other recession models – can fluctuate significantly.
The first is the “Yield Curve as a Leading Indicator” from the New York Federal Reserve.  I wrote a post concerning this measure on March 1, 2010, titled “The Yield Curve as a Leading Indicator.”
Currently (last updated July 2, 2015 using data through June) this “Yield Curve” model shows a 2.2% probability of a recession in the United States twelve months ahead.  For comparison purposes, it showed a 2.79% probability through May, and a chart going back to 1960 is seen at the “Probability Of U.S. Recession Predicted by Treasury Spread.” (pdf)
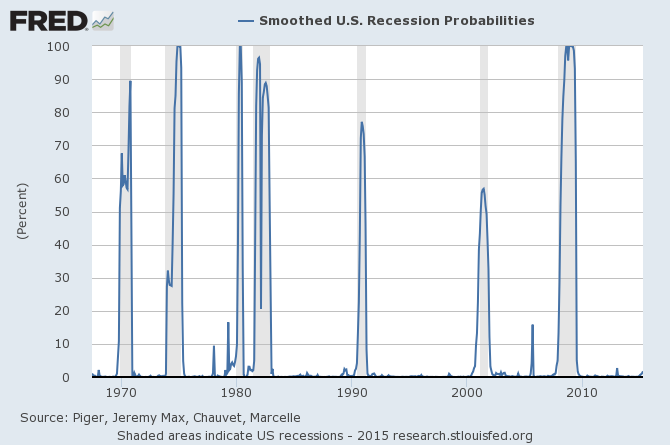
The second model is from Marcelle Chauvet and Jeremy Piger.  This model is described on the St. Louis Federal Reserve site (FRED) as follows:
Smoothed recession probabilities for the United States are obtained from a dynamic-factor markov-switching model applied to four monthly coincident variables: non-farm payroll employment, the index of industrial production, real personal income excluding transfer payments, and real manufacturing and trade sales. This model was originally developed in Chauvet, M., “An Economic Characterization of Business Cycle Dynamics with Factor Structure and Regime Switching,” International Economic Review, 1998, 39, 969-996. (http://faculty.ucr.edu/~chauvet/ier.pdf)
Additional details and explanations can be seen on the “U.S. Recession Probabilities” page.
This model, last updated on July 1, 2015, currently shows a 1.72% probability using data through April.
Here is the FRED chart (last updated July 1, 2015):
recession probabilities
Data Source:  Piger, Jeremy Max and Chauvet, Marcelle, Smoothed U.S. Recession Probabilities [RECPROUSM156N], retrieved from FRED, Federal Reserve Bank of St. Louis, accessed July 5, 2015:
The two models featured above can be compared against measures seen in recent blog posts.  For instance, as seen in the June 12 post titled “The June 2015 Wall Street Journal Economic Forecast Survey“ economists surveyed averaged a 10.33% probability of a U.S. recession within the next 12 months.
_____
The Special Note summarizes my overall thoughts about our economic situation
SPX at 2068.76 as this post is written