For a variety of reasons, I am not as enamored with ECRI’s WLI and WLI Growth measures as many are.
However, I do think the measures are important and deserve close monitoring and scrutiny.
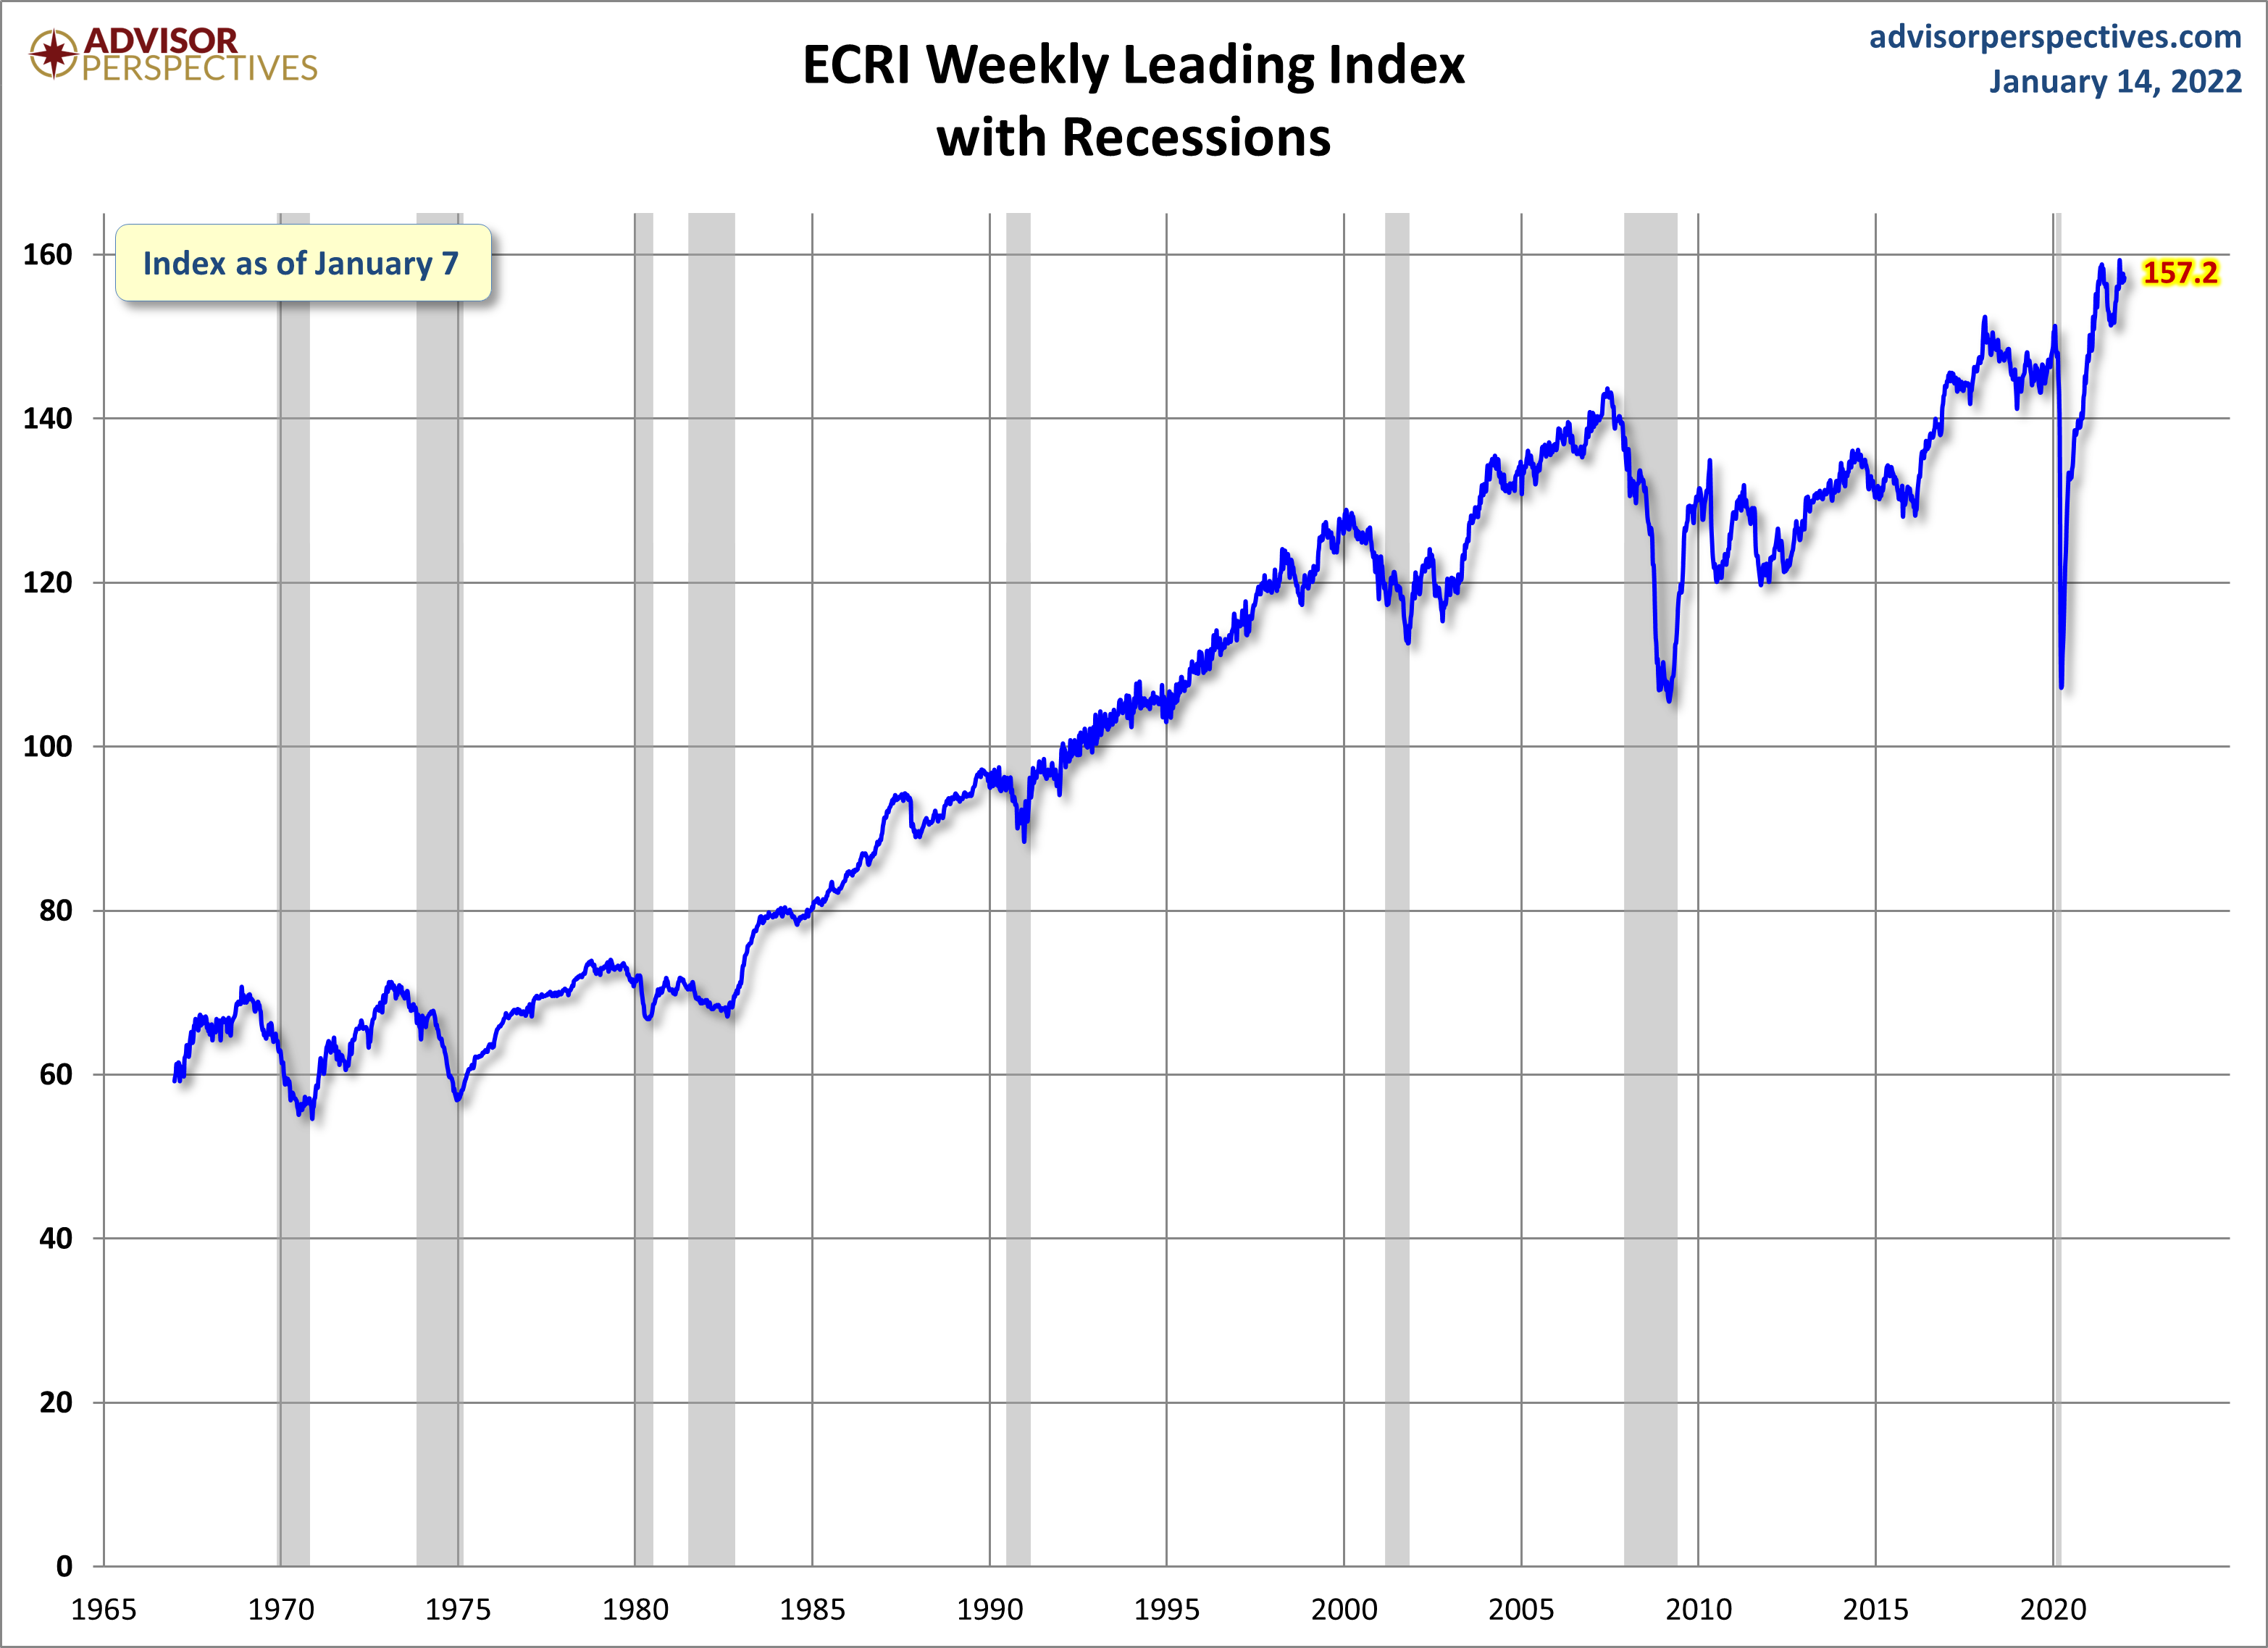
Below are three long-term charts, from Advisor Perspectives’ ECRI update post of January 14, 2022 titled “ECRI Weekly Leading Index Update.” These charts are on a weekly basis as of the January 14, 2022 release, reflecting data through January 7, 2022.
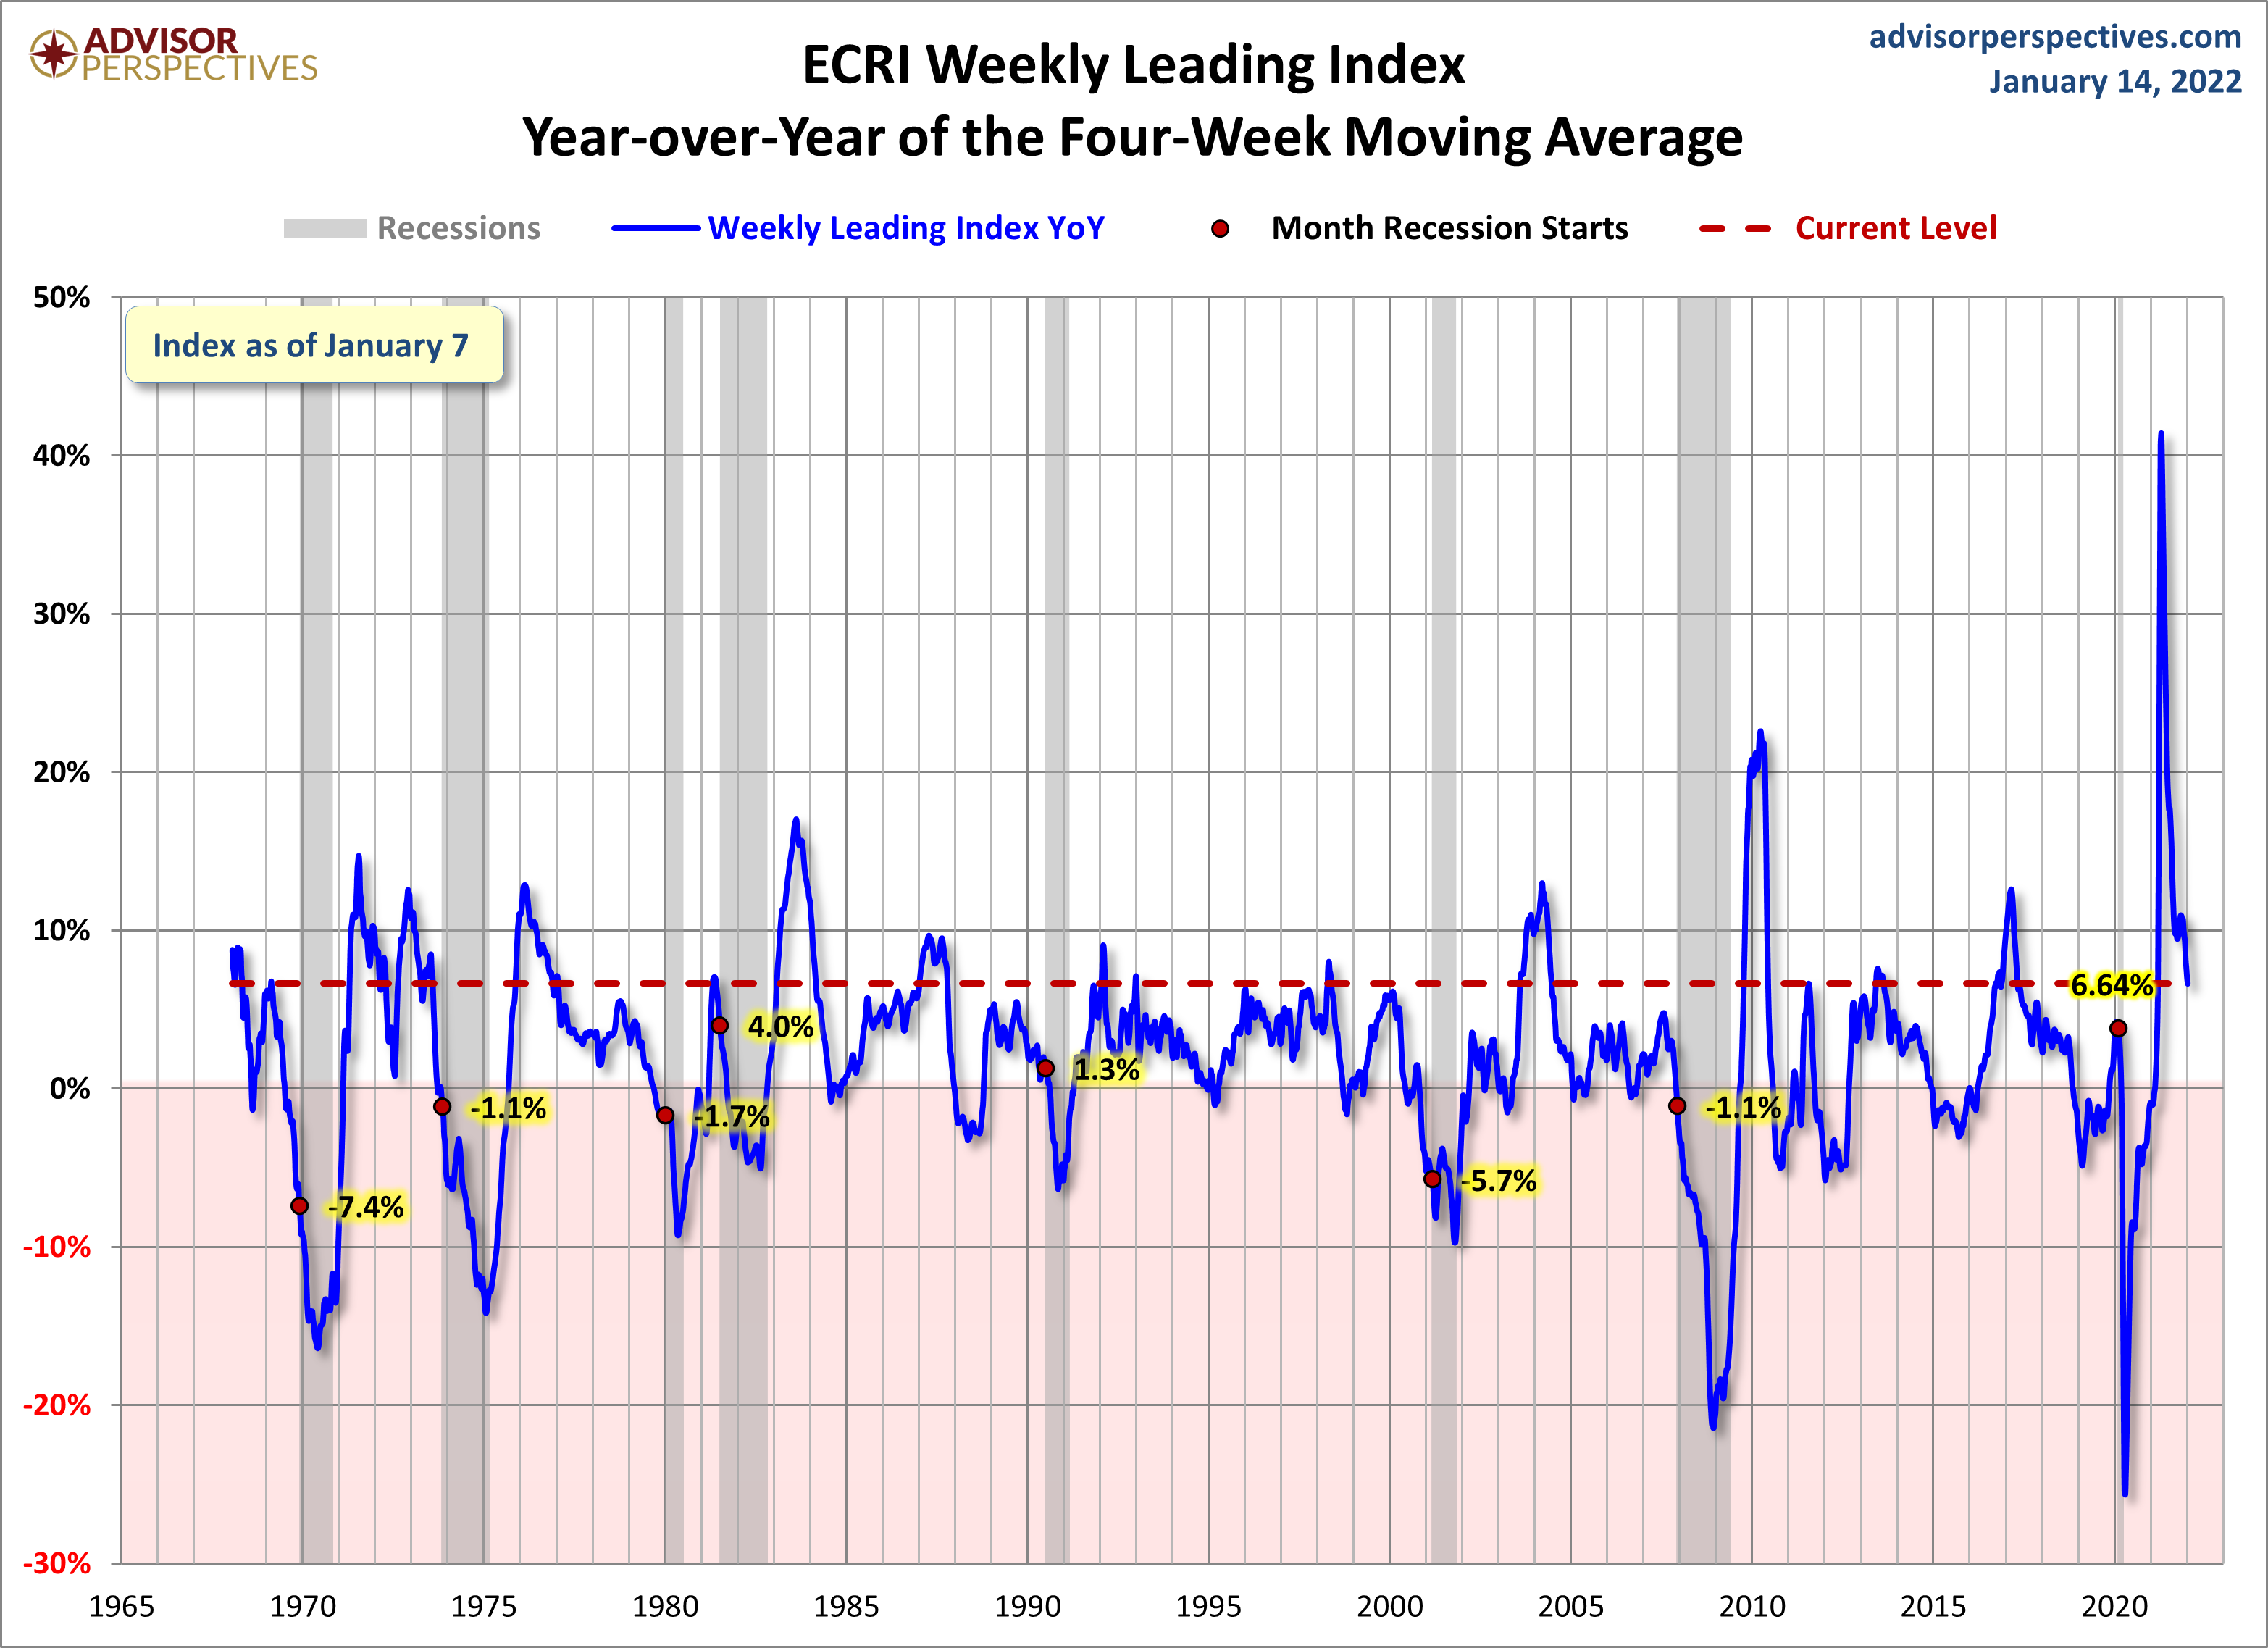
This next chart depicts, on a long-term basis, the Year-over-Year change in the 4-week moving average of the WLI:
–
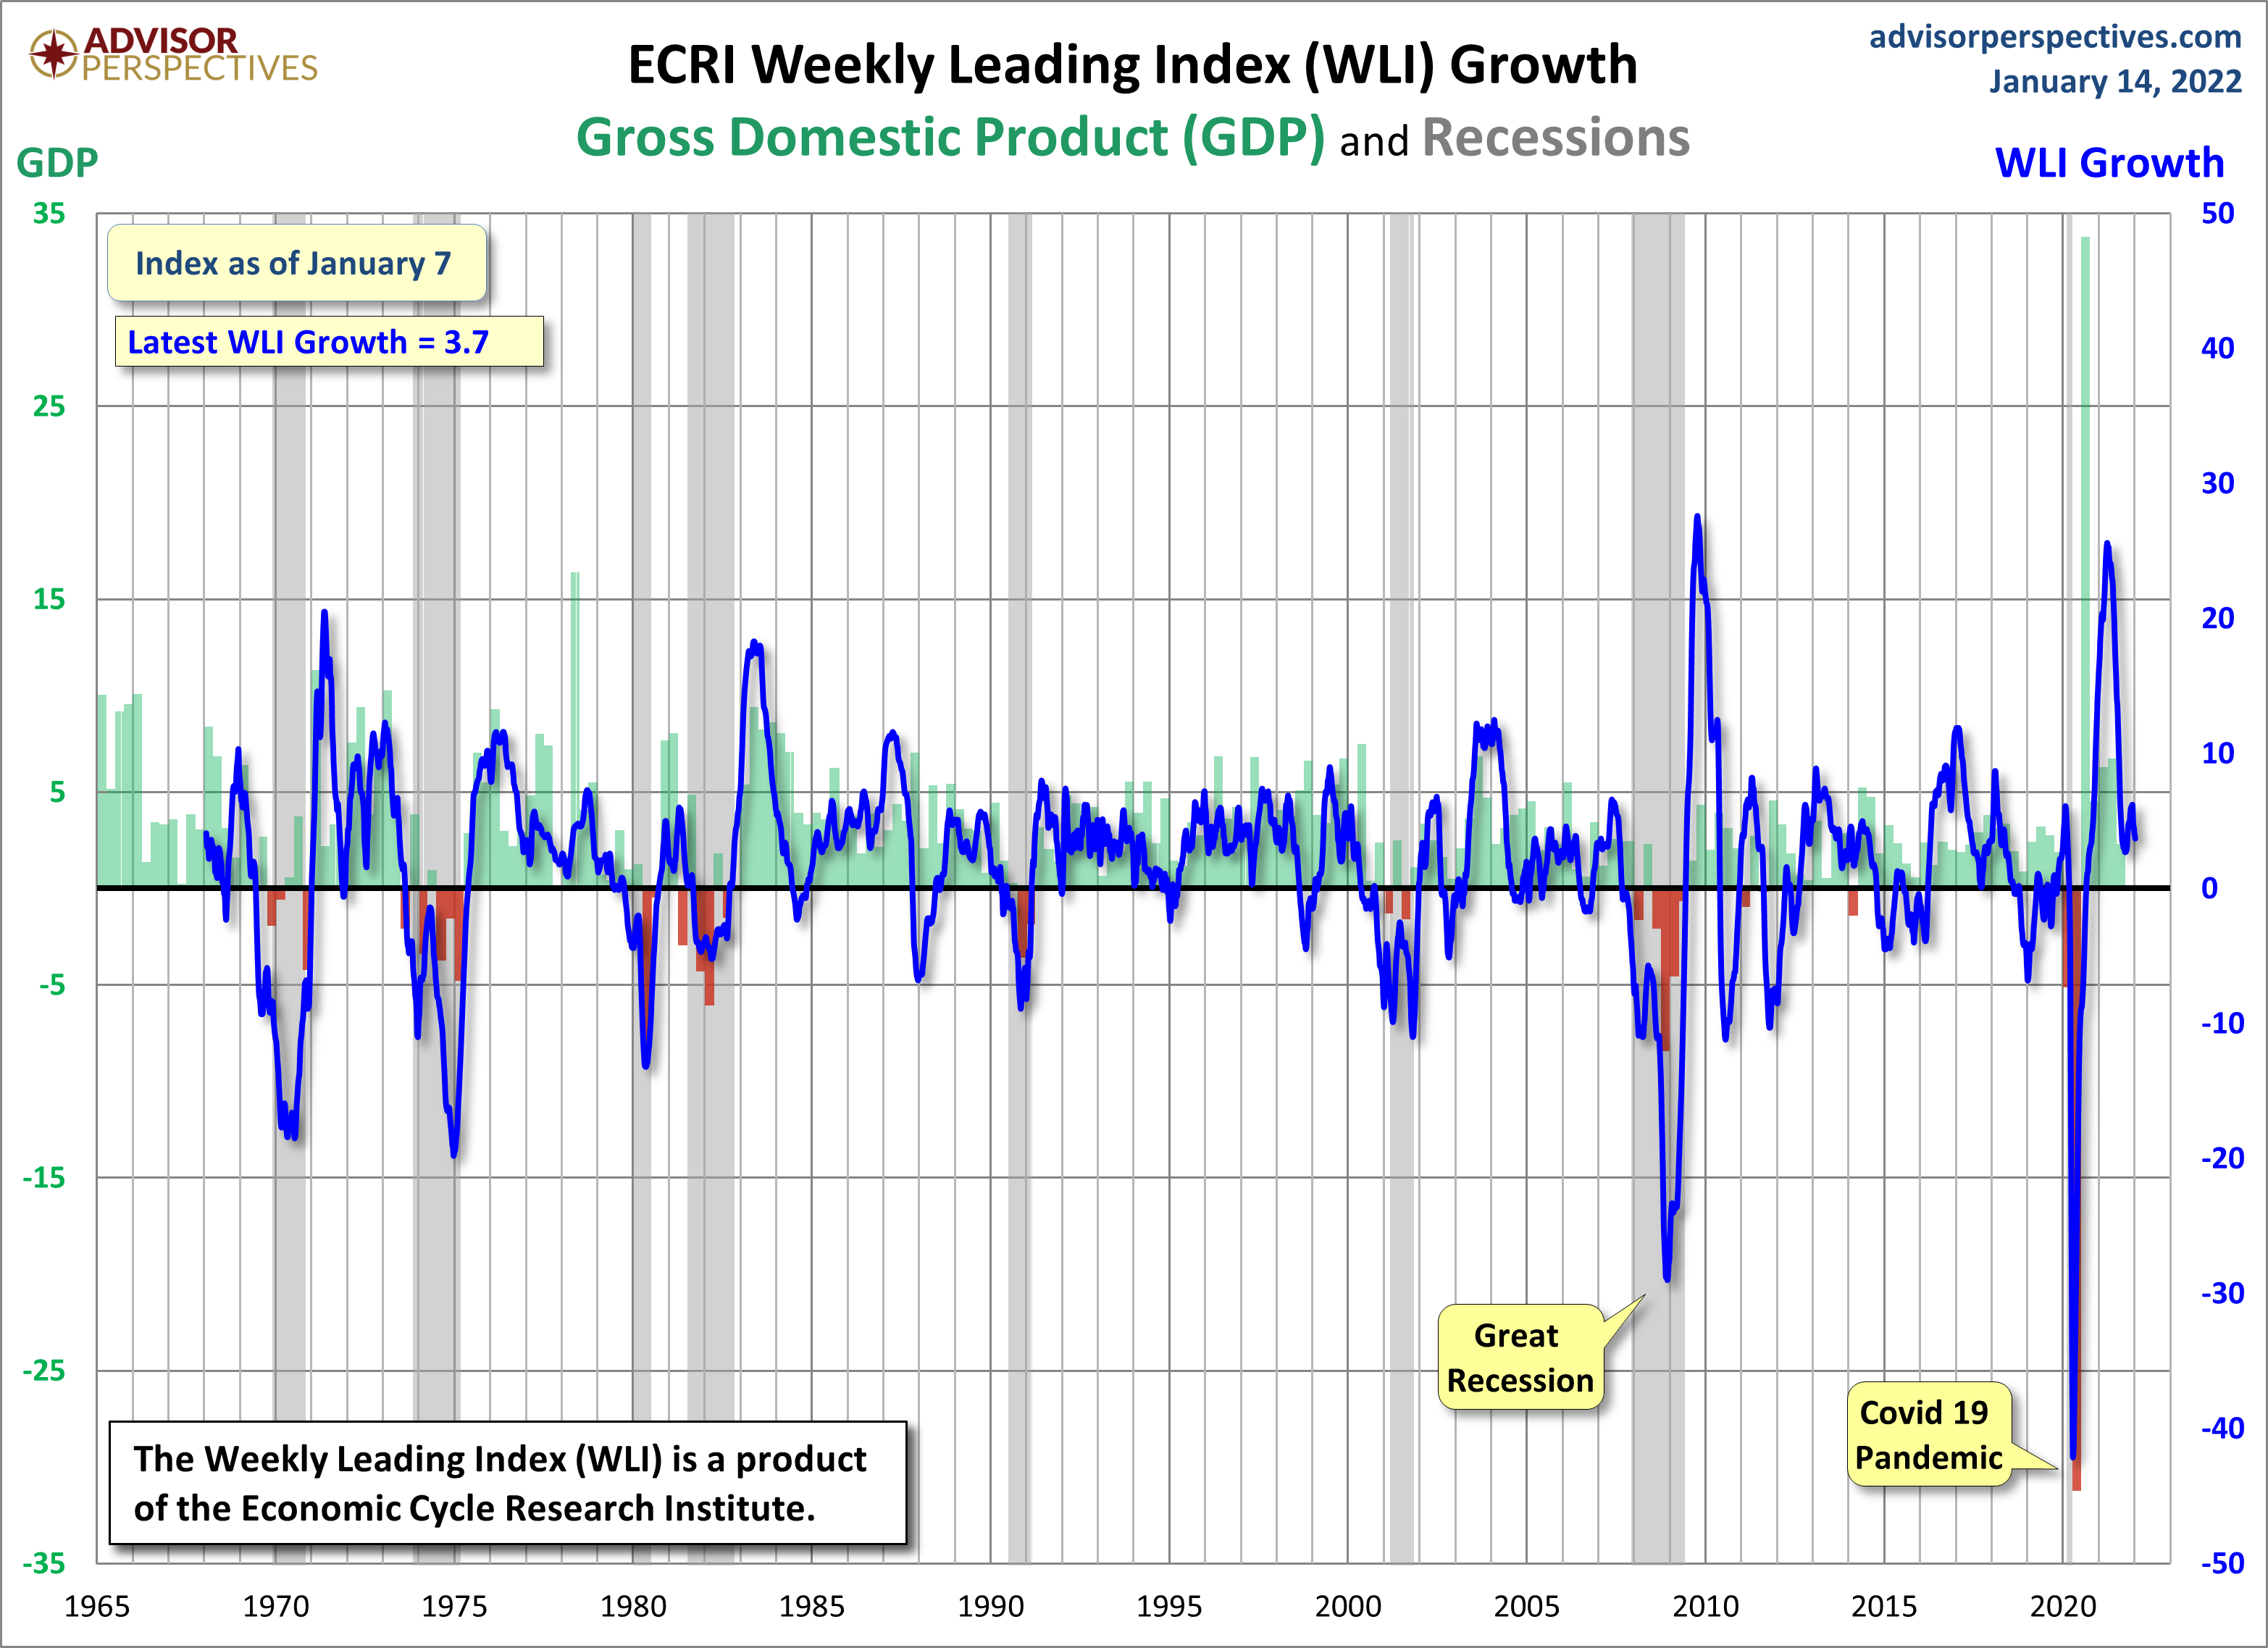
This last chart depicts, on a long-term basis, the WLI, Gr.:
_________
I post various economic indicators and indices because I believe they should be carefully monitored. However, as those familiar with this site are aware, I do not necessarily agree with what they depict or imply.
_____
The Special Note summarizes my overall thoughts about our economic situation
The following is the latest update of 10 charts that depict various aspects of the U.S. economic and financial situation.
I find these charts portray disturbing long-term trends. These trends have been in effect for years.
These charts raise a lot of questions. As well, they highlight the “atypical” nature of our economic situation from a long-term historical perspective.
All of these charts are from the Federal Reserve, and represent the most recently updated data.
(click on charts to enlarge images)
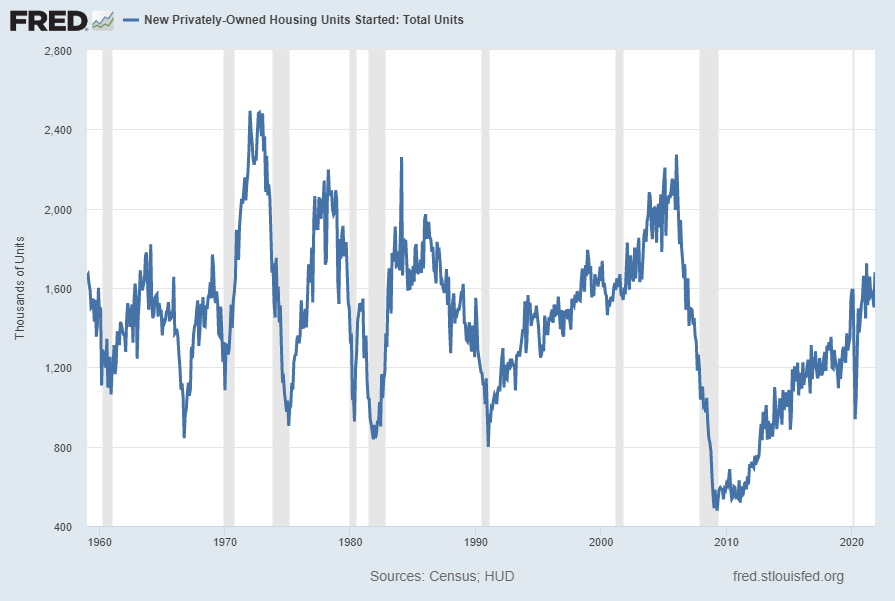
Housing starts (last updated December 16, 2021):
U.S. Bureau of the Census, Housing Starts: Total: New Privately Owned Housing Units Started [HOUST], retrieved from FRED, Federal Reserve Bank of St. Louis https://research.stlouisfed.org/fred2/series/HOUST/, January 13, 2022.
–
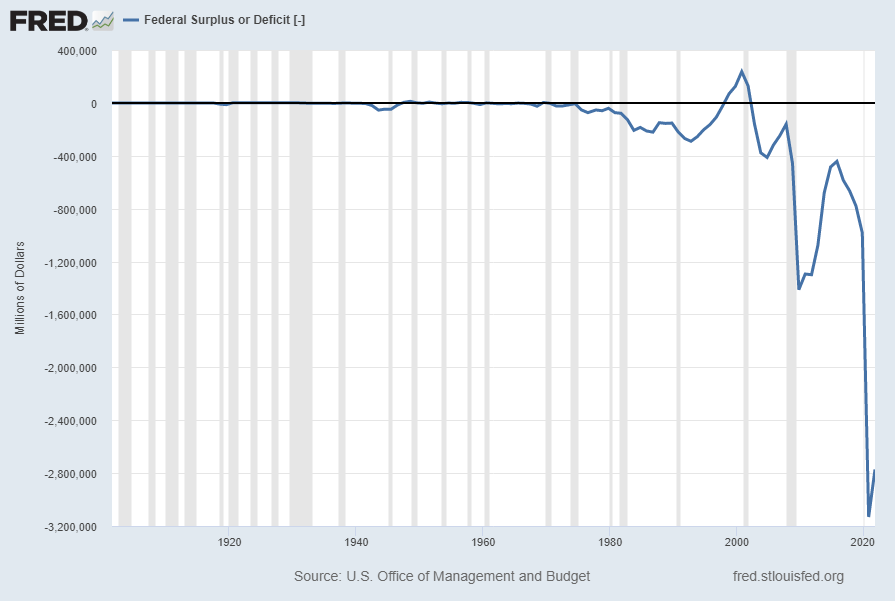
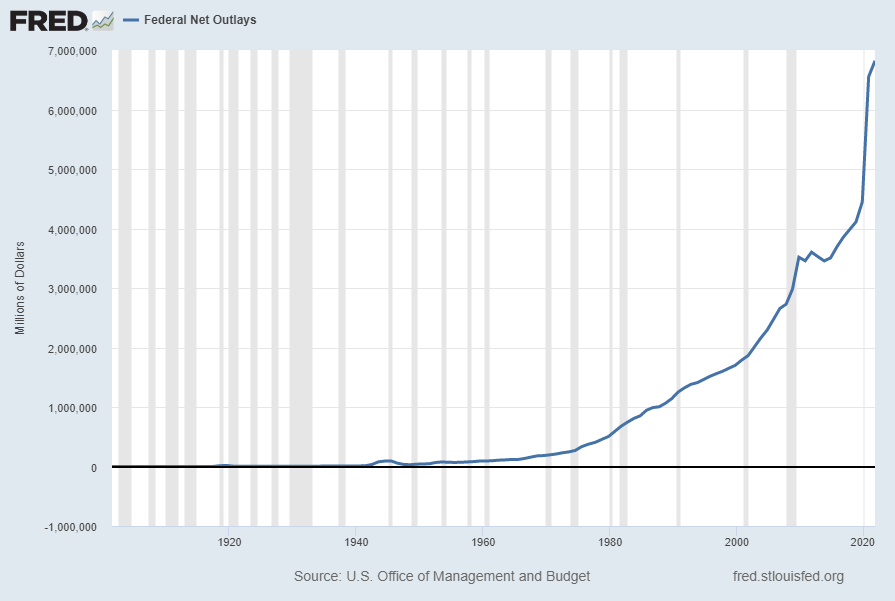
The Federal Deficit (last updated October 25, 2021):
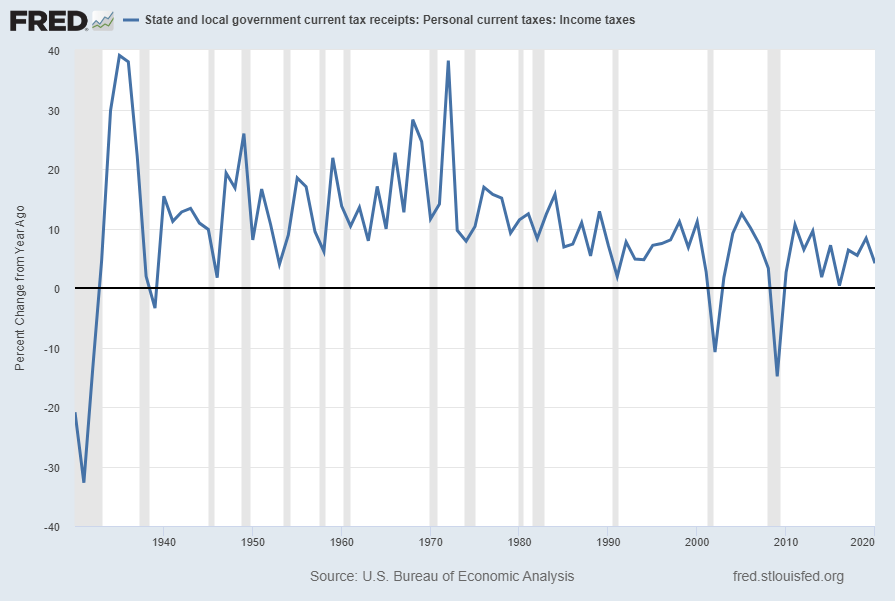
State & Local Personal Income Tax Receipts (% Change from Year Ago)(last updated July 29, 2021):
U.S. Bureau of Economic Analysis, State and local government current tax receipts: Personal current taxes: Income taxes [ASLPITAX], retrieved from FRED, Federal Reserve Bank of St. Louis https://research.stlouisfed.org/fred2/series/ASLPITAX/, January 13, 2022.
–
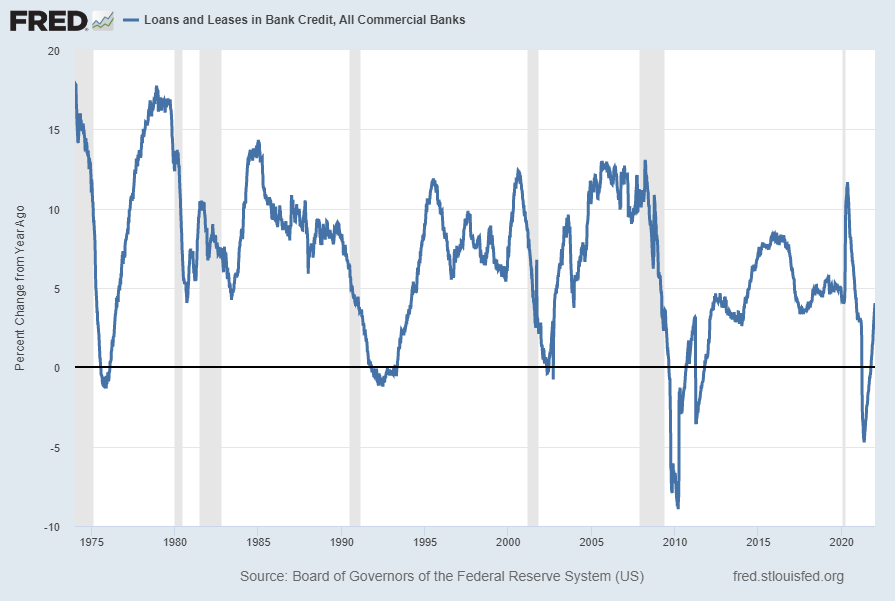
Total Loans and Leases of Commercial Banks (% Change from Year Ago)(last updated January 7, 2022):
Board of Governors of the Federal Reserve System (US), Loans and Leases in Bank Credit, All Commercial Banks [TOTLL], retrieved from FRED, Federal Reserve Bank of St. Louis https://research.stlouisfed.org/fred2/series/TOTLL/, January 13, 2022.
–
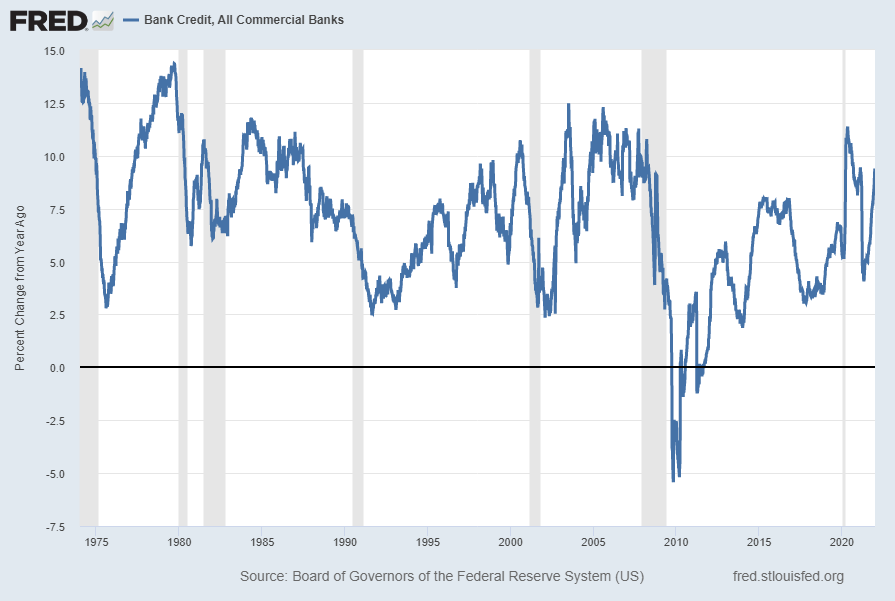
Bank Credit – All Commercial Banks (% Change from Year Ago)(last updated January 7, 2022):
Board of Governors of the Federal Reserve System (US), Bank Credit of All Commercial Banks [TOTBKCR], retrieved from FRED, Federal Reserve Bank of St. Louis https://research.stlouisfed.org/fred2/series/TOTBKCR/, January 13, 2022.
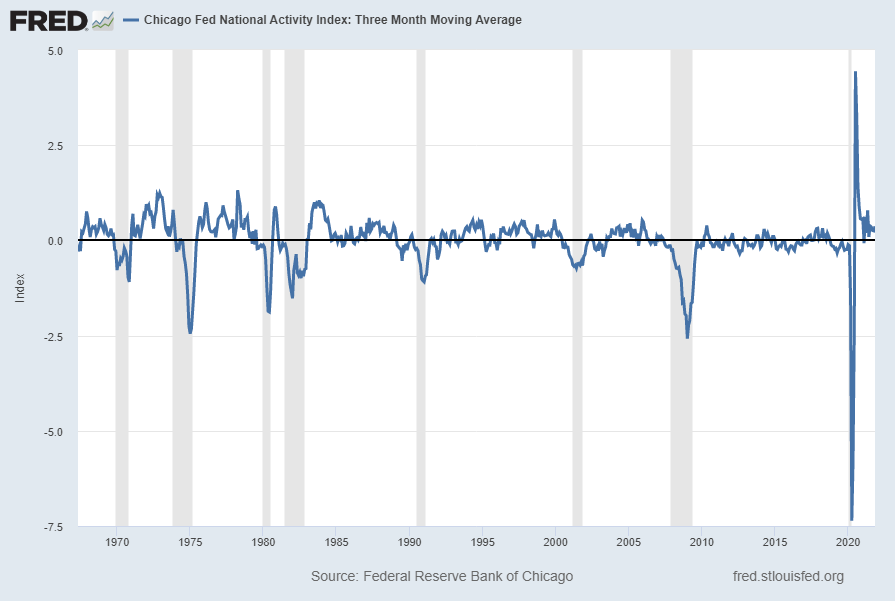
The Chicago Fed National Activity Index (CFNAI) Three Month Moving Average (CFNAI-MA3)(last updated December 22, 2021):
Federal Reserve Bank of Chicago, Chicago Fed National Activity Index: Three Month Moving Average [CFNAIMA3], retrieved from FRED, Federal Reserve Bank of St. Louis https://research.stlouisfed.org/fred2/series/CFNAIMA3/, January 13, 2022.
–
I will continue to update these charts on an intermittent basis as they deserve close monitoring…
_____
The Special Note summarizes my overall thoughts about our economic situation
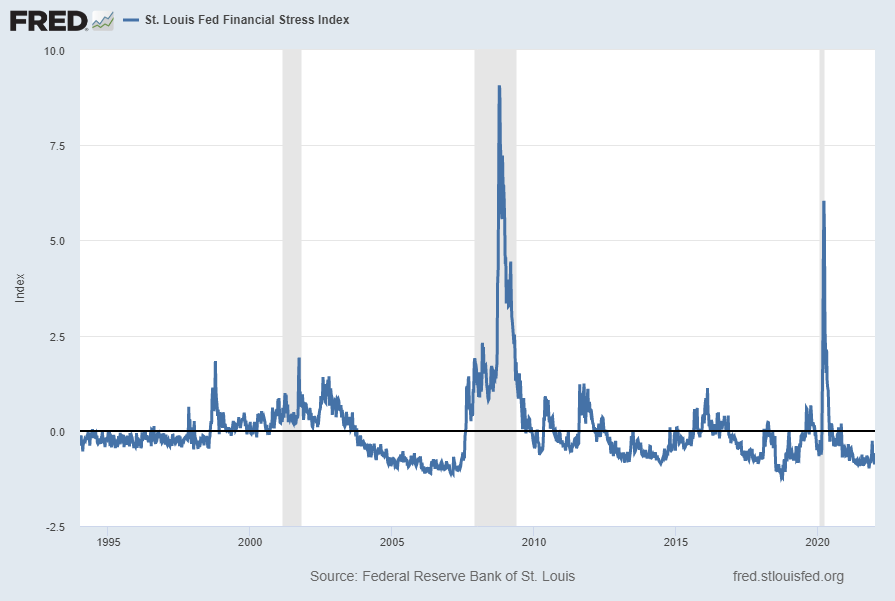
The St. Louis Fed’s Financial Stress Index (STLFSI3) is one index that is supposed to measure stress in the financial system. Its reading as of the January 13, 2022 update (reflecting data through January 7, 2022) is -.8245:
source: Federal Reserve Bank of St. Louis, St. Louis Fed Financial Stress Index [STLFSI3], retrieved from FRED, Federal Reserve Bank of St. Louis; accessed January 13, 2022: https://fred.stlouisfed.org/series/STLFSI3
Of course, there are a variety of other measures and indices that are supposed to measure financial stress and other related issues, both from the Federal Reserve as well as from private sources.
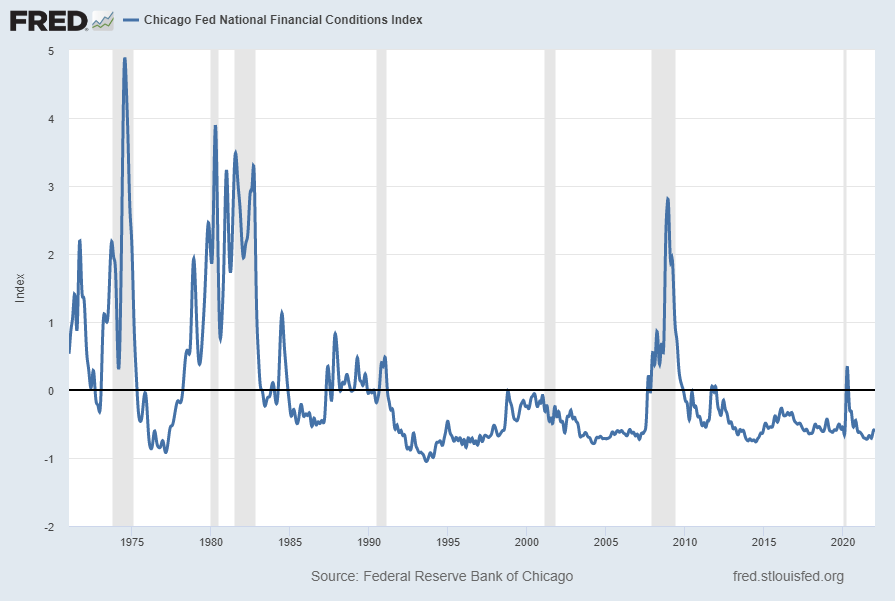
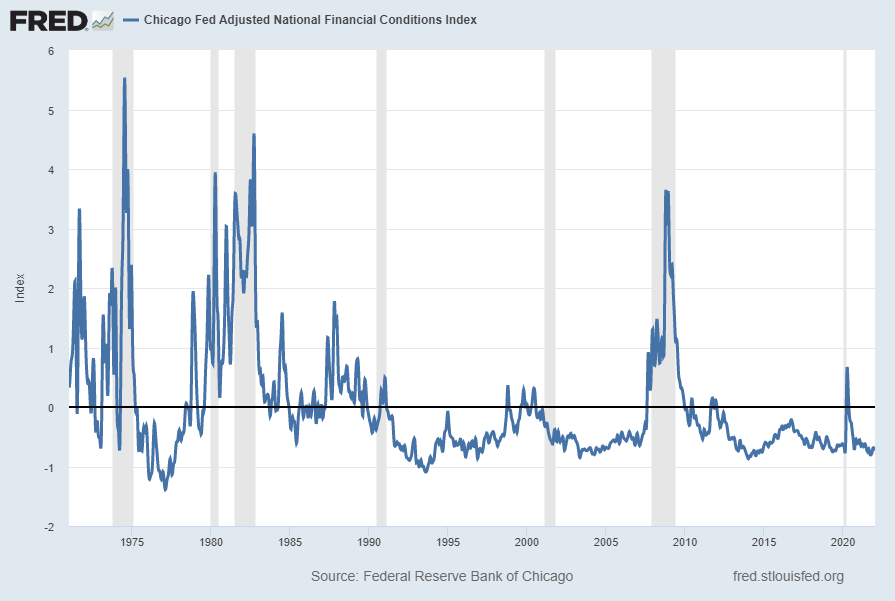
Two other indices that I regularly monitor include the Chicago Fed National Financial Conditions Index (NFCI) as well as the Chicago Fed Adjusted National Financial Conditions Index (ANFCI).
Here are summary descriptions of each, as seen in FRED:
The National Financial Conditions Index (NFCI) measures risk, liquidity and leverage in money markets and debt and equity markets as well as in the traditional and “shadow” banking systems. Positive values of the NFCI indicate financial conditions that are tighter than average, while negative values indicate financial conditions that are looser than average.
The adjusted NFCI (ANFCI). This index isolates a component of financial conditions uncorrelated with economic conditions to provide an update on how financial conditions compare with current economic conditions.
For further information, please visit the Federal Reserve Bank of Chicago’s web site:
Below are the most recently updated charts of the NFCI and ANFCI, respectively.
The NFCI chart below was last updated on January 12, 2022 incorporating data from January 8, 1971 through January 7, 2022 on a weekly basis. The January 7 value is -.61298:
The ANFCI chart below was last updated on January 12, 2022 incorporating data from January 8, 1971 through January 7, 2022, on a weekly basis. The January 7, 2022 value is -.70651:
I post various indicators and indices because I believe they should be carefully monitored. However, as those familiar with this site are aware, I do not necessarily agree with what they depict or imply.
_____
The Special Note summarizes my overall thoughts about our economic situation
Although every respondent in this latest survey expects nationwide home price appreciation to slow in 2022 from last year’s record-breaking pace, the average of their long-term projections remains among the most bullish outlooks for home values in ZHPES history. On average, panelists expect home values to grow another 6.6% this year, and by 23.5% over the coming five years.
“Although a handful of experts foresee a modest price correction on the horizon, none expect a crash, even as the confluence of unusual forces impacting U.S. housing markets continues to generate significant uncertainty,” said Pulsenomics founder Terry Loebs.
Loebs said the range of home price predictions from panel participants is the widest he’s ever seen. The most optimistic group of experts expects more than 37% cumulative home value appreciation through 2026, while the most pessimistic group expects a gain of less than 8% over the same period.
As one can see from the above chart, the average expectation is that the residential real estate market, as depicted by the U.S. Zillow Home Value Index, will continually climb.
The detail of the Q4 2021 Home Price Expectations Survey is interesting. Of the 106 survey respondents, none (of the displayed responses) forecasts a cumulative price decrease through 2026.
The Median Cumulative Home Price Appreciation for years 2021-2026 is seen as 17.0%, 25.08%, 30.05%, 34.15%, 39.89%, and 45.08%, respectively.
For a variety of reasons, I continue to believe that these forecasts will prove far too optimistic in hindsight.
I have written extensively about the residential real estate situation. For a variety of reasons, it is exceedingly complex. While many people continue to have an optimistic view regarding future residential real estate prices, in my opinion such a view is unsupported on an “all things considered” basis. Residential real estate is an exceedingly large asset bubble. As such, from these price levels there exists outsized potential for a price decline of severe magnitude.
_____
The Special Note summarizes my overall thoughts about our economic situation
Throughout this site there are many discussions of economic indicators. This post is the latest in a series of posts indicating facets of U.S. economic weakness or a notably low growth rate.
The level and trend of economic growth is especially notable at this time. As seen in various measures and near-term projections, the U.S. economy had undergone an outsized level of economic contraction in 2020. However, most people believe (and virtually all prominent economic forecasts indicate) that this historic level of contraction will have proven ephemeral in nature; i.e. an economic expansion will continue.
As seen in the October 2021 Wall Street Journal Economic Forecast Survey the consensus (average estimate) among various economists is for 5.22% GDP growth in 2021, 3.59% GDP growth in 2022, 2.53% GDP growth in 2023, and 2.23% GDP growth in 2024.
Charts Indicating U.S. Economic Weakness
Below are a small sampling of charts that depict weak growth or contraction, and a brief comment for each:
__
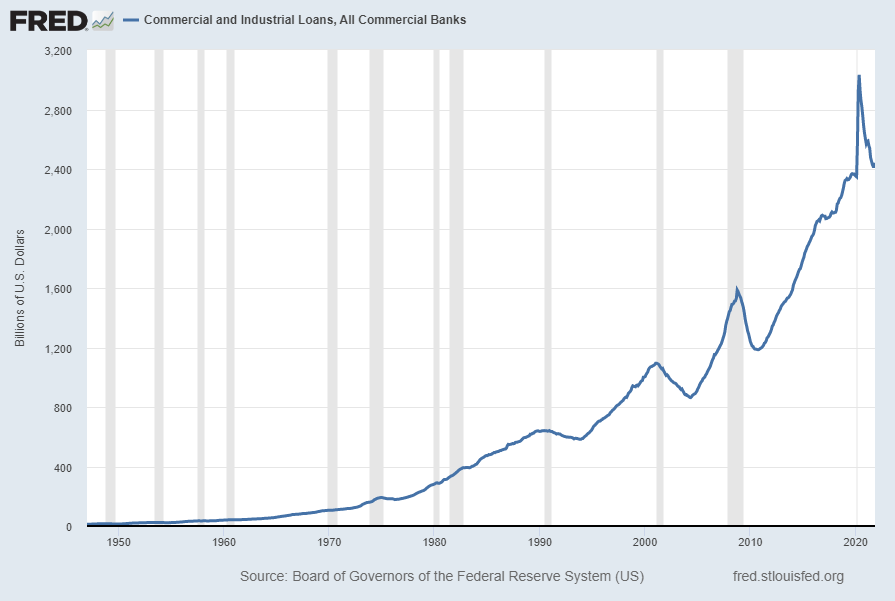
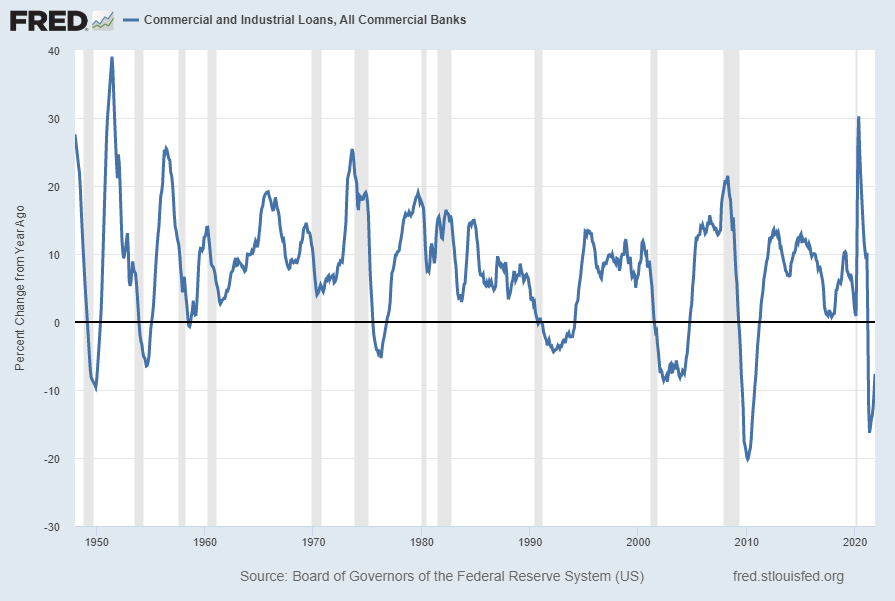
Commercial And Industrial Loans, All Commercial Banks (BUSLOANS)
“Commercial And Industrial Loans, All Commercial Banks” (BUSLOANS) has recently been declining. Shown below is this measure with last value of $2,441.1506 Billion through November 2021, last updated January 7, 2022:
Below is this measure displayed on a “Percent Change From Year Ago” basis with value -7.6%:
source: Board of Governors of the Federal Reserve System (US), Commercial and Industrial Loans, All Commercial Banks [BUSLOANS], retrieved from FRED, Federal Reserve Bank of St. Louis; accessed January 10, 2022: https://fred.stlouisfed.org/series/BUSLOANS
__
The Yield Curve
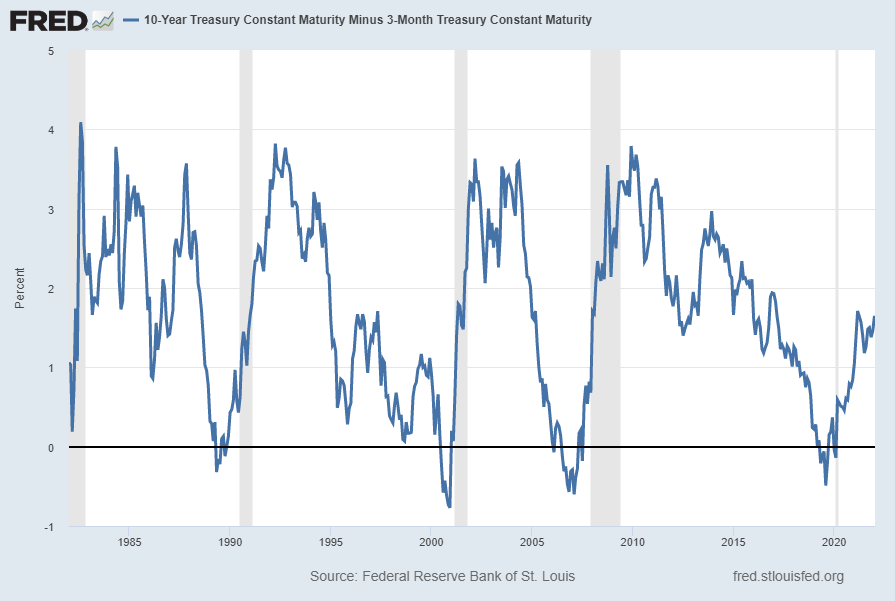
Many people believe that the Yield Curve is a leading economic indicator for the United States economy.
While I continue to have the stated reservations regarding the “Yield Curve” as an indicator, I do believe that it should be monitored.
The U.S. Yield Curve (one proxy seen below) while positive, is (all things considered) relatively low when viewed from a long-term perspective. Below is the spread between the 10-Year Treasury Constant Maturity and the 3-Month Treasury Constant Maturity from 1982 through the January 10, 2022 value, showing a value of 1.65% [10-Year Treasury Yield (FRED DGS10) of 1.76% as of January 7, 3-Month Treasury Yield (FRED DGS3MO) of .10% as of January 7]:
source: Federal Reserve Bank of St. Louis, 10-Year Treasury Constant Maturity Minus 3-Month Treasury Constant Maturity [T10Y3M], retrieved from FRED, Federal Reserve Bank of St. Louis; accessed January 11, 2022: https://fred.stlouisfed.org/series/T10Y3M
__
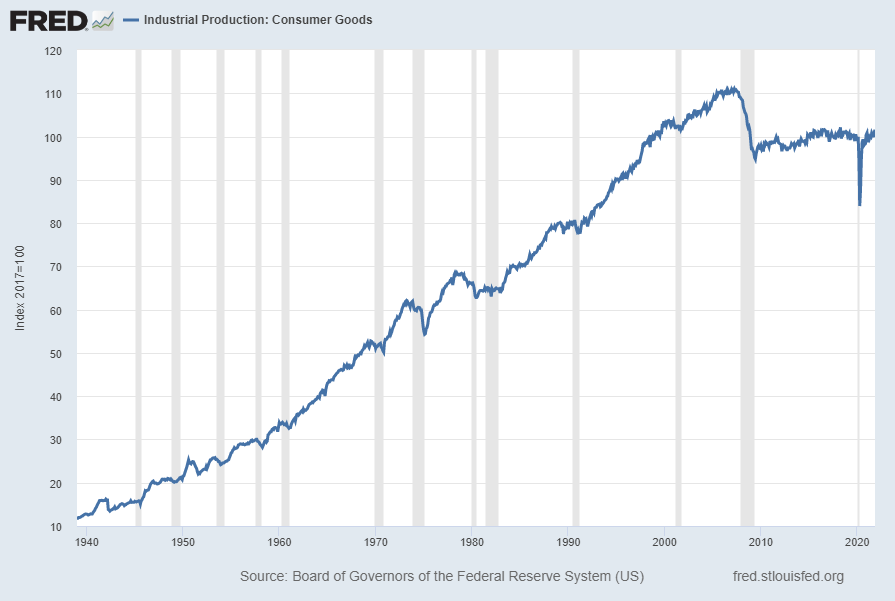
Industrial Production: Consumer Goods (IPCONGD)
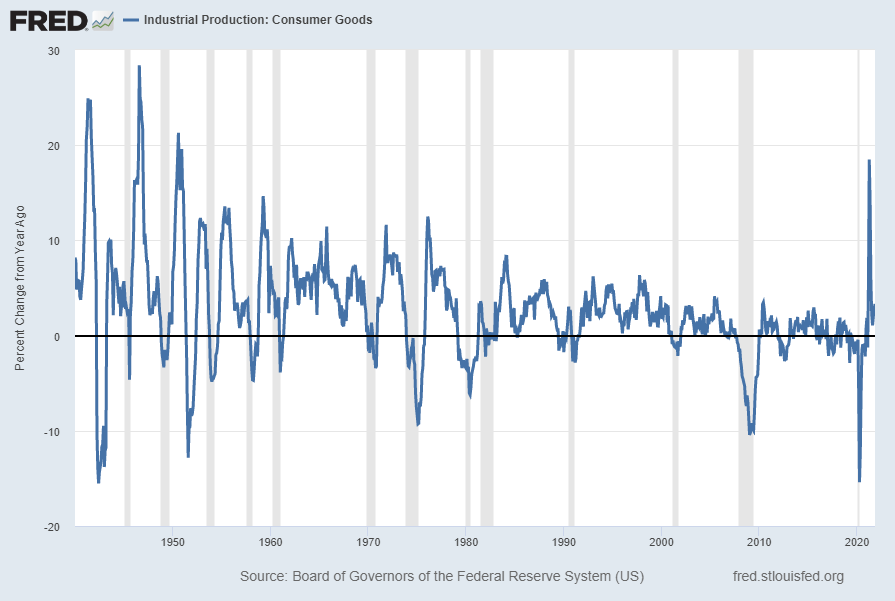
The “Industrial Production: Consumer Goods” measure has been relatively subdued since the Financial Crisis. Shown below is a long-term chart of this measure (displayed from 1939), with last value of 101.5776 through November 2021, last updated December 16, 2021:
Displayed below is this same IPCONGD measure on a “Percent Change From Year Ago” basis. The current value is 3.3%:
source: Board of Governors of the Federal Reserve System (US), Industrial Production: Consumer Goods [IPCONGD], retrieved from FRED, Federal Reserve Bank of St. Louis; accessed January 11, 2022: https://fred.stlouisfed.org/series/IPCONGD
__
Population Growth (POPTHM)
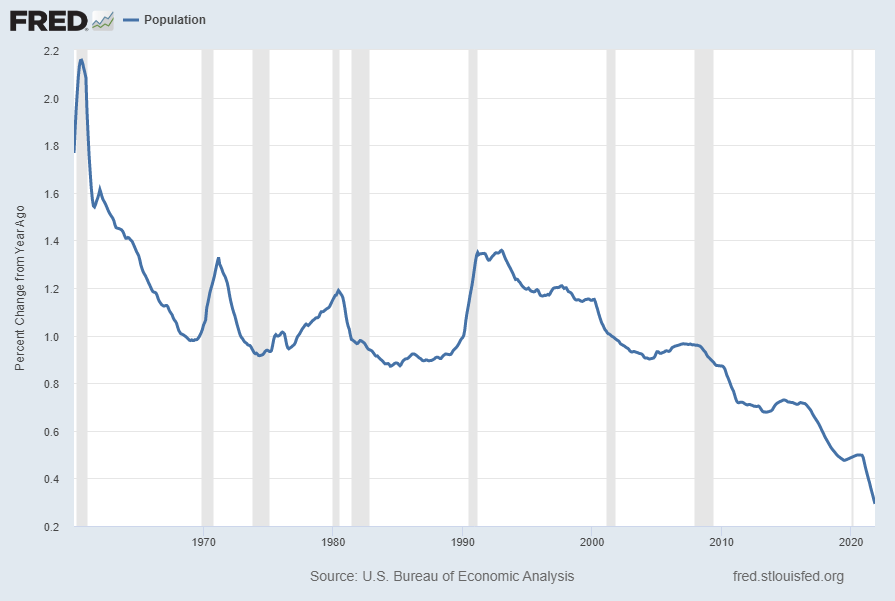
Shown below is a long-term chart of U.S. population growth on a “Percent Change From A Year Ago” basis with value .3% through November 2021, as of the December 23, 2021 update. The declining nature of the growth rate is notable and may in itself deserve consideration as an economic indicator:
source: U.S. Bureau of the Census, Total Population: All Ages including Armed Forces Overseas [POP], retrieved from FRED, Federal Reserve Bank of St. Louis; accessed January 11, 2022: https://fred.stlouisfed.org/series/POPTHM
__
Other Indicators
As mentioned previously, many other indicators discussed on this site indicate slow economic growth or economic contraction, if not outright (gravely) problematical economic conditions.
_____
The Special Note summarizes my overall thoughts about our economic situation
My overall analysis indicates a continuing elevated and growing level of financial danger which contains many worldwide and U.S.-specific “stresses” of a very complex nature. I have written numerous posts on this site concerning both ongoing and recent “negative developments.” These developments, as well as other exceedingly problematical conditions, have presented a highly perilous economic environment that endangers the overall financial system.
Also of ongoing immense importance is the existence of various immensely large asset bubbles, a subject of which I have extensively written. While all of these asset bubbles are wildly pernicious and will have profound adverse future implications, hazards presented by the bond market bubble are especially notable.
Predicting the specific timing and extent of a stock market crash is always difficult, and the immense complexity of today’s economic situation makes such a prediction even more challenging. With that being said, my analyses continue to indicate that a near-term exceedingly large (from an ultra long-term perspective) stock market crash – that would also involve (as seen in 2008) various other markets – will occur. [note: the “next crash” and its aftermath has paramount significance and implications, as discussed in the post of January 6, 2012 titled “The Next Crash And Its Significance“ and various subsequent posts in the “Economic Depression” label]
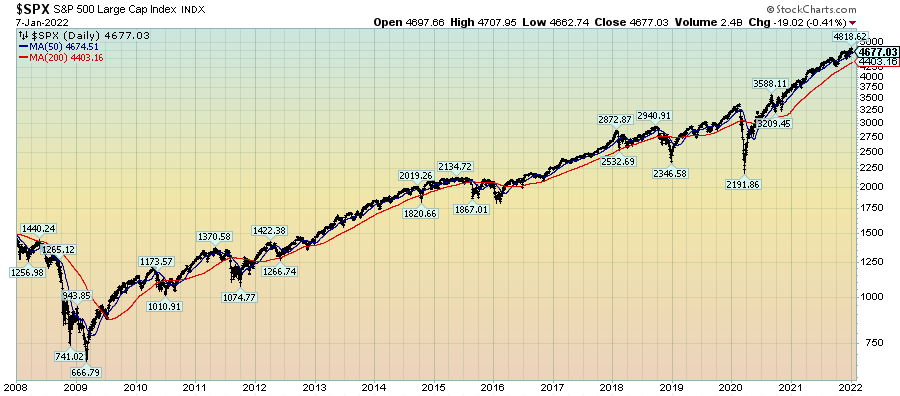
As reference, below is a daily chart since 2008 of the S&P500 (through January 7, 2022 with a last price of 4677.03), depicted on a LOG scale, indicating both the 50dma and 200dma as well as price labels:
(click on chart to enlarge image)(chart courtesy of StockCharts.com; chart creation and annotation by the author)
_____
The Special Note summarizes my overall thoughts about our economic situation