Thursday, July 7, 2022

Charts Indicating Economic Weakness – July 2022


U.S. Economic Indicators

Throughout this site there are many discussions of economic indicators.  This post is the latest in a series of posts indicating facets of U.S. economic weakness or a notably low growth rate.

The level and trend of economic growth is especially notable at this time. As seen in various estimates, the probability of recession has grown to significant levels.

As seen in the June 2022 Wall Street Journal Economic Forecast Survey the consensus (average estimate) among various economists is for 1.28% GDP growth in 2022, 1.36% GDP growth in 2023, and n/a GDP growth in 2024.

Charts Indicating U.S. Economic Weakness

Below are a small sampling of charts that depict weak growth or contraction, and a brief comment for each:

__

Real Average Hourly Earnings

Various measures of (nominal) average hourly earnings continue to show significant growth. However, due to continuing high inflation, Real Average Hourly Earnings continues to decline. Shown below is a chart of earnings measures as seen in The Economics Daily of June 16, 2022 titled “Real average hourly earnings down 3.0 percent over the 12 months ending May 2022”:
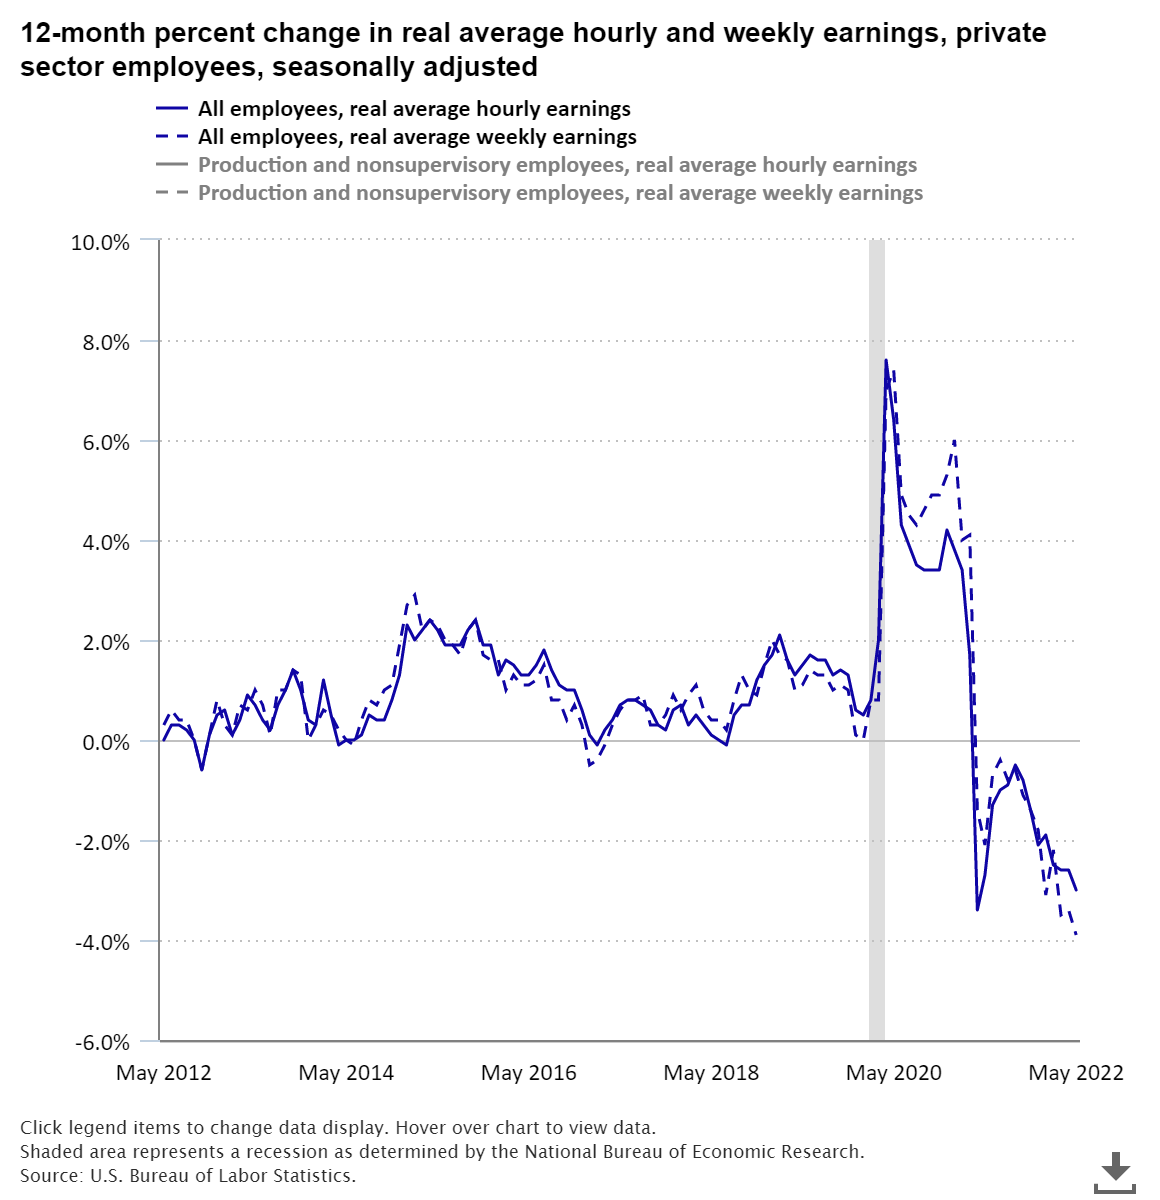
Real Average Hourly Earnings and Real Average Weekly Earnings

source: Bureau of Labor Statistics, U.S. Department of Labor, The Economics Daily, Real average hourly earnings down 3.0 percent over the 12 months ending May 2022 at https://www.bls.gov/opub/ted/2022/real-average-hourly-earnings-down-3-0-percent-over-the-12-months-ending-may-2022.htm (visited July 06, 2022).

__

Real Disposable Personal Income (DSPIC96)

“Real Disposable Personal Income” (DSPIC96) has been volatile since 2020, and ongoing high inflation is presenting a hurdle to its continued growth. Shown below is this measure with last value of $15,144.8 Billion through May, last updated June 30, 2022:
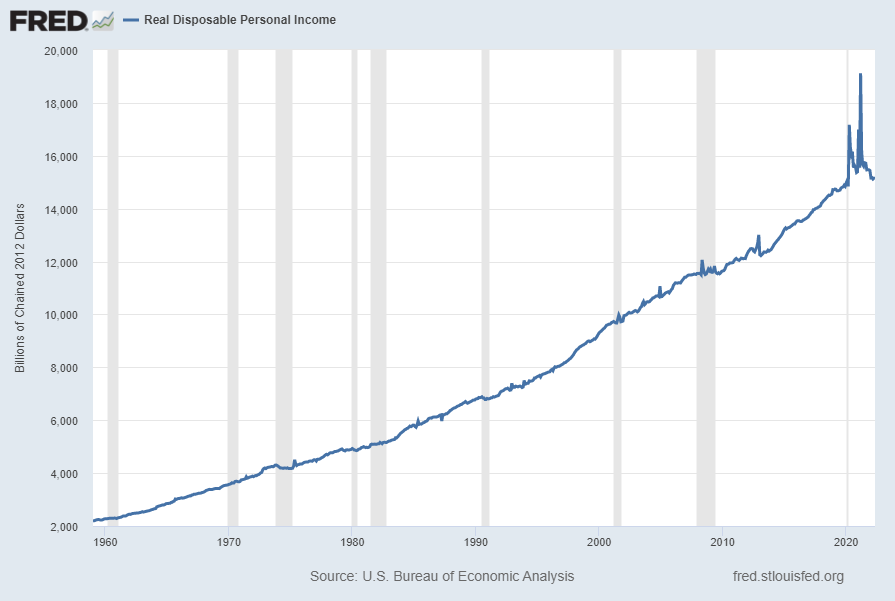
Real Disposable Personal Income

Below is this measure displayed on a “Percent Change” (from prior month) basis with last value of -.1%:
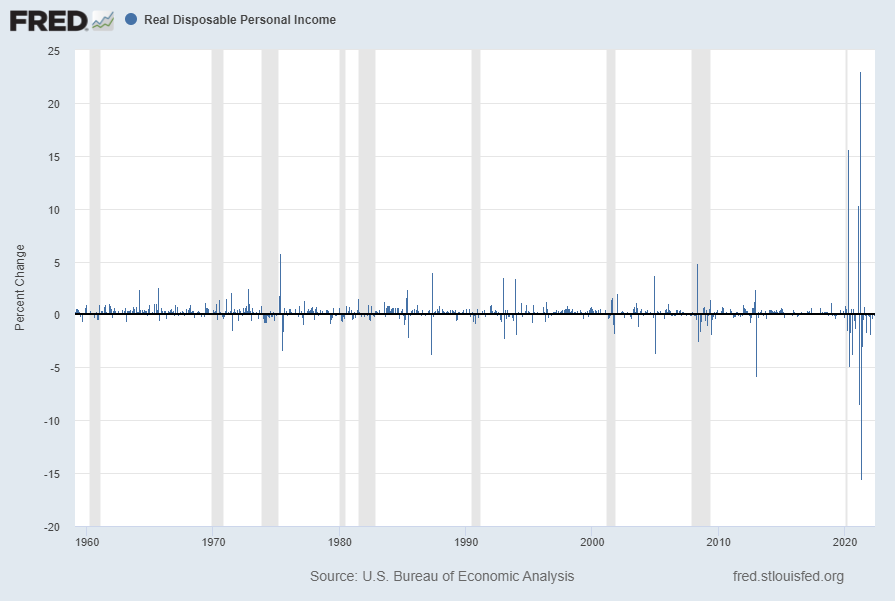
Real Disposable Personal Income Percent Change

Below is this measure displayed on a “Percent Change From Year Ago” basis with value -3.3%:
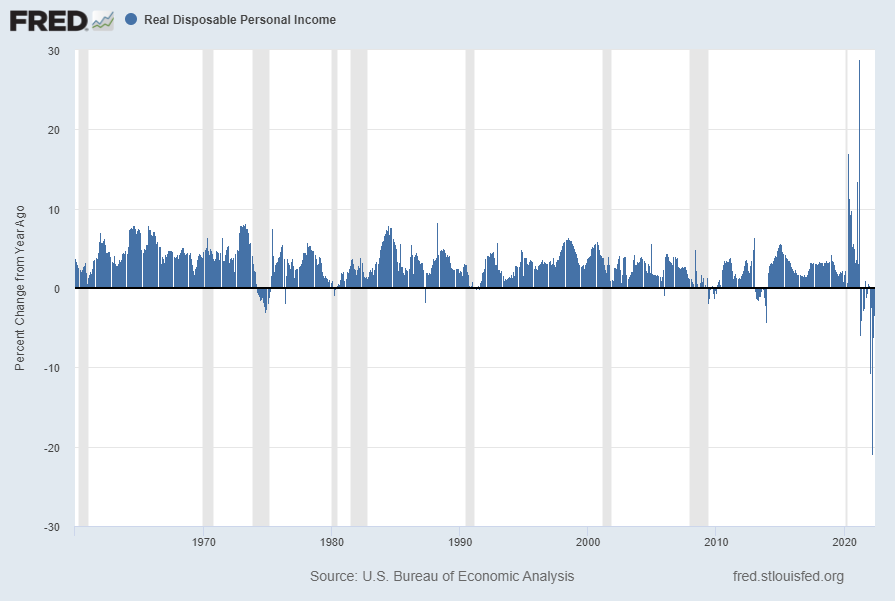
Real Disposable Personal Income Percent Change From Year Ago
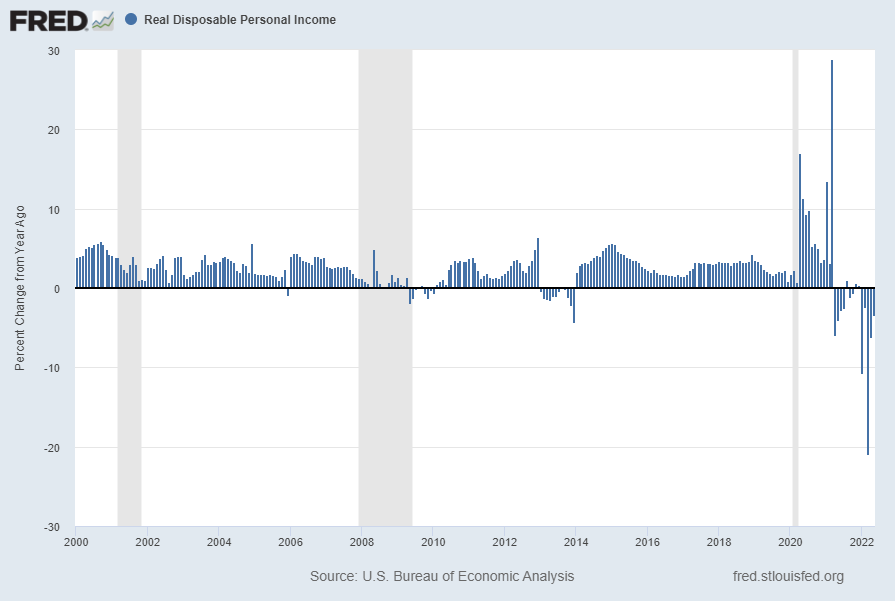
Below is this same measure (“Percent Change From Year Ago” basis) but from the year 2000 onward:
Real Disposable Personal Income Percent Change From Year Ago

source: U.S. Bureau of Economic Analysis, Real Disposable Personal Income [DSPIC96], retrieved from FRED, Federal Reserve Bank of St. Louis; accessed July 6, 2022: https://fred.stlouisfed.org/series/DSPIC96

__

The Yield Curve (T10Y2Y)

Many people believe that the Yield Curve is a leading economic indicator for the United States economy.

On March 1, 2010, I wrote a post on the issue, titled “The Yield Curve As A Leading Economic Indicator.”

While I continue to have the stated reservations regarding the “Yield Curve” as an indicator, I do believe that it should be monitored.

The U.S. Yield Curve (one proxy seen below) while positive, is (all things considered) notably low when viewed from a long-term perspective. Below is the spread between the 10-Year Treasury Constant Maturity and the 2-Year Treasury Constant Maturity from June 1976 through the July 5, 2022 value, showing a value of 0.0% [10-Year Treasury Yield (FRED DGS10) of 2.88% as of the July 5 update, 2-Year Treasury Yield (FRED DGS2) of 2.84% as of the July 5 update]:
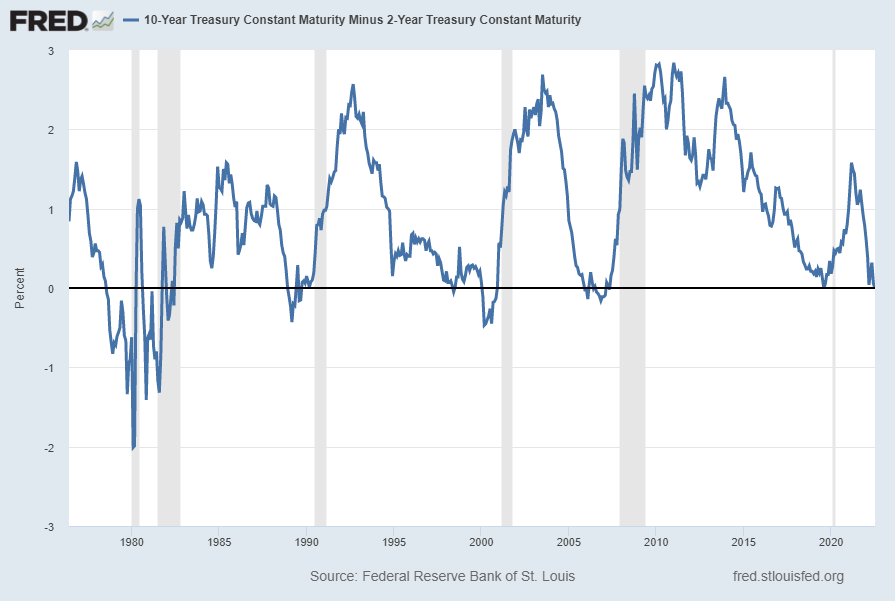
U.S. Yield Curve

source: Federal Reserve Bank of St. Louis, 10-Year Treasury Constant Maturity Minus 2-Year Treasury Constant Maturity [T10Y2Y], retrieved from FRED, Federal Reserve Bank of St. Louis; accessed July 6, 2022: https://fred.stlouisfed.org/series/T10Y2Y

__

University of Michigan Consumer Sentiment Index

The University of Michigan Consumer Sentiment Index reached a record-low level of 50.0 in June. While, as I have previously stated, I don’t believe that confidence surveys should be overemphasized, I find this level to be notable for several reasons.

A long-term chart of the University of Michigan Consumer Sentiment Index, from the Advisor Perspectives’ site, in the June 24, 2022 post titled “Michigan Consumer Sentiment Lowest Reading on Record“:
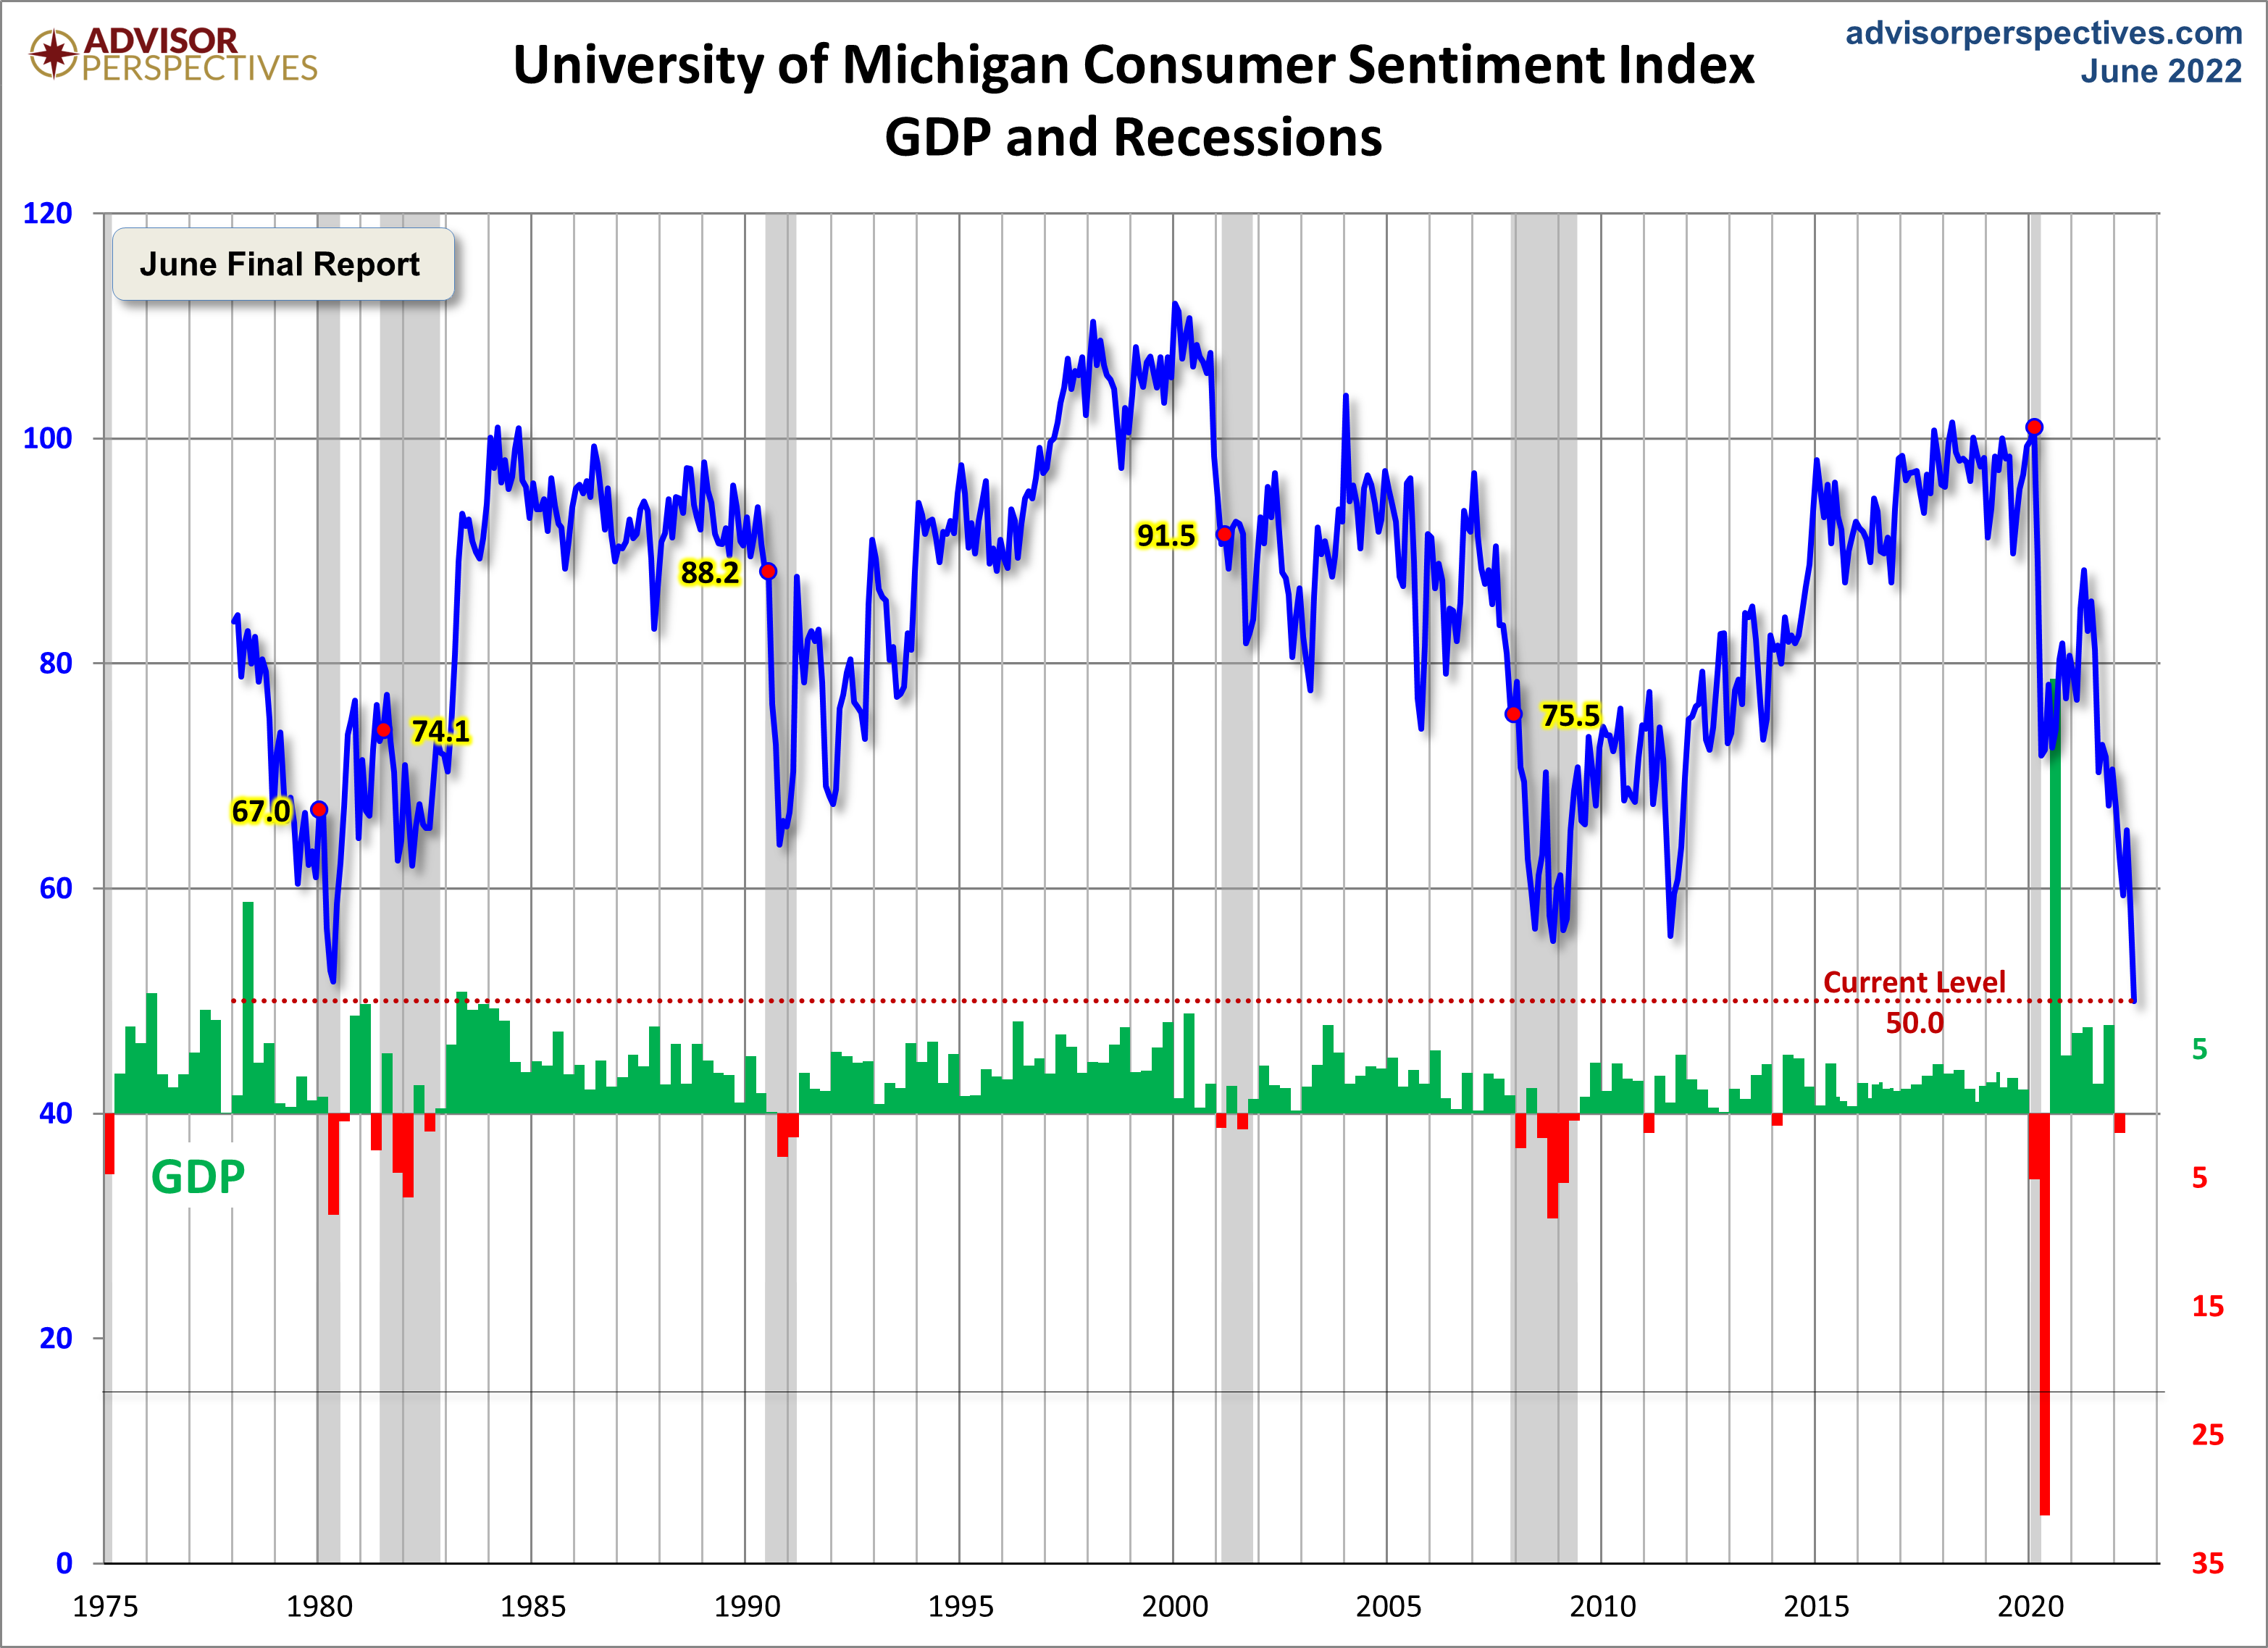
University of Michigan Consumer Sentiment Index

__

Other Indicators

As mentioned previously, many other indicators discussed on this site indicate slow economic growth or economic contraction, if not outright (gravely) problematical economic conditions.

_____

The Special Note summarizes my overall thoughts about our economic situation

SPX at 3845.08 as this post is written

Wednesday, July 6, 2022

VIX Weekly And Monthly Charts Since The Year 2000 – July 6, 2022 Update

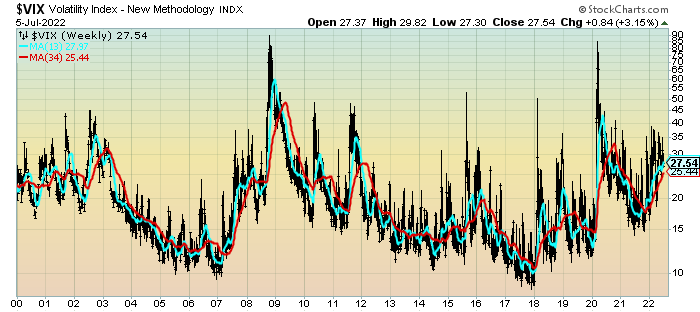
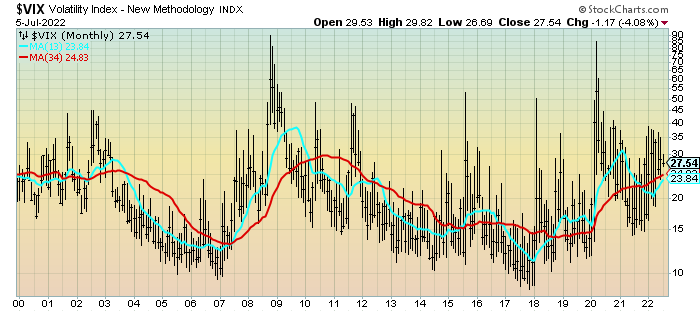
For reference purposes, below are two charts of the VIX from year 2000 through the July 5, 2022 close, which had a closing value of 27.54.

Here is the VIX Weekly chart, depicted on a LOG scale, with the 13- and 34-week moving averages, seen in the cyan and red lines, respectively:

(click on chart to enlarge image)(chart courtesy of StockCharts.com; chart creation and annotation by the author)

VIX Weekly chart 27.54

–

Here is the VIX Monthly chart, depicted on a LOG scale, with the 13- and 34-month moving average, seen in the cyan and red lines, respectively:

(click on chart to enlarge image)(chart courtesy of StockCharts.com; chart creation and annotation by the author)

VIX Monthly 27.54

____

The Special Note summarizes my overall thoughts about our economic situation

SPX at 3831.39 as this post is written

Charts Of Equities Since 2009 And 1980 – July 6, 2022 Update

In the March 9, 2012 post (“Charts of Equities’ Performance Since March 9, 2009 And January 1, 1980“) I highlighted two charts for reference purposes.

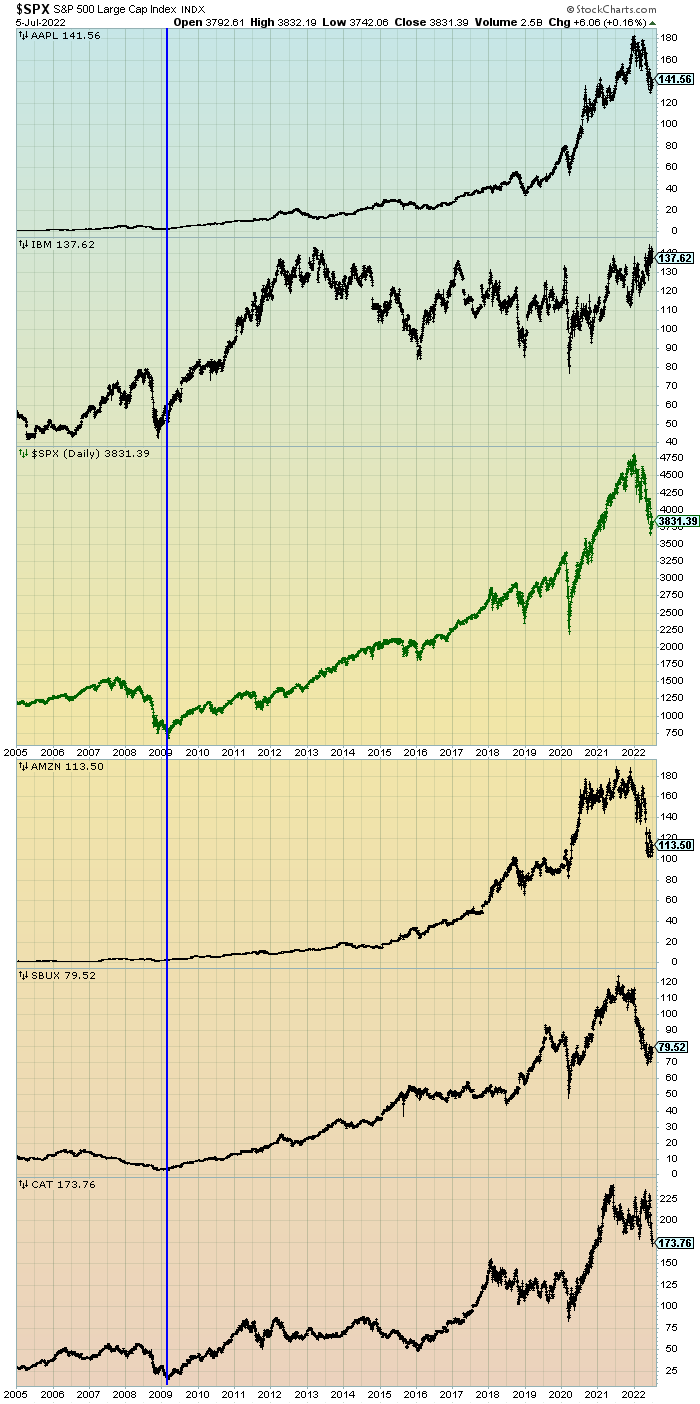
Below are those two charts, updated through the latest daily closing price.

The first is a daily chart of the S&P500 (shown in green), as well as five prominent (AAPL, IBM, AMZN, SBUX, CAT) individual stocks, since 2005.  There is a blue vertical line that is very close to the March 6, 2009 low.  As one can see, both the S&P500 performance, as well as many stocks including the five shown, have performed strongly since the March 6, 2009 low:

(click on chart to enlarge image)(chart courtesy of StockCharts.com; chart creation and annotation by the author)

S&P500 vs. prominent stocks

–

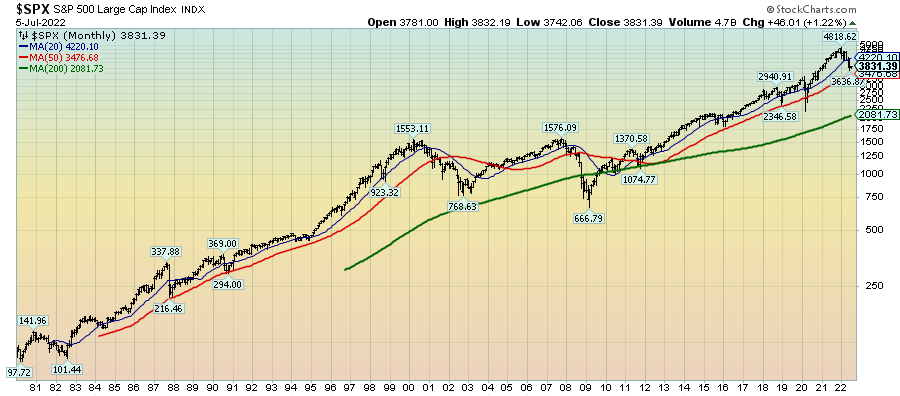
This next chart shows, on a monthly LOG basis, the S&P500 since 1980.  I find this chart notable as it provides an interesting long-term perspective on the S&P500′s performance.  The 20, 50, and 200-month moving averages are shown in blue, red, and green lines, respectively:

(click on chart to enlarge image)(chart courtesy of StockCharts.com; chart creation and annotation by the author)

S&P500 since 1980

_____

The Special Note summarizes my overall thoughts about our economic situation

SPX at 3831.39 as this post is written

Friday, July 1, 2022

Long-Term Charts Of Primary U.S. Stock Market Indices

StockCharts.com maintains long-term historical charts of various major stock market indices, interest rates, currencies, commodities, and economic indicators.

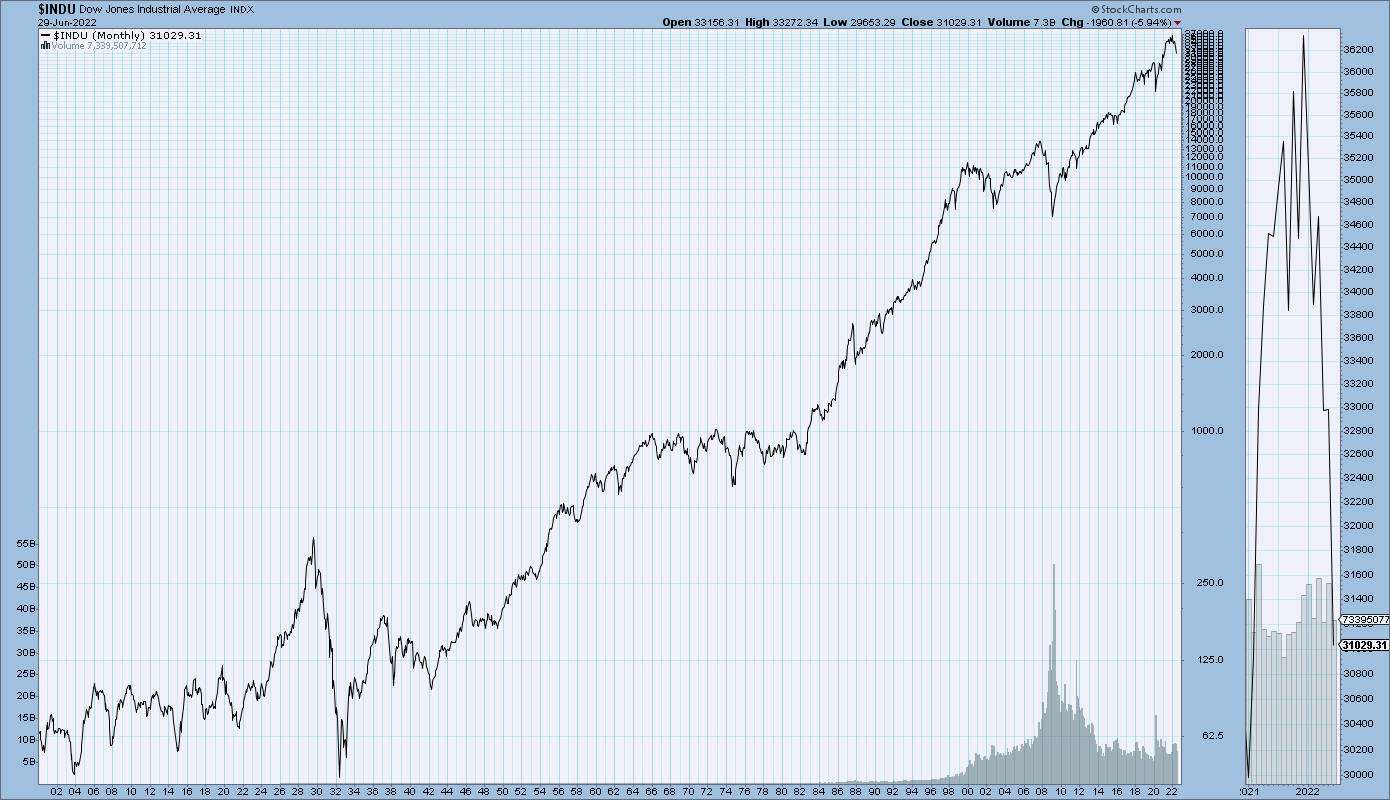
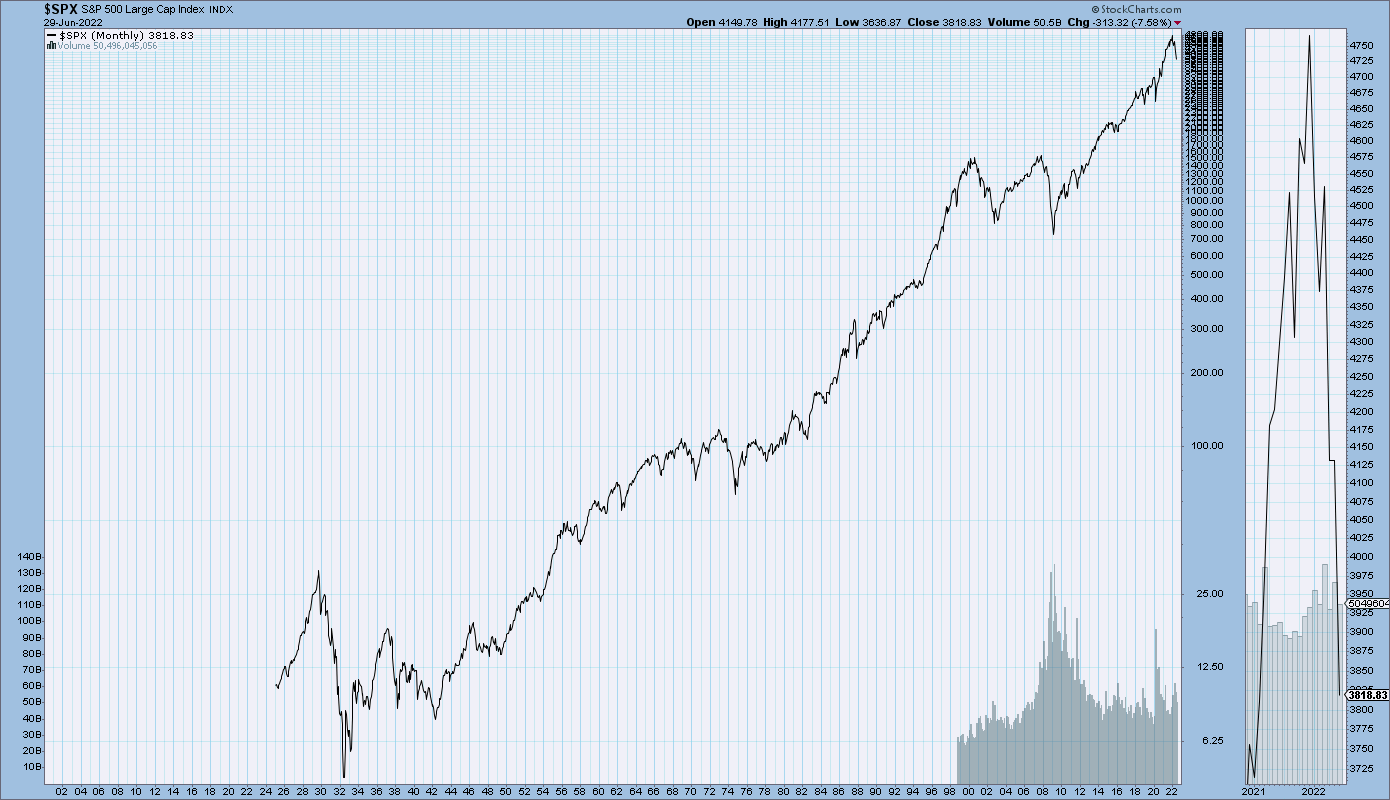
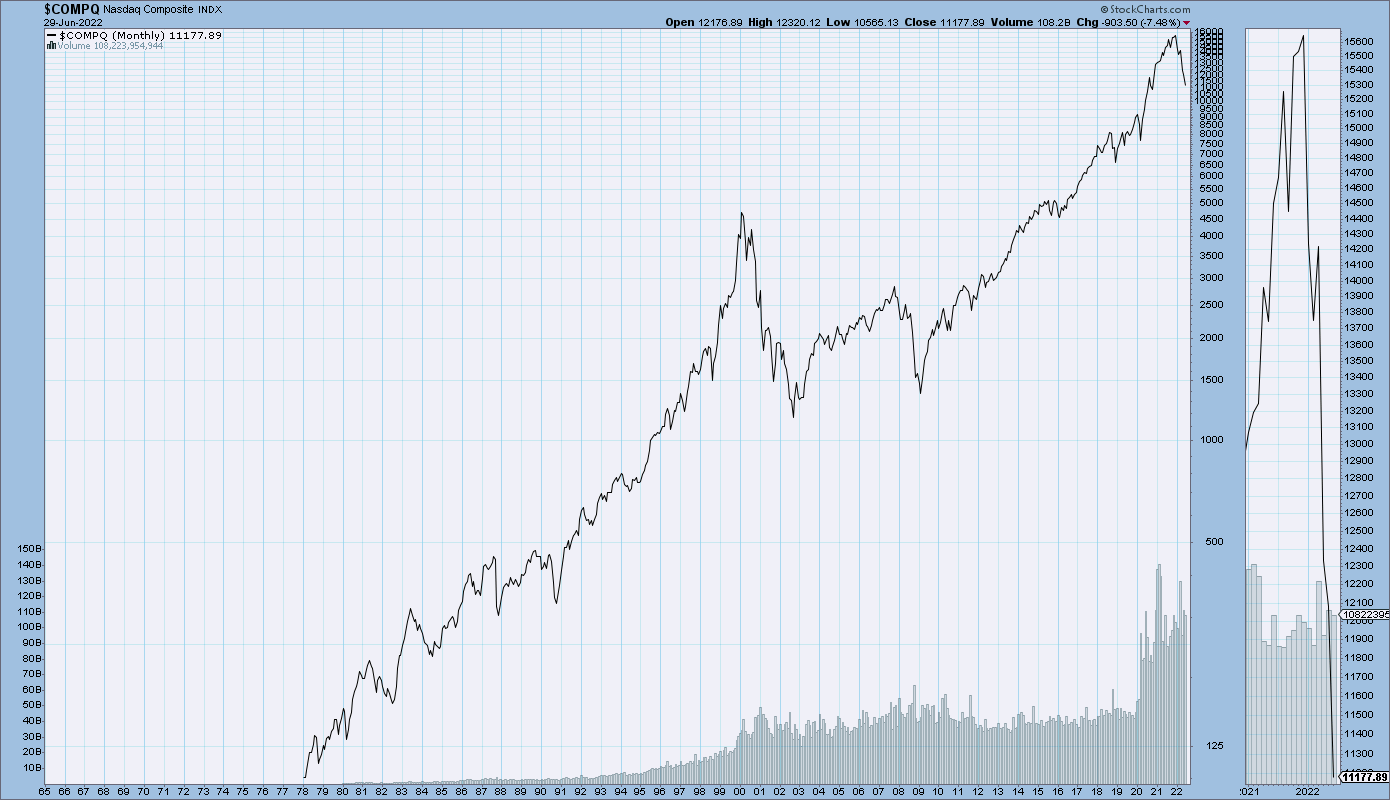
As a long-term reference, below are charts depicting various stock market indices for the dates shown.  All charts are depicted on a monthly basis using a LOG scale.

(click on charts to enlarge images)(charts courtesy of StockCharts.com)

The Dow Jones Industrial Average, from 1900 – June 29, 2022:

DJIA chart since 1900

–

The Dow Jones Transportation Average, from 1900 – June 29, 2022:

DJTA chart since 1900

–

The S&P500, from 1925 – June 29, 2022:

S&P500 chart since 1925

–

The Nasdaq Composite, from 1978 – June 29, 2022:

Nasdaq Composite since 1978

_____

The Special Note summarizes my overall thoughts about our economic situation

SPX at 3784.21 as this post is written

U.S. Dollar Decline – July 1, 2022 Update

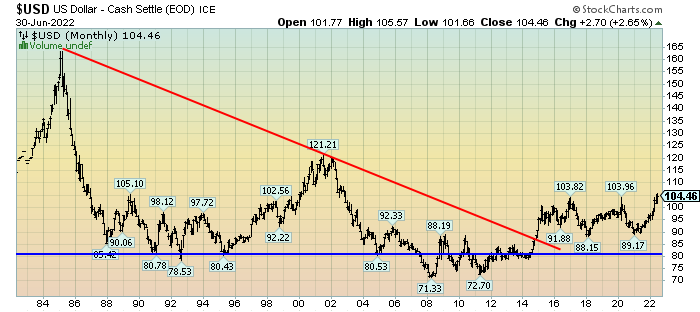
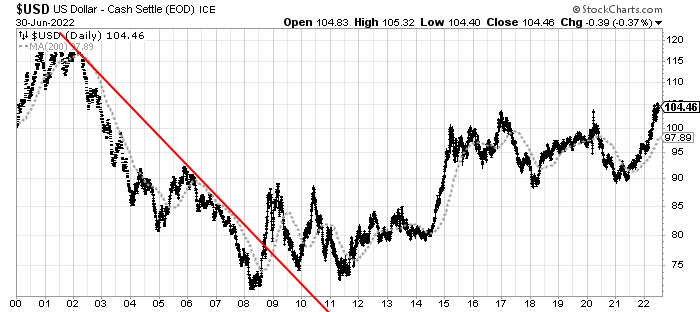
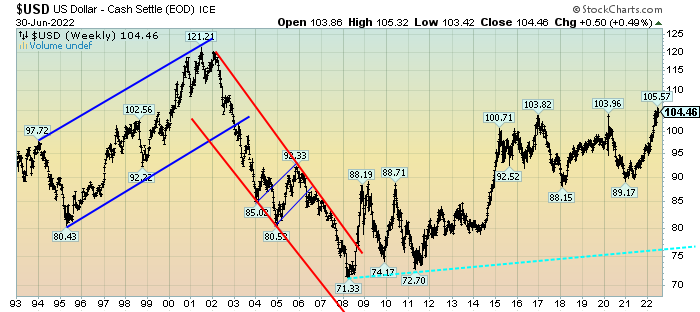
U.S. Dollar weakness is a foremost concern of mine.  As such, I have extensively written about it, including commentary on the “A Substantial U.S. Dollar Decline And Consequences” page.  I am very concerned that the actions being taken to “improve” our economic situation will dramatically weaken the Dollar.  Should the Dollar substantially decline from here, as I expect, the negative consequences will far outweigh any benefits.  The negative impact of a substantial Dollar decline can’t, in my opinion, be overstated.

The following three charts illustrate various technical analysis aspects of the U.S. Dollar, as depicted by the U.S. Dollar Index.

First, a look at the monthly U.S. Dollar from 1983.  This clearly shows a long-term weakness, with the blue line showing technical support until 2007, and the red line representing a (past) trendline:

(charts courtesy of StockCharts.com; annotations by the author)

(click on charts to enlarge images)

U.S. Dollar monthly chart

–

Next, another chart, this one focused on the daily U.S. Dollar since 2000 on a LOG scale.  The red line represents a (past) trendline.  The gray dotted line is the 200-day M.A. (moving average):

U.S. Dollar 200dma

–

Lastly, a chart of the Dollar on a weekly LOG scale.  There are two clearly marked past channels, with possible technical support depicted by the dashed light blue line:

U.S. Dollar weekly chart

–

I will continue providing updates on this U.S. Dollar situation regularly as it deserves very close monitoring…

_____

The Special Note summarizes my overall thoughts about our economic situation

SPX at 3785.38 as this post is written
Worrisome Conditions Within The U.S. Economic Situation

Various surveys, economic growth projections, and market risk indicators portrayed a short period (through mid-2020) of substantial U.S. economic decline, and now indicate sustained economic growth and financial stability for the foreseeable future.

However, there are various indications – many of which have been discussed on this site – that this very widely-held consensus is in many ways incorrect.  There are many exceedingly problematical financial conditions that have existed prior to 2020, and continue to exist.  As well, numerous economic dynamics continue to be exceedingly worrisome and many economic indicators have portrayed facets of weak growth or outright decline currently as well as prior to 2020.

Of paramount importance is the resulting level of risk and the future economic implications.

From an “all things considered” standpoint, I continue to believe the overall level of risk remains at a fantastic level – one that is far greater than that experienced at any time in the history of the United States.

Cumulatively, these highly problematical conditions will lead to future upheaval.  The extent of the resolution of these problematical conditions will determine the ongoing viability of the financial system and economy as well as the resultant quality of living.

As I have previously written in “The U.S. Economic Situation” updates:

My analyses continues to indicate that the growing level of financial danger will lead to the next stock market crash that will also involve (as seen in 2008) various other markets as well.  Key attributes of this next crash is its outsized magnitude (when viewed from an ultra-long term historical perspective) and the resulting economic impact.  This next financial crash is of tremendous concern, as my analyses indicate it will lead to a Super Depression – i.e. an economy characterized by deeply embedded, highly complex, and difficult-to-solve problems.

_____

The Special Note summarizes my overall thoughts about our economic situation

SPX at 3785.38 as this post is written
Thursday, June 30, 2022

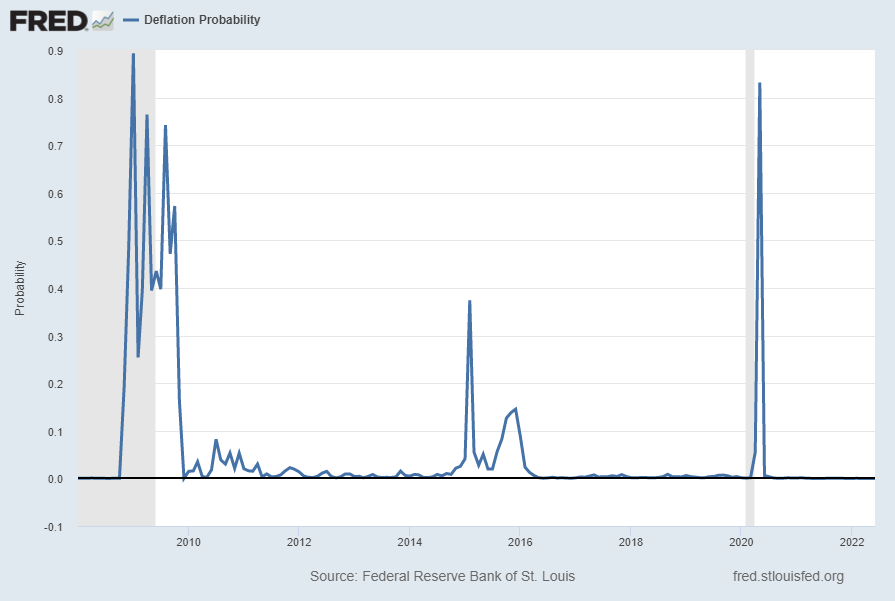
U.S. Deflation Probability Chart Through June 2022

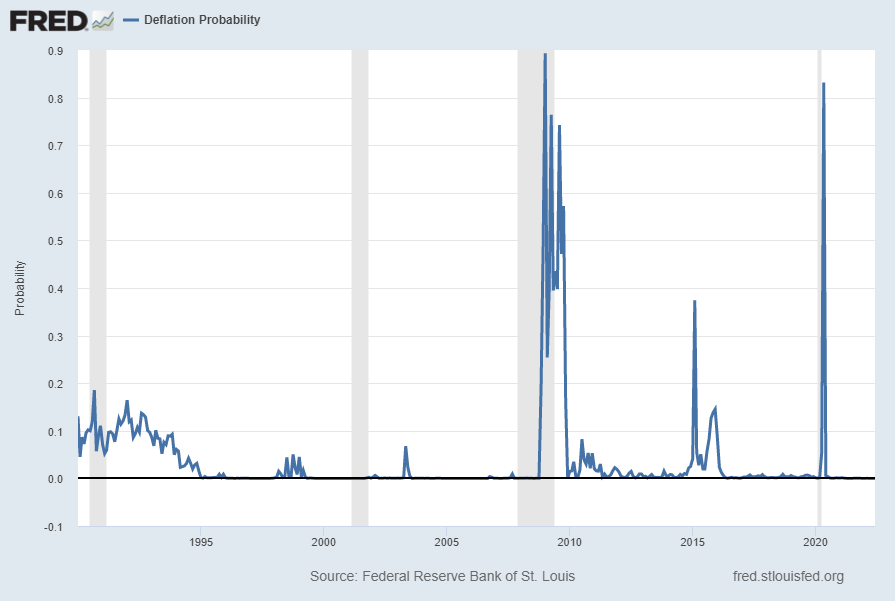
For reference, below is a chart of the St. Louis Fed Price Pressures Measures – Deflation Probability [FRED STLPPMDEF] through June 2022.

While I do not necessarily agree with the current readings of the measure, I view this as a proxy of U.S. deflation probability.

A description of this measure, as seen in FRED:

This series measures the probability that the personal consumption expenditures price index (PCEPI) inflation rate (12-month changes) over the next 12 months will fall below zero.

The chart, on a monthly basis from January 1990 – June 2022, with a last reading of .00001, last updated on June 30, 2022:

U.S. Deflation Probability

Here is this same U.S. deflation probability measure since 2008:

U.S. Deflation Probability since 2008

source:  Federal Reserve Bank of St. Louis, Deflation Probability [STLPPMDEF], retrieved from FRED, Federal Reserve Bank of St. Louis; accessed June 30, 2022: https://fred.stlouisfed.org/series/STLPPMDEF

_________

I post various economic indicators and indices because I believe they should be carefully monitored.  However, as those familiar with this site are aware, I do not necessarily agree with what they depict or imply.

_____

The Special Note summarizes my overall thoughts about our economic situation

SPX at 3785.38 as this post is written
Chicago Fed National Financial Conditions Index (NFCI)

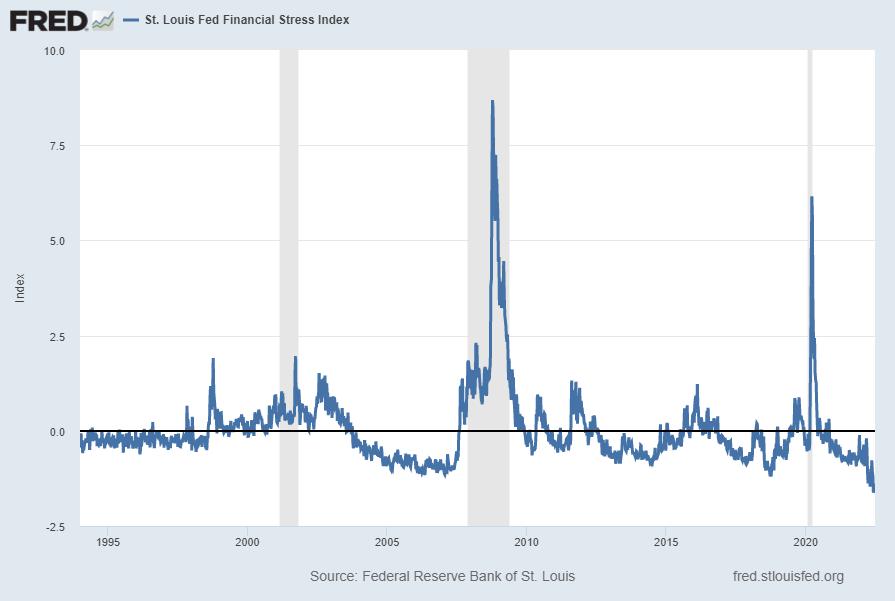
The St. Louis Fed’s Financial Stress Index (STLFSI3) is one index that is supposed to measure stress in the financial system. Its reading as of the June 30, 2022 update (reflecting data through June 24, 2022) is -1.3815:

STLFSI3

source: Federal Reserve Bank of St. Louis, St. Louis Fed Financial Stress Index [STLFSI3], retrieved from FRED, Federal Reserve Bank of St. Louis; accessed June 30, 2022: https://fred.stlouisfed.org/series/STLFSI3

Of course, there are a variety of other measures and indices that are supposed to measure financial stress and other related issues, both from the Federal Reserve as well as from private sources.

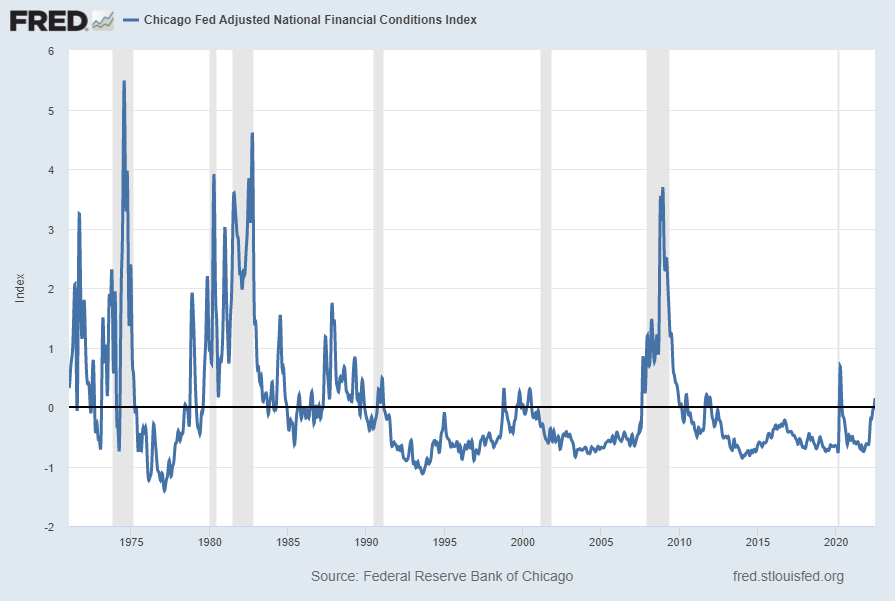
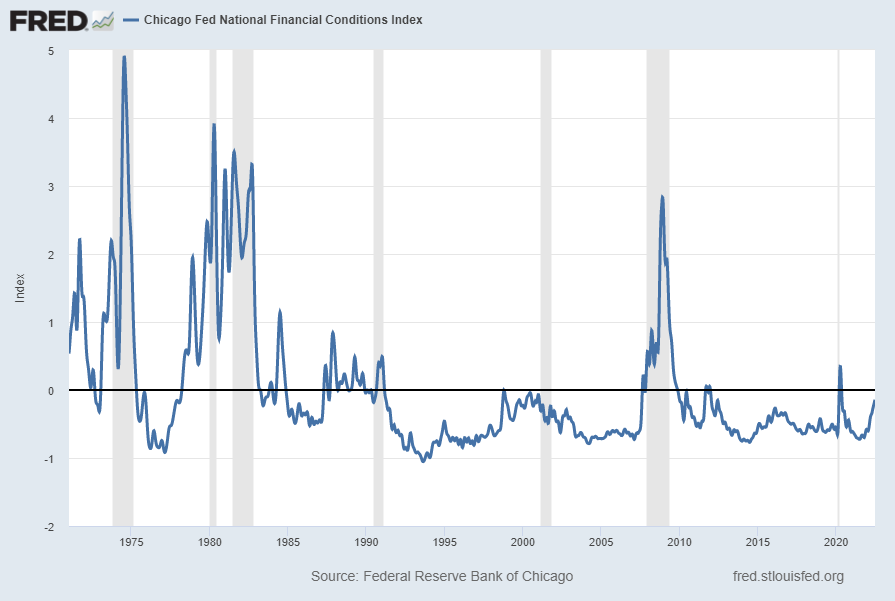
Two other indices that I regularly monitor include the Chicago Fed National Financial Conditions Index (NFCI) as well as the Chicago Fed Adjusted National Financial Conditions Index (ANFCI).

Here are summary descriptions of each, as seen in FRED:

The National Financial Conditions Index (NFCI) measures risk, liquidity and leverage in money markets and debt and equity markets as well as in the traditional and “shadow” banking systems. Positive values of the NFCI indicate financial conditions that are tighter than average, while negative values indicate financial conditions that are looser than average.

The adjusted NFCI (ANFCI). This index isolates a component of financial conditions uncorrelated with economic conditions to provide an update on how financial conditions compare with current economic conditions.

For further information, please visit the Federal Reserve Bank of Chicago’s web site:

http://www.chicagofed.org/webpages/publications/nfci/index.cfm

Below are the most recently updated charts of the NFCI and ANFCI, respectively.

The NFCI chart below was last updated on June 29, 2022 incorporating data from January 8, 1971 through June 24, 2022 on a weekly basis.  The June 24 value is -.14310:

NFCI

Data Source: FRED, Federal Reserve Economic Data, Federal Reserve Bank of St. Louis; accessed June 30, 2022:  
http://research.stlouisfed.org/fred2/series/NFCI

–

The ANFCI chart below was last updated on June 30, 2022 incorporating data from January 8, 1971 through June 24, 2022, on a weekly basis.  The June 24, 2022 value is .14968:

ANFCI

Data Source: FRED, Federal Reserve Economic Data, Federal Reserve Bank of St. Louis; accessed June 30, 2022:  
http://research.stlouisfed.org/fred2/series/ANFCI

_________

I post various indicators and indices because I believe they should be carefully monitored.  However, as those familiar with this site are aware, I do not necessarily agree with what they depict or imply.

_____

The Special Note summarizes my overall thoughts about our economic situation

SPX at 3794.94 as this post is written