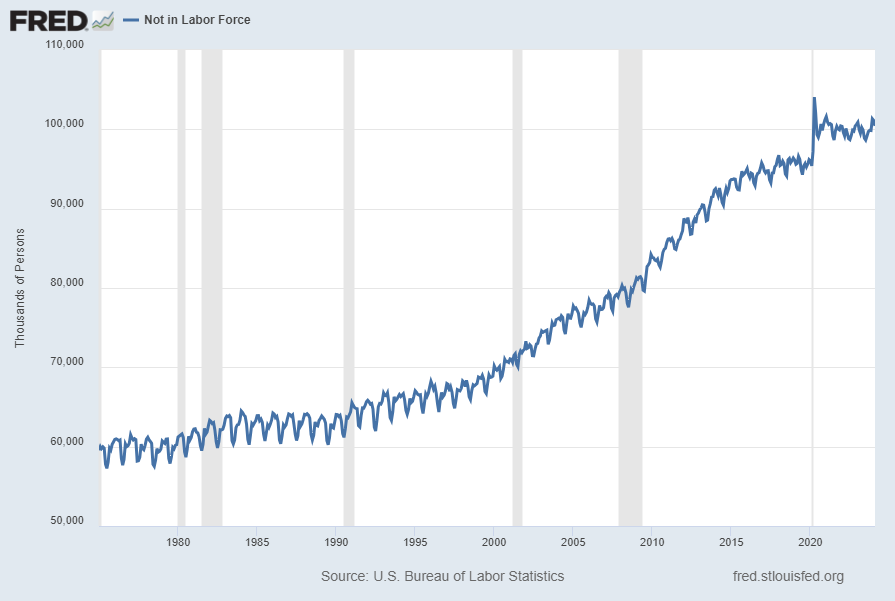
In the November 13, 2013 post (“Not In Labor Force Statistic“) I featured editorial commentary from the Wall Street Journal, as well as an accompanying long-term chart, with regard to the number of people not working.
Below is an updated chart regarding this statistic. The current figure, last updated on March 8, 2024 depicting data through February 2024, is 100.426 million people (Not Seasonally Adjusted):
Data Source: U.S. Bureau of Labor Statistics, Not in Labor Force [LNU05000000], retrieved from FRED, Federal Reserve Bank of St. Louis; accessed March 8, 2024: https://fred.stlouisfed.org/series/LNU05000000
_____
The Special Note summarizes my overall thoughts about our economic situation
Along these lines, one of the measures showing disconcerting trends is that of hourly earnings.
While the concept of hourly earnings can be defined and measured in a variety of ways, below are a few charts that I believe broadly illustrate problematic trends.
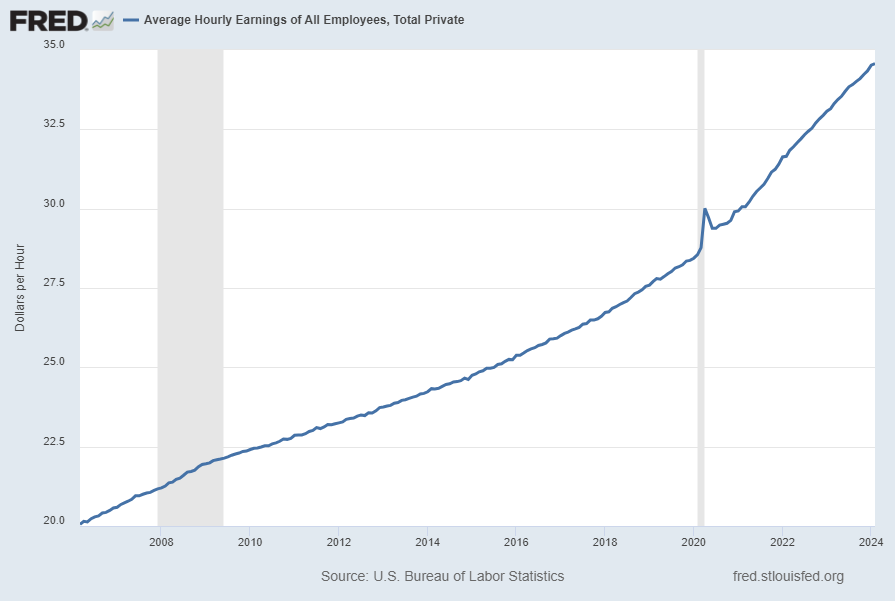
The first chart depicts Average Hourly Earnings Of All Employees: Total Private (FRED series CES0500000003)(current value = $34.57):
(click on chart to enlarge image)(chart last updated 3-8-24)
Data Source: FRED, Federal Reserve Economic Data, Federal Reserve Bank of St. Louis: Average Hourly Earnings of All Employees: Total Private [CES0500000003] ; U.S. Department of Labor: Bureau of Labor Statistics; accessed March 8, 2024: http://research.stlouisfed.org/fred2/series/CES0500000003
–
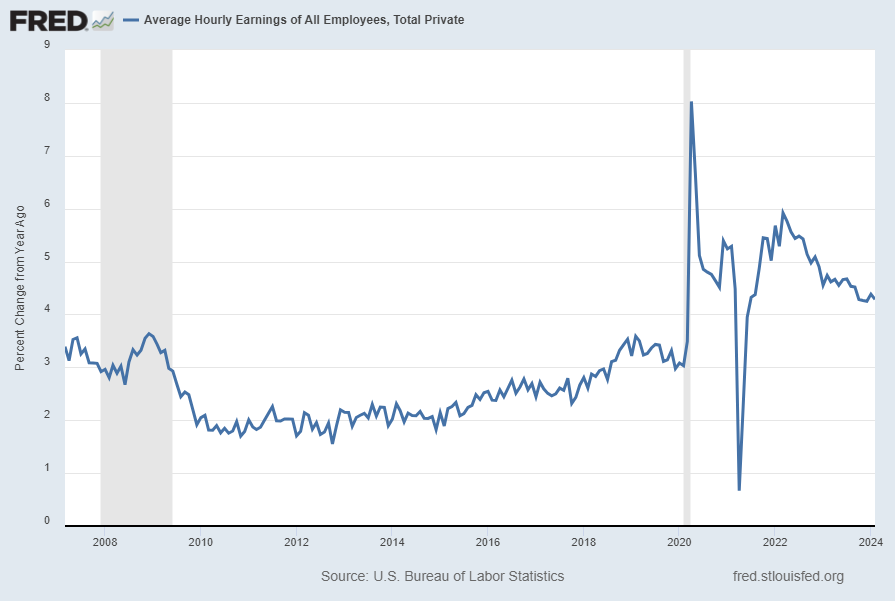
This next chart depicts this same measure on a “Percentage Change From A Year Ago” basis. While not totally surprising, I find the decline from 2009 and subsequent trend to be disconcerting:
(click on chart to enlarge image)(chart last updated 3-8-24)
–
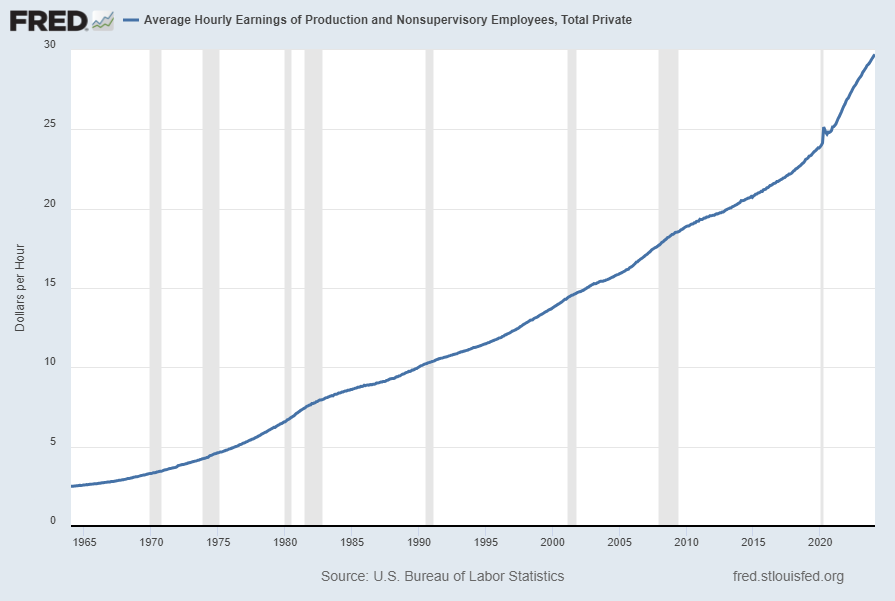
There are slightly different measures available from a longer-term perspective. Pictured below is another measure, the Average Hourly Earnings of Production and Nonsupervisory Employees – Total Private (FRED series AHETPI)(current value = $29.71):
(click on chart to enlarge image)(chart last updated 3-8-24)
Data Source: FRED, Federal Reserve Economic Data, Federal Reserve Bank of St. Louis: Average Hourly Earnings of Production and Nonsupervisory Employees: Total Private [AHETPI] ; U.S. Department of Labor: Bureau of Labor Statistics; accessed March 8, 2024: http://research.stlouisfed.org/fred2/series/AHETPI
–
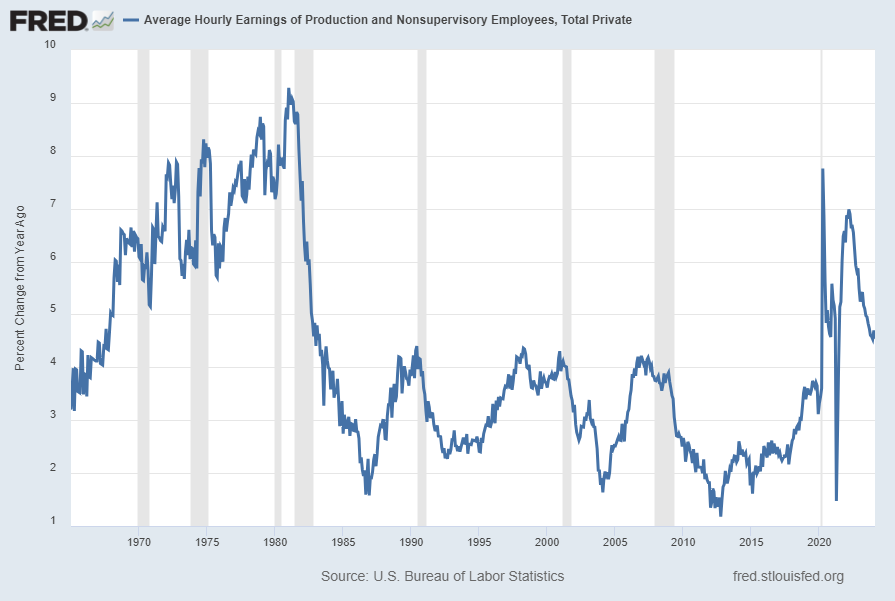
Pictured below is this AHETPI measure on a “Percentage Change From A Year Ago” basis. While not totally surprising, I find the decline from 2009 and subsequent trend to be disconcerting:
(click on chart to enlarge image)(chart last updated 3-8-24)
I will continue to actively monitor these trends, especially given the post-2009 dynamics.
_________
I post various economic indicators and indices because I believe they should be carefully monitored. However, as those familiar with this site are aware, I do not necessarily agree with what they depict or imply.
_____
The Special Note summarizes my overall thoughts about our economic situation
Shortly after each monthly employment report I have been posting a continual series titled “3 Critical Unemployment Charts.”
Of course, there are many other employment charts that can be displayed as well.
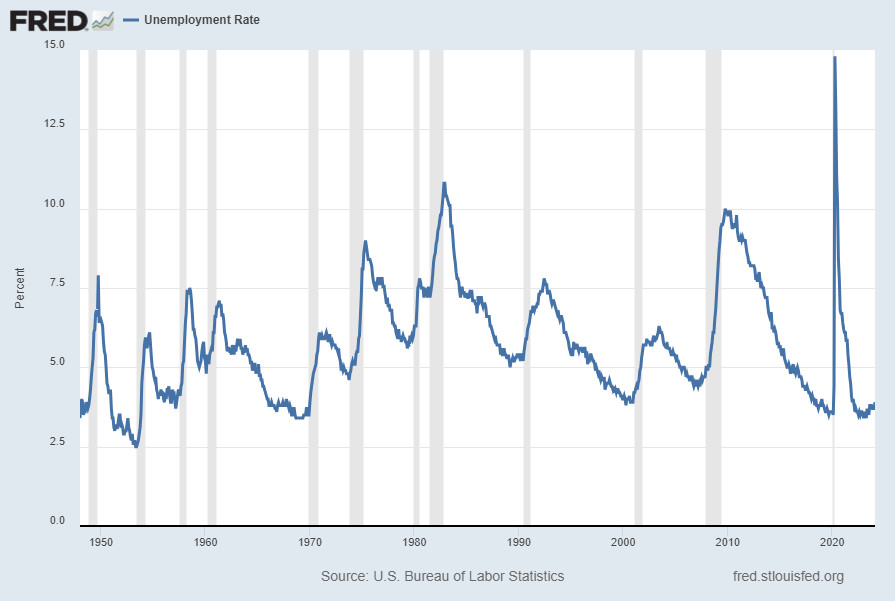
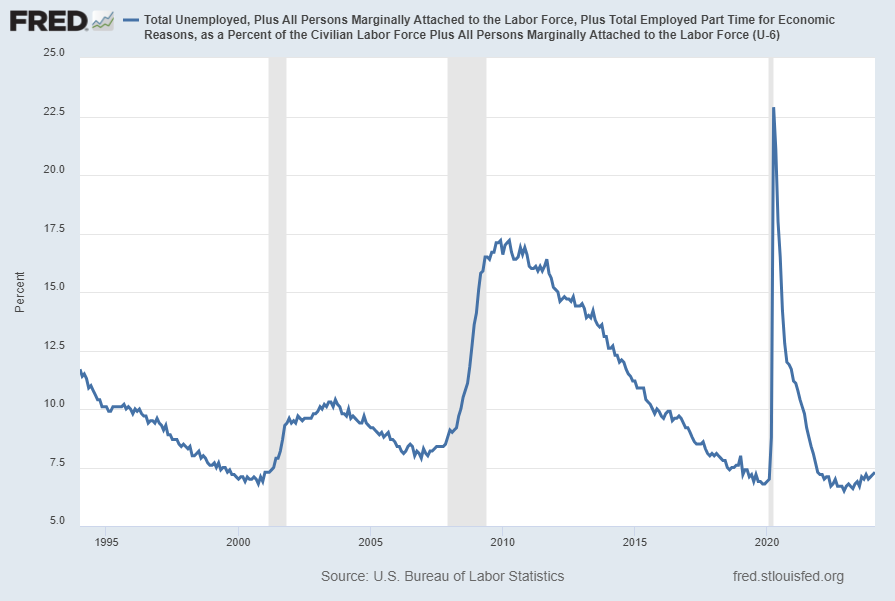
For reference purposes, below are the U-3 and U-6 Unemployment Rate charts from a long-term historical perspective. Both charts are from the St. Louis Fed site. The U-3 measure is what is commonly referred to as the official unemployment rate; whereas the U-6 rate is officially (per Bureau of Labor Statistics) defined as:
Total unemployed, plus all persons marginally attached to the labor force, plus total employed part time for economic reasons, as a percent of the civilian labor force plus all persons marginally attached to the labor force
Of note, many economic observers use the U-6 rate as a (closer) proxy of the actual unemployment rate rather than that depicted by the U-3 measure.
Here is the U-3 chart, currently showing a 3.9% unemployment rate:
Data Source: FRED, Federal Reserve Economic Data, Federal Reserve Bank of St. Louis: Civilian Unemployment Rate [UNRATE] ; U.S. Department of Labor: Bureau of Labor Statistics; accessed March 8, 2024: http://research.stlouisfed.org/fred2/series/UNRATE
–
Here is the U-6 chart, currently showing a 7.3% unemployment rate:
Data Source: FRED, Federal Reserve Economic Data, Federal Reserve Bank of St. Louis: Total unemployed, plus all marginally attached workers plus total employed part time for economic reasons [U6RATE] ; U.S. Department of Labor: Bureau of Labor Statistics; accessed March 8, 2024: http://research.stlouisfed.org/fred2/series/U6RATE
_____
The Special Note summarizes my overall thoughts about our economic situation
As I have commented previously, as in the October 6, 2009 post (“A Note About Unemployment Statistics”), in my opinion the official methodologies used to measure the various job loss and unemployment statistics do not provide an accurate depiction; they serve to understate the severity of unemployment.
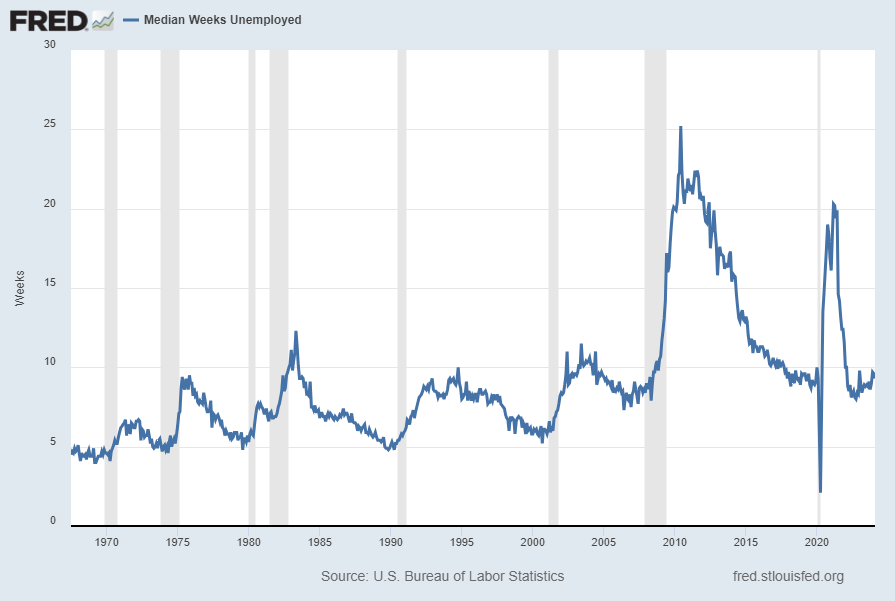
However, even if one chooses to look at the official statistics, the following charts provide an interesting (and disconcerting) long-term perspective of certain aspects of the officially-stated unemployment (and, in the third chart, employment) situation.
The three charts below are from the St. Louis Fed site. Here is the Median Duration of Unemployment (current value = 9.3 weeks):
(click on charts to enlarge images)(charts updated as of 3-8-24)
Data Source: FRED, Federal Reserve Economic Data, Federal Reserve Bank of St. Louis: Median Duration of Unemployment [UEMPMED] ; U.S. Department of Labor: Bureau of Labor Statistics; accessed March 8, 2024: http://research.stlouisfed.org/fred2/series/UEMPMED
–
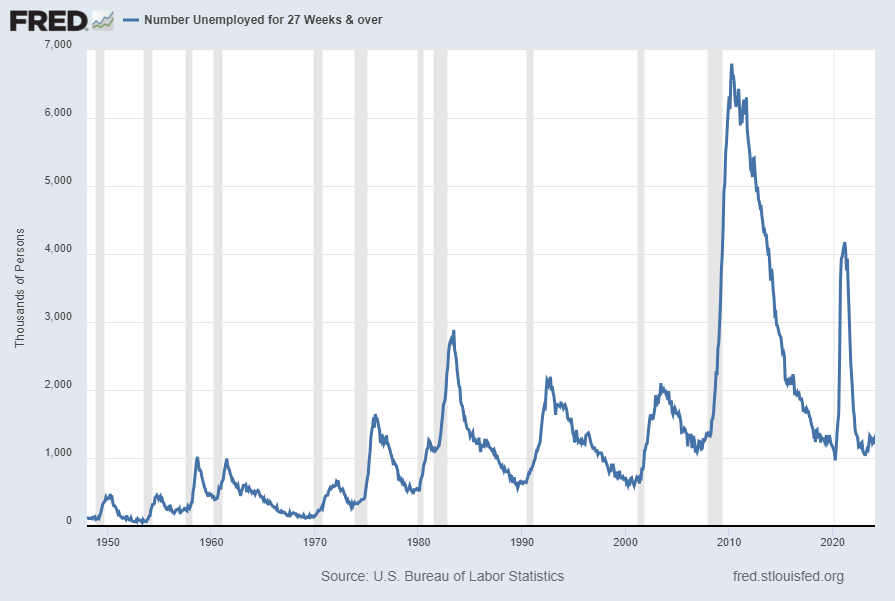
Here is the chart for Unemployed 27 Weeks and Over (current value = 1.203 million):
Data Source: FRED, Federal Reserve Economic Data, Federal Reserve Bank of St. Louis: Civilians Unemployed for 27 Weeks and Over [UEMP27OV] ; U.S. Department of Labor: Bureau of Labor Statistics; accessed March 8, 2024: http://research.stlouisfed.org/fred2/series/UEMP27OV
–
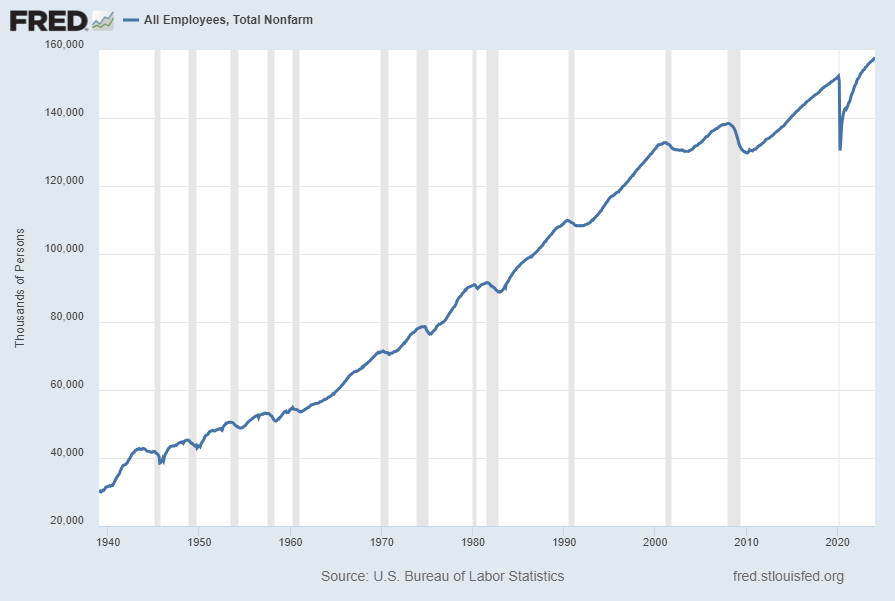
Here is the chart for Total Nonfarm Payroll (current value = 157.808 million):
Data Source: FRED, Federal Reserve Economic Data, Federal Reserve Bank of St. Louis: All Employees: Total Nonfarm [PAYEMS] ; U.S. Department of Labor: Bureau of Labor Statistics; accessed March 8, 2024: https://research.stlouisfed.org/fred2/series/PAYEMS
–
Our unemployment problem is severe. The underlying dynamics of the current – and especially future – unemployment situation remain exceedingly worrisome. These dynamics are numerous and complex, and greatly lack recognition and understanding.
My commentary regarding unemployment is generally found in the “Unemployment” category. This commentary includes the page titled “U.S. Unemployment Trends,” which discusses various problematical issues concerning the present and future employment situation.
_____
The Special Note summarizes my overall thoughts about our economic situation
I found President Biden’s State of the Union Address last night (March 7, 2024) to contain some noteworthy comments. While I could comment extensively on many parts of the speech, for now I will indicate excerpts that I found most relevant with regard to the economic situation, and may comment upon them at a future point. I am highlighting these excerpts for many reasons; it should be noted that I do not necessarily agree with any or all of them.
Here are the excerpts I found most relevant, in the order they occurred in the speech:
I inherited an economy that was on the brink. Now our economy is the envy of the world!
15 million new jobs in just three years – that’s a record!
Unemployment at 50-year lows.
A record 16 million Americans are starting small businesses and each one is an act of hope.
With historic job growth and small business growth for Black, Hispanic, and Asian-Americans.
800,000 new manufacturing jobs in America and counting.
More people have health insurance today than ever before.
The racial wealth gap is the smallest it’s been in 20 years.
Wages keep going up and inflation keeps coming down!
Inflation has dropped from 9% to 3% – the lowest in the world!
And trending lower.
And now instead of importing foreign products and exporting American jobs, we’re exporting American products and creating American jobs – right here in America where they belong!
And the American people are beginning to feel it.
Consumer studies show consumer confidence is soaring.
Buy American has been the law of the land since the 1930s.
Past administrations including my predecessor failed to Buy American.
Not any more.
On my watch, federal projects like helping to build American roads bridges and highways will be made with American products built by American workers creating good-paying American jobs!
Thanks to my Chips and Science Act the United States is investing more in research and development than ever before.
During the pandemic a shortage of semiconductor chips drove up prices for everything from cell phones to automobiles.
Well instead of having to import semiconductor chips, which America invented I might add, private companies are now investing billions of dollars to build new chip factories here in America!
Creating tens of thousands of jobs many of them paying over $100,000 a year and don’t require a college degree.
In fact my policies have attracted $650 Billion of private sector investments in clean energy and advanced manufacturing creating tens of thousands of jobs here in America!
Thanks to our Bipartisan Infrastructure Law, 46,000 new projects have been announced across your communities – modernizing our roads and bridges, ports and airports, and public transit systems.
also:
I’ve been delivering real results in a fiscally responsible way.
I’ve already cut the federal deficit by over one trillion dollars.
I signed a bipartisan budget deal that will cut another trillion dollars over the next decade.
And now it’s my goal to cut the federal deficit $3 trillion more by making big corporations and the very wealthy finally pay their fair share.
_____
_____
The Special Note summarizes my overall thoughts about our economic situation
The overall Index increased by 11 points from last quarter to 85, slightly above its historic average of 83 for the first time since 2022. CEO plans for capital investment and expectations for sales are up by double digits from last quarter. Additionally, plans for hiring ticked up modestly.
also:
In their second estimate of 2024 U.S. GDP growth, CEOs projected 2.1% growth for the year. This is up marginally from the 1.9% growth projected in their first estimate last quarter.
In a special question posed this quarter, CEOs were asked whether they believe that government policies are undermining American free enterprise. Over 75% of CEOs answered “yes.” Of those who answered in the affirmative, 92% of CEOs cited excessive regulation and 63% cited overreaching antitrust actions as policies that are undermining or present a risk to the free enterprise system and the benefits it provides.
On February 8, 2024, The Conference Board released the Q1 2024 Measure Of CEO Confidence. The overall measure of CEO Confidence was at 53, up from the previous reading of 46. [note: a reading of more than 50 points reflects more positive than negative responses]
Notable excerpts from this Press Release include:
CEOs’ views of current economic conditions improved markedly. In the Q1 survey, 32% of CEOs reported general economic conditions to be better than they were six months ago, up from just 18% in Q4 of last year. Just 22% said conditions were worse, down from 32% in Q4. Similarly, future expectations strengthened: 36% of CEOs in Q1 expect general economic conditions to improve over the next six months, up from 19% last quarter. Moreover, only 27% expect conditions to worsen, down significantly from 47%. CEO expectations for conditions in their own industry followed a similar upward trend.
_____
Additional details can be seen in the sources mentioned above.
_____
I post various economic forecasts because I believe they should be carefully monitored. However, as those familiar with this site are aware, I do not necessarily agree with many of the consensus estimates and much of the commentary in these forecast surveys.
_____
The Special Note summarizes my overall thoughts about our economic situation
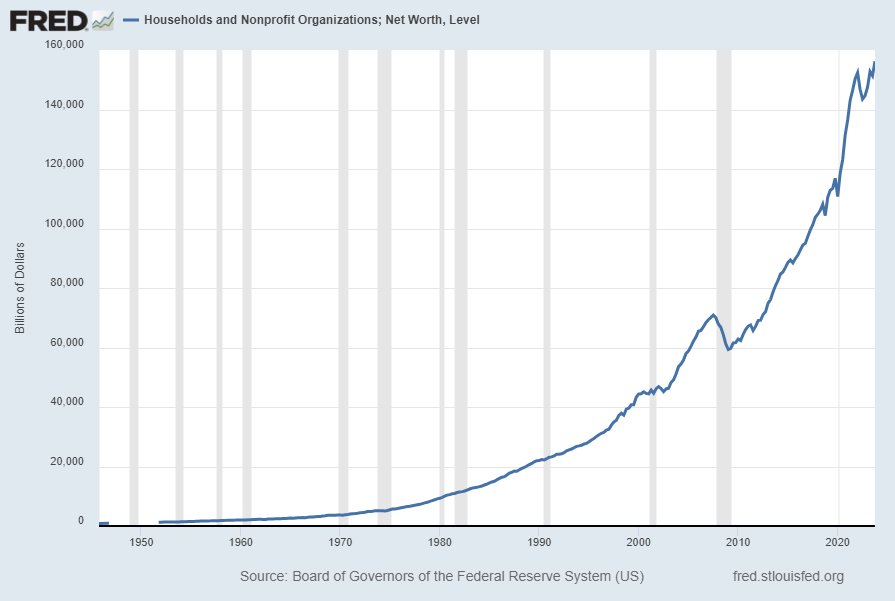
For reference purposes, here is Total Household Net Worth from a long-term perspective (from 1945:Q4 through 2023:Q4). The last value (as of the March 7, 2024 update) is $156.214403 Trillion:
(click on each chart to enlarge image)
–
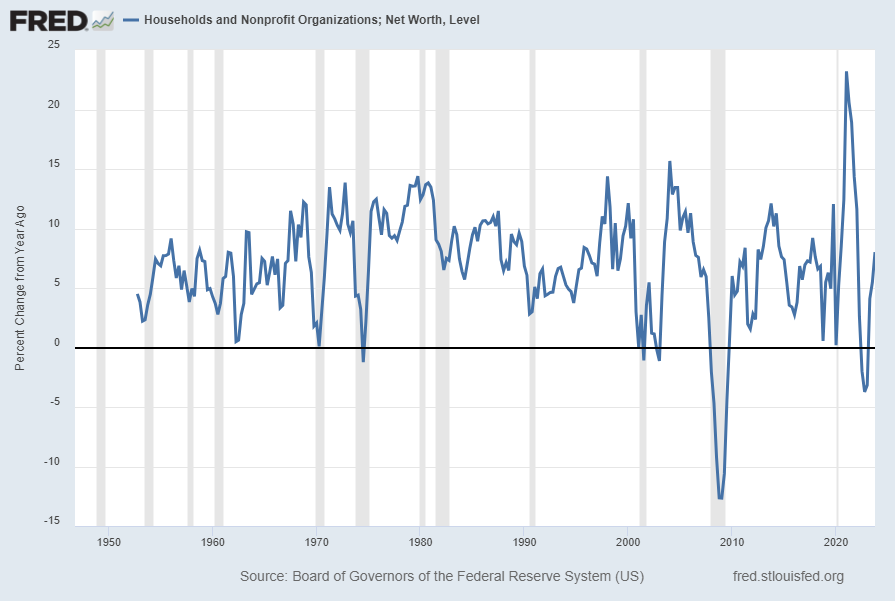
Also of interest is the same metric presented on a “Percent Change from a Year Ago” basis, with a current value of 8.0%:
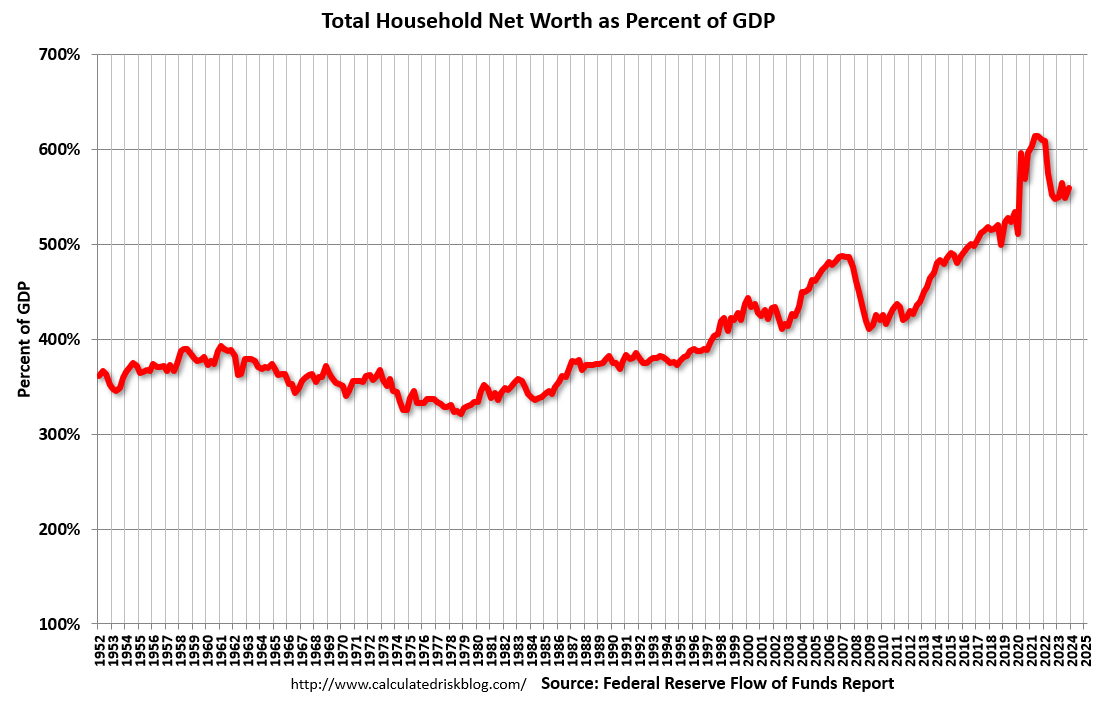
As seen in the above-referenced CalculatedRisk post:
The net worth of households and nonprofits rose to $156.2 trillion during the fourth quarter of 2023. The value of directly and indirectly held corporate equities increased $4.7 trillion and the value of real estate decreased $0.6 trillion.
As one can see in the above chart, the first outsized peak was in 2000, and attained after the stock market bull market / stock market bubbles and economic strength. The second outsized peak was in 2007, right near the peak of the housing bubble as well as near the stock market peak. A third outsized peak appears to have formed between 2021 and 2022.
_____
The Special Note summarizes my overall thoughts about our economic situation