Thursday, March 21, 2024

Jerome Powell’s March 20, 2024 Press Conference – Notable Aspects

On Wednesday, March 20, 2024 FOMC Chair Jerome Powell gave his scheduled March 2024 FOMC Press Conference. (link of video and related materials)

Below are Jerome Powell’s comments I found most notable – although I don’t necessarily agree with them – in the order they appear in the transcript.  These comments are excerpted from the “Transcript of Chair Powell’s Press Conference“ (preliminary)(pdf) of March 20, 2024, with the accompanying “FOMC Statement” and “Summary of Economic Projections” (pdf) dated March 20, 2024.

Excerpts from Chair Powell’s opening comments:

Inflation has eased notably over the past year but remains above our longer-run goal of 2 percent.  Estimates based on the Consumer Price Index and other data indicate that total PCE prices rose 2.5 percent over the 12 months ending in February; and that, excluding the volatile food and energy categories, core PCE prices rose 2.8 percent.  Longer-term inflation expectations appear to remain well anchored, as reflected in a broad range of surveys of households, businesses, and forecasters, as well as measures from financial markets.  The median projection in the SEP for total PCE inflation falls to 2.4 percent this year, 2.2 percent next year, and 2 percent in 2026.

also:

The Fed’s monetary policy actions are guided by our mandate to promote maximum employment and stable prices for the American people.  My colleagues and I are acutely aware that high inflation imposes significant hardship as it erodes purchasing power, especially for those least able to meet the higher costs of essentials like food, housing, and transportation.  We are strongly committed to returning inflation to our 2 percent objective.  

The Committee decided at today’s meeting to maintain the target range for the federal funds rate at 5-1/4 to 5-1/2 percent and to continue the process of significantly reducing our securities holdings.  As labor market tightness has eased and progress on inflation has continued, the risks to achieving our employment and inflation goals are coming into better balance.  We believe that our policy rate is likely at its peak for this tightening cycle and that, if the economy evolves broadly as expected, it will likely be appropriate to begin dialing back policy restraint at some point this year.  The economic outlook is uncertain, however, and we remain highly attentive to inflation risks.  We are prepared to maintain the current target range for the federal funds rate for longer, if appropriate.

Excerpts of Jerome Powell’s responses as indicated to various questions:

NICK TIMIRAOS.  How much of that inflation that we’ve seen so far this year do you chalk up to one-off calendar adjustment affects following a period of high inflation versus some change in the trend we saw the second half of last year? 

CHAIR POWELL.  I want to start by being, saying, I always try to be careful about dismissing data that we don’t like. So, you need to check yourself on that and I’ll do that, but so I would say the January number, which was very high, the January CPI and PCE numbers were quite high, there’s reason to think that there could be seasonal affects there. But nonetheless, we don’t want to be completely dismissive of it. The February number was high, higher than expectations, but we have it at currently well below 30 basis points core PCE, which is not terribly high. So it’s not like the January number. But I take the two of them together and I think they haven’t really changed the overall story which is that of inflation moving down gradually on a sometimes-bumpy road toward two percent. I don’t think that story has changed. I also don’t think that those readings added to anyone’s confidence that we’re moving closer to that point, but we didn’t– the last thing I’ll say is we didn’t excessively celebrate the good inflation readings we got in the last seven months of last year. We didn’t take too much signal out of that, what you heard us saying was that we needed to see more that we could, that we wanted to be careful about that decision and we’re not going to overreact as well to these two months of data, nor are we going to ignore them. 

also:

CHRIS RUGABER.  Hi, Chris Rugaber, the Associated Press. Thank you. In the projections there is an increase in the neutral rate as you know, and higher rates, a quarter point higher rates projected in 2025, 2026. Can you speak about what might be behind that? Is there a real sense here that the economy has perhaps changed in some way that higher rates will be needed in the future? Thank you. 

CHAIR POWELL.  So, you’re right. They’re pretty midst changes but you’re right, there was an uptick in the longer run rate, and also there’s a 25 basis point increase in ’25 and ’26. In terms of are rates going to be higher in the longer run, if that’s really your question, I don’t think we know that. I think it’s, we think that rates were generally low during the pre-pandemic postglobal financial crisis era, for reasons that are mostly important, slow moving large things like demographics and productivity and that sort of thing. Things that don’t move quickly. But I don’t think we know. I mean my instinct would be that rates will not go back down to the very low levels that we saw where all around the world there were long run rates that were at or below zero in some cases. I don’t see rates going back down to that level, but I think there’s tremendous uncertainty around that. 

CHRIS RUGABER.  Great, and just a quick follow; on the projections you also have 2.6 percent core inflation for the end of this year. It’s already at, or you mentioned it being 2.8 in February, I mean that doesn’t sound like much disinflation at all. So are you really, are you still confident or, at the last press conference you sounded pretty optimistic you would get more confidence in the end of this year. Is it right to say that this suggests you’re not seeing a lot of disinflation this year compared to what we’ve seen 2023 and so forth? 

CHAIR POWELL.  I think that that, the higher yearend number reflects the data we’ve seen so far this year. Because you’re now in this year, so I think that– Sorry, say your last part of your question again. 

CHRIS RUGABER. Are you still optimistic that you’ll get the confidence you need this year? 

CHAIR POWELL.  I think if you look at the SEP, what it says is that it is still likely in most people’s view that we will achieve that confidence and that there will be rate cuts. But that’s really going to depend on the incoming data, it is. The other thing is, in the second half of the year you have some pretty low readings so it might be harder to make progress as you move that 12-month window forward. Nonetheless, we’re looking for data that confirm the kind of low readings that we had last year and give us a higher degree of confidence that what we saw was really inflation moving sustainably down to two percent, toward two percent. 

also:

NEIL IRWIN.  Hi Chair Powell, Neil Irwin with Axios. How do you assess the state of financial conditions right now and particularly, in particular do you view the kind of easing financial conditions since the fall is consistent and compatible with what you’re trying to achieve on the inflation mandate? 

CHAIR POWELL.  So we think, there are many different financial conditions indicators and you can kind of see different answers to that question. But ultimately, we do think that financial conditions are weighing on economic activity and we think you see that in, a great place to see it is in the labor market where you’ve seen demand cooling off a little bit from the extremely high levels and there I would point to job openings, quits, surveys, the hiring rate, things like that are really demand. There are also supply-side things happening, but I think those are demand side things happening. We saw, that’s been a question for a while, we did see progress on inflation last year, significant progress despite financial conditions sometimes being tighter, sometimes looser. 

_____

_____

The Special Note summarizes my overall thoughts about our economic situation

SPX at 5246.65 as this post is written

Chicago Fed National Financial Conditions Index (NFCI)

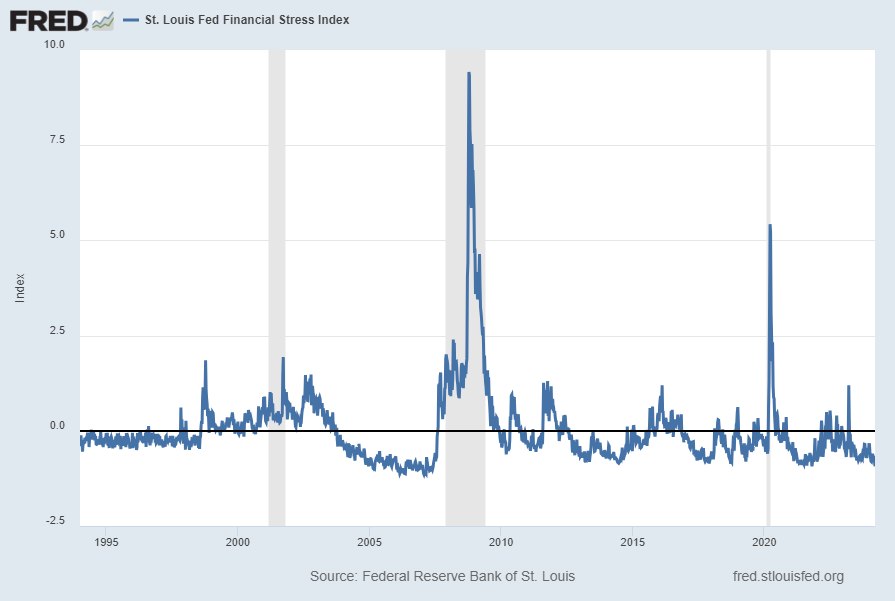
The St. Louis Fed’s Financial Stress Index (STLFSI4) is one index that is supposed to measure stress in the financial system. Its reading as of the March 21, 2024 update (reflecting data through March 15, 2024) is -.9347:

STLFSI4

source: Federal Reserve Bank of St. Louis, St. Louis Fed Financial Stress Index [STLFSI4], retrieved from FRED, Federal Reserve Bank of St. Louis; accessed March 21, 2024: https://fred.stlouisfed.org/series/STLFSI4

Of course, there are a variety of other measures and indices that are supposed to measure financial stress and other related issues, both from the Federal Reserve as well as from private sources.

Two other indices that I regularly monitor include the Chicago Fed National Financial Conditions Index (NFCI) as well as the Chicago Fed Adjusted National Financial Conditions Index (ANFCI).

Here are summary descriptions of each, as seen in FRED:

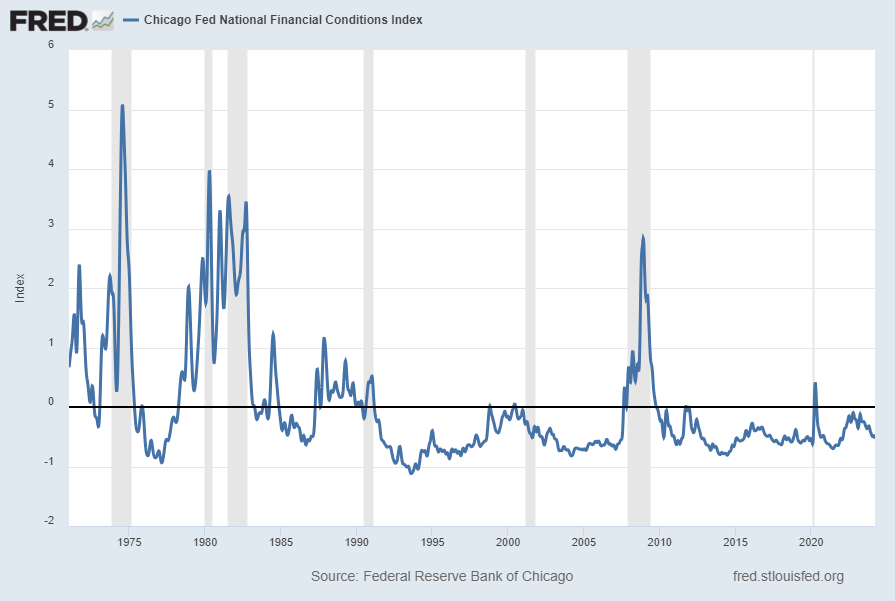
The National Financial Conditions Index (NFCI) measures risk, liquidity and leverage in money markets and debt and equity markets as well as in the traditional and “shadow” banking systems. Positive values of the NFCI indicate financial conditions that are tighter than average, while negative values indicate financial conditions that are looser than average.

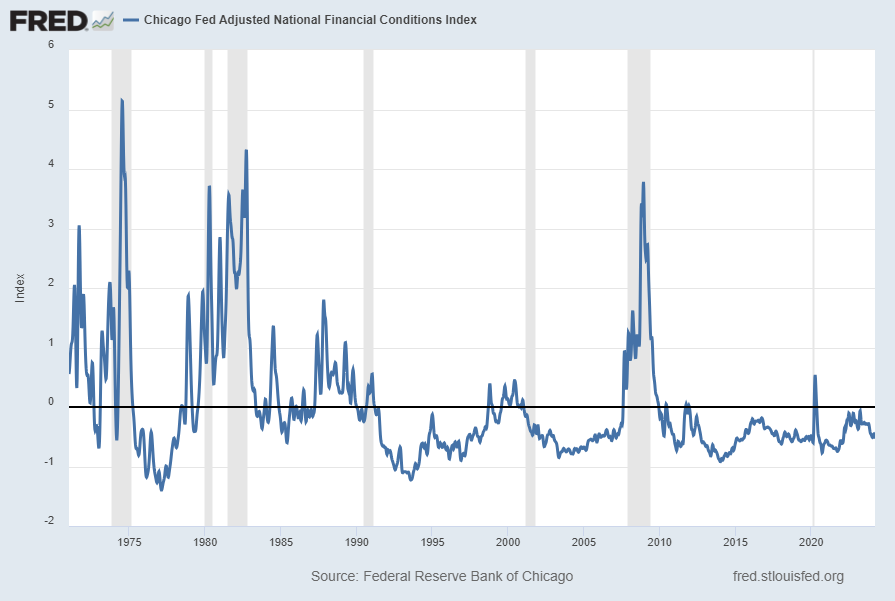
The adjusted NFCI (ANFCI). This index isolates a component of financial conditions uncorrelated with economic conditions to provide an update on how financial conditions compare with current economic conditions.

For further information, please visit the Federal Reserve Bank of Chicago’s web site:

http://www.chicagofed.org/webpages/publications/nfci/index.cfm

Below are the most recently updated charts of the NFCI and ANFCI, respectively.

The NFCI chart below was last updated on March 20, 2024 incorporating data from January 8, 1971 through March 15, 2024 on a weekly basis.  The March 15 value is -.53056:

NFCI

Data Source: FRED, Federal Reserve Economic Data, Federal Reserve Bank of St. Louis; accessed March 21, 2024:  
http://research.stlouisfed.org/fred2/series/NFCI

–

The ANFCI chart below was last updated on March 20, 2024 incorporating data from January 8, 1971 through March 15, 2024, on a weekly basis.  The March 15, 2024 value is -.53183:

ANFCI

Data Source: FRED, Federal Reserve Economic Data, Federal Reserve Bank of St. Louis; accessed March 21, 2024:  
http://research.stlouisfed.org/fred2/series/ANFCI

_________

I post various indicators and indices because I believe they should be carefully monitored.  However, as those familiar with this site are aware, I do not necessarily agree with what they depict or imply.

_____

The Special Note summarizes my overall thoughts about our economic situation

SPX at 5254.84 as this post is written

Tuesday, March 19, 2024

Trends Of S&P500 Earnings Forecasts

S&P500 earnings trends and estimates are a notably important topic, for a variety of reasons, at this point in time.

FactSet publishes a report titled “Earnings Insight” that contains a variety of information including the trends and expectations of S&P500 earnings.

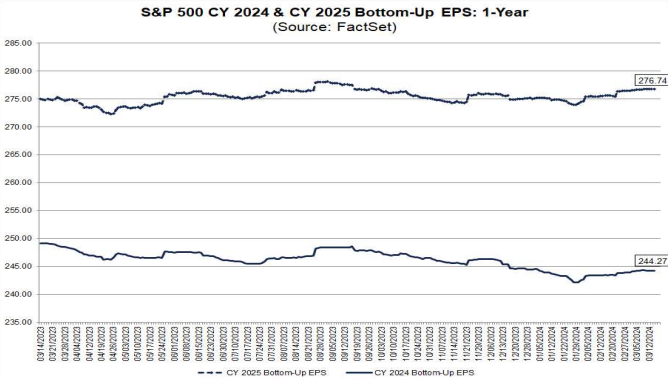
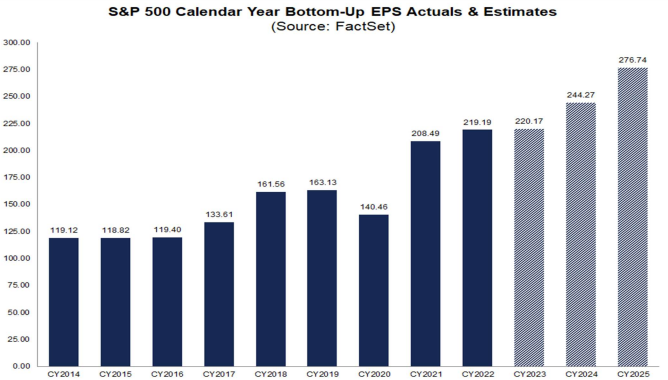
For reference purposes, here are two charts as seen in the “Earnings Insight” report of March 15, 2024:

from page 32:

(click on charts to enlarge images)

S&P500 EPS

from page 33:

S&P500 EPS 2014-2025

_____

I post various economic forecasts because I believe they should be carefully monitored.  However, as those familiar with this site are aware, I do not agree with many of the consensus estimates and much of the commentary in these forecast surveys.

_____

The Special Note summarizes my overall thoughts about our economic situation

SPX at 5134.86 as this post is written

Monday, March 18, 2024

S&P500 EPS Forecasts For 2023-2025 As Of March 15, 2024

As many are aware, Refinitiv publishes earnings estimates for the S&P500.  (My other posts concerning S&P earnings estimates can be found under the S&P500 Earnings label)

The following estimates are from Exhibit 24 of the “S&P500 Earnings Scorecard” (pdf) of March 15, 2024, and represent an aggregation of individual S&P500 component “bottom up” analyst forecasts.  For reference, the Year 2014 value is $118.78/share; the Year 2015 value is $117.46/share; the Year 2016 value is $118.10/share; the Year 2017 value is $132.00/share; the Year 2018 value is $161.93/share; the Year 2019 value is $162.93/share; the Year 2020 value is $139.72/share; the year 2021 value is $208.12/share; and the year 2022 value is $218.09/share:

Year 2023 estimate:

$222.08/share

Year 2024 estimate:

$243.44/share

Year 2025 estimate:

$276.25/share

_____

I post various economic forecasts because I believe they should be carefully monitored.  However, as those familiar with this site are aware, I do not agree with many of the consensus estimates and much of the commentary in these forecast surveys.

_____

The Special Note summarizes my overall thoughts about our economic situation

SPX at 5146.44 as this post is written

Standard & Poor’s S&P500 EPS Estimates 2023 – 2025 – March 14, 2024

As many are aware, Standard & Poor’s publishes earnings estimates for the S&P500.  (My posts concerning their estimates can be found under the S&P500 Earnings label)

For reference purposes, the most current estimates are reflected below, and are as of March 14, 2024:

Year 2023 estimates add to the following:

-From a “bottom up” perspective, operating earnings of $213.52/share

-From a “bottom up” perspective, “as reported” earnings of $192.63/share

Year 2024 estimates add to the following:

-From a “bottom up” perspective, operating earnings of $240.77/share

-From a “bottom up” perspective, “as reported” earnings of $218.53/share

Year 2025 estimates add to the following:

-From a “bottom up” perspective, operating earnings of $274.73/share

-From a “bottom up” perspective, “as reported” earnings of $251.32/share

_____

I post various economic forecasts because I believe they should be carefully monitored.  However, as those familiar with this site are aware, I do not agree with many of the consensus estimates and much of the commentary in these forecast surveys.

_____

The Special Note summarizes my overall thoughts about our economic situation

SPX at 5157.70 as this post is written

Tuesday, March 12, 2024

NFIB Small Business Optimism – February 2024

The February NFIB Small Business Optimism report was released today, March 12, 2024. The headline of the Economic Trends report is “Optimism on Main Street Declines as Inflation Looms as Top Challenge.”

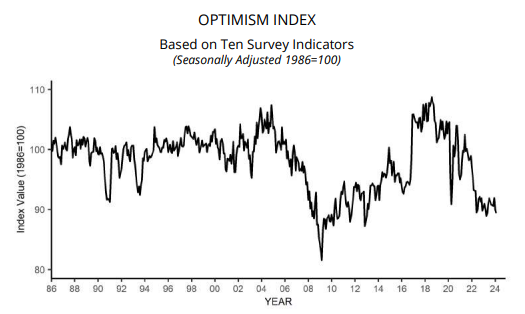
The Index of Small Business Optimism decreased by .5 point to 89.4.

Here is an excerpt that I find particularly notable (but don’t necessarily agree with):

The NFIB Small Business Optimism Index decreased in February to 89.4, marking the 26th consecutive month below the 50-year average of 98. Twenty-three percent of small business owners reported that inflation was their single most important business problem in operating their business, up three points from last month and replacing labor quality as the top problem.

Below is a chart of the NFIB Small Business Optimism chart, as seen in the full February 2023 NFIB Small Business Economic Trends (pdf) report:

NFIB Small Business Optimism Index 89.4

_____

The Special Note summarizes my overall thoughts about our economic situation

SPX at 5177.36 as this post is written

Building Financial Danger – March 12, 2024 Update

My overall analysis indicates a continuing elevated and growing level of financial danger which contains many worldwide and U.S.-specific “stresses” of a very complex nature. I have written numerous posts on this site concerning both ongoing and recent “negative developments.”  These developments, as well as other exceedingly problematical conditions, have presented a highly perilous economic environment that endangers the overall financial system.

Also of ongoing immense importance is the existence of various immensely large asset bubbles, a subject of which I have extensively written.  While all of these asset bubbles are wildly pernicious and will have profound adverse future implications, hazards presented by the bond market bubble are especially notable.

Predicting the specific timing and extent of a stock market crash is always difficult, and the immense complexity of today’s economic situation makes such a prediction even more challenging. With that being said, my analyses continue to indicate that a near-term exceedingly large (from an ultra long-term perspective) stock market crash – that would also involve (as seen in 2008) various other markets – will occur. [note: the “next crash” and its aftermath has paramount significance and implications, as discussed in the post of January 6, 2012 titled “The Next Crash And Its Significance“ and various subsequent posts in the “Economic Depression” label]

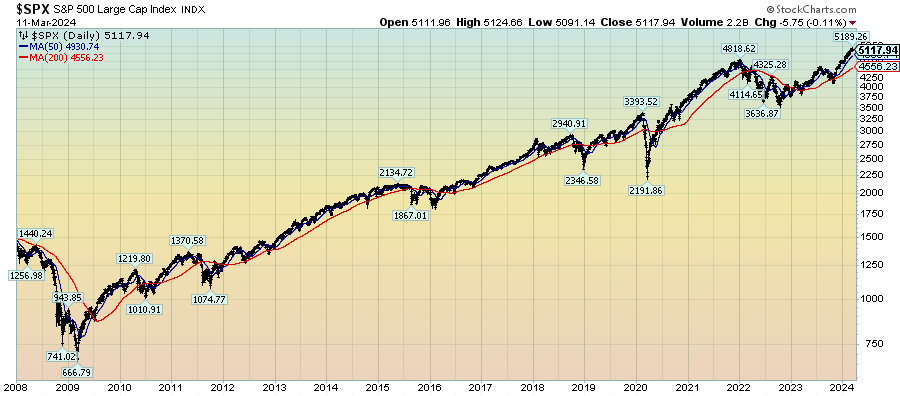
As reference, below is a daily chart since 2008 of the S&P500 (through March 11, 2024 with a last price of 5117.95), depicted on a LOG scale, indicating both the 50dma and 200dma as well as price labels:

(click on chart to enlarge image)(chart courtesy of StockCharts.com; chart creation and annotation by the author)

S&P500 since 2008

_____

The Special Note summarizes my overall thoughts about our economic situation

SPX at 5117.94 as this post is written

Recession Probability Models – March 2024

There are a variety of economic models that are supposed to predict the probabilities of recession.

While I don’t agree with the methodologies employed or probabilities of impending economic weakness as depicted by the following two models, I think the results of these models should be monitored.

Please note that each of these models is updated regularly, and the results of these – as well as other recession models – can fluctuate significantly.

The first is the “Yield Curve as a Leading Indicator” from the New York Federal Reserve.  I wrote a post concerning this measure on March 1, 2010, titled “The Yield Curve as a Leading Indicator.”

Currently (last updated March 11, 2024 using data through February 2024) this “Yield Curve” model shows a 58.3127% probability of a recession in the United States twelve months ahead.  For comparison purposes, it showed a 61.473% probability through January 2024, and a chart going back to 1960 is seen at the “Probability Of U.S. Recession Predicted by Treasury Spread.” (pdf)

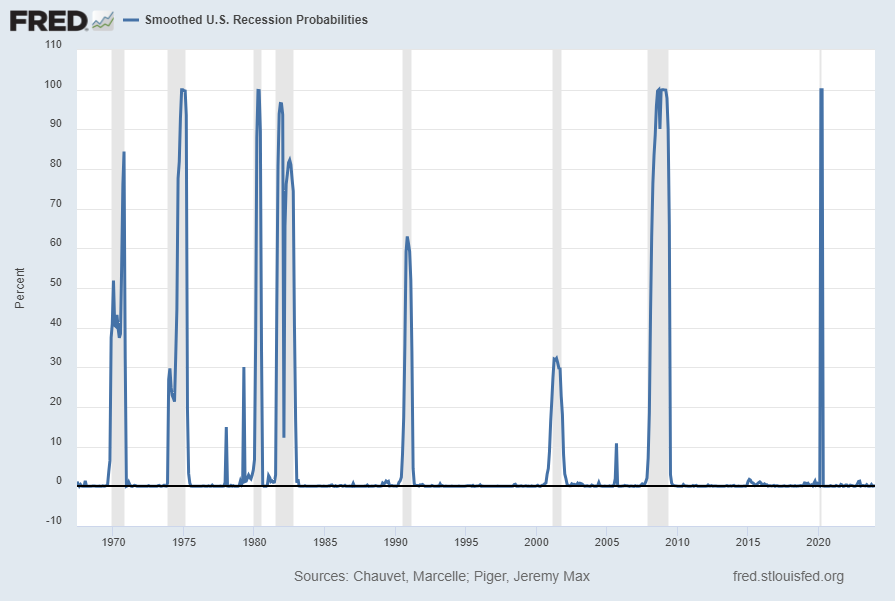
The second model is from Marcelle Chauvet and Jeremy Piger.  This model is described on the St. Louis Federal Reserve site (FRED) as follows:

Smoothed recession probabilities for the United States are obtained from a dynamic-factor markov-switching model applied to four monthly coincident variables: non-farm payroll employment, the index of industrial production, real personal income excluding transfer payments, and real manufacturing and trade sales. This model was originally developed in Chauvet, M., “An Economic Characterization of Business Cycle Dynamics with Factor Structure and Regime Switching,” International Economic Review, 1998, 39, 969-996. (http://faculty.ucr.edu/~chauvet/ier.pdf)

Additional details and explanations can be seen on the “U.S. Recession Probabilities” page.

This model, last updated on March 1, 2024 currently shows a .26% probability using data through January 2024.

Here is the FRED chart:

Smoothed U.S. Recession Probabilities

Data Source:  Piger, Jeremy Max and Chauvet, Marcelle, Smoothed U.S. Recession Probabilities [RECPROUSM156N], retrieved from FRED, Federal Reserve Bank of St. Louis, accessed March 11, 2024:  
http://research.stlouisfed.org/fred2/series/RECPROUSM156N

–

The two models featured above can be compared against measures seen in recent posts.  For instance, as seen in the January 14, 2024 post titled “The January 2024 Wall Street Journal Economic Forecast Survey“ economists surveyed averaged a 39% probability of a U.S. recession within the next 12 months.

_____

The Special Note summarizes my overall thoughts about our economic situation

SPX at 5117.94 as this post is written