Thursday, June 14, 2012

NFIB Small Business Optimism – May 2012


The May NFIB Small Business Optimism report was released on June 12.  The headline of the Press Release is “Small-Business Optimism Index Stagnates:  No Progress Made for Small-Business Sector in May.”

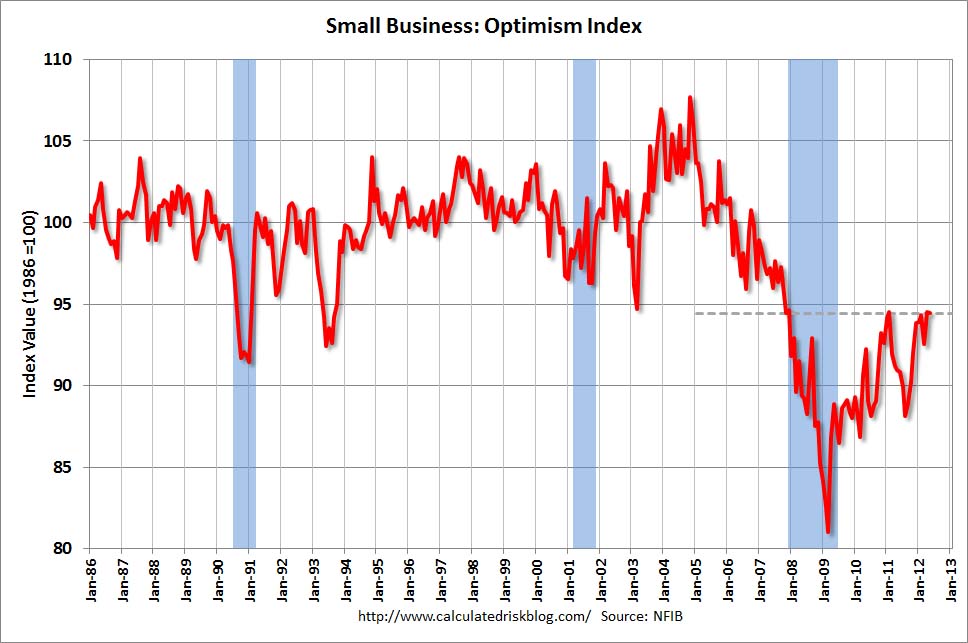
The Index of Small Business Optimism fell by .1 point in May, to 94.4.

Here are some excerpts from the report that I find particularly notable:
Dropping just a tenth-of-a-point in the month of May, the Nation Federation of Independent Business (NFIB) Index of Small Business Optimism came in at 94.4. A reading of 94.4 is historically low and consistent with the sub-par performance of GDP and employment growth. The individual indicators were mixed, with expected sales in a three month decline. However, some employment components improved and profit trends remained relatively stable after its sharp gain in April.
also:
In the last year, small-business optimism has limped along, and today the sector is no better off than it was just over a year ago,” said NFIB Chief Economist William Dunkelberg. “The lack of progress is discouraging, producing no signs that economic activity will pick up this year at all.
also:
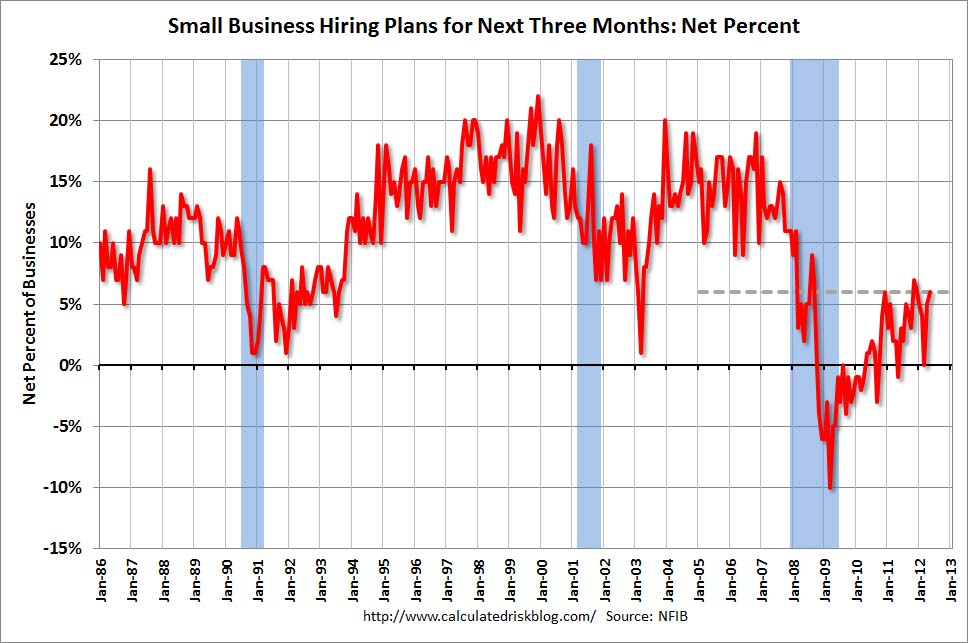
Levels of hiring and spending remained depressed in May, as did plans to do more in the near future. Expectations for increasing future sales continued to be weak, far below readings recorded in any other recovery period since 1973.
also:
It appears that sales are improving modestly in the small-business sector. The net percent of all owners (seasonally adjusted) reporting higher nominal sales over the past three months dropped 2 points, falling to two percent, the second highest reading in 60 months (the highest was April’s reading of 4 percent). The low for the cycle (July 2009) was a net negative 34 percent reporting quarter over quarter gains, making the last few monthly readings a reason to be encouraged.
In conjunction with this May NFIB Small Business Optimism Survey, the CalculatedRisk blog on June 12 (in a post titled "NFIB:  Small Business Optimism "Stagnates" in May") had two charts that depicted various facets (the Index itself and Hiring Plans) of the Survey, as shown below:

(click on charts to enlarge images)

-

_____

The Special Note summarizes my overall thoughts about our economic situation

SPX at 1314.88 as this post is written

Tuesday, June 12, 2012

June 2012 Duke/CFO Magazine Global Business Outlook Survey – Notable Excerpts


On June 6 the June Duke/CFO Magazine Global Business Outlook Survey (pdf) was released.  It contains a variety of statistics regarding how CFOs view business and economic conditions.

In this CFO Survey, I found the following to be notable excerpts:
U.S. finance chiefs plan to expand workforce by 2.5 percent, on average over the next year. Nearly 30 percent of U.S. firms say their employees are “maxed out” -- working at full capacity -- and 60 percent are looking to hire.
also:
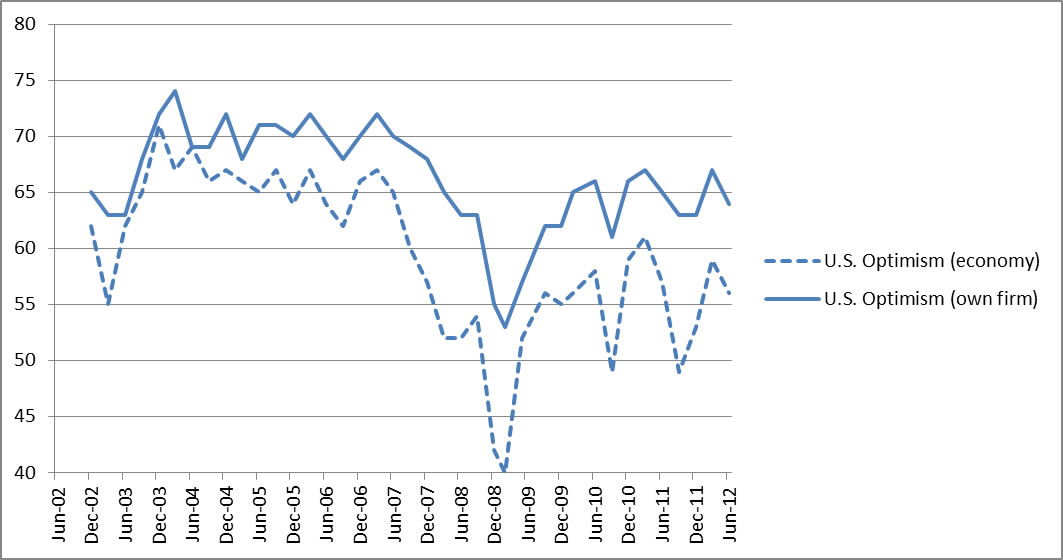
Despite the expected strong job growth, CFO optimism in the U.S. dropped from 59 last quarter to 56 this quarter. Asian optimism, which has traditionally been higher than that in the U.S., fell to 58 from last quarter’s 65, marking the first time in the survey’s history that
U.S. and Asian optimism are nearly the same. European optimism fell to 52 from last quarter’s 54.
also:
U.S. earnings are expected to increase 11 percent, tech spending 8 percent, and capital spending 5 percent.
also:
The Federal Reserve’s fiscal moves appear to have little impact on corporate investment.  “CFOs are telling us that they are building in large contingencies before going ahead with investments,” said Campbell Harvey, a Fuqua finance professor and founding director of the
survey.  “The size of this buffer exceeds 4 percent per year.
The CFO survey contains the Optimism Index chart, showing U.S. Optimism (with regard to the economy) at 56, as seen below:


-

It should be interesting to see how well the CFOs predict business and economic conditions going forward.   I discussed various aspects of this, and the importance of these predictions, in the July 9 2010 post titled “The Business Environment”.

(past posts on CEO and CFO Surveys can be found under the “CFO and CEO Confidence” tag)
_____

I post various economic forecasts because I believe they should be carefully monitored.  However, as those familiar with this blog are aware, I do not necessarily agree with many of the consensus estimates and much of the commentary in these forecast surveys.
_____

The Special Note summarizes my overall thoughts about our economic situation

SPX at 1324.18 as this post is written

Family Finances - Report Covering 2007-2010


Yesterday, the Federal Reserve released a report titled "Changes in U.S. Family Finances from 2007 to 2010:  Evidence from the Survey of Consumer Finances." (pdf)  This report is issued every three years.

The report is 80 pages long.  However, some of the summary statistics have been widely reported, such as in today's Wall Street Journal article titled "Families' Net Worth Drops to '90s Level"  and the New York Times article of yesterday titled "Family Net Worth Drops to Level of Early 90's, Fed Says."

A couple of notable excerpts from the New York Times article:
A hypothetical family richer than half the nation’s families and poorer than the other half had a net worth of $77,300 in 2010, compared with $126,400 in 2007, the Fed said. The crash of housing prices directly accounted for three-quarters of the loss.
also:
Families’ income also continued to decline, a trend that predated the crisis but accelerated over the same period. Median family income fell to $45,800 in 2010 from $49,600 in 2007. All figures were adjusted for inflation.
_____

The Special Note summarizes my overall thoughts about our economic situation

SPX at 1319.04 as this post is written

Monday, June 11, 2012

misc. note - corrections of blog posts

In the July 2, 2010 post I explained my policy with regard to changing the content of posts after the day the posts have been published on the blog.

S&P500 Price Projections – Livingston Survey June 2012


The June 7, 2012  Livingston Survey (pdf) contains, among its various forecasts, a S&P500 forecast.  It shows the following price forecast for the dates shown:

June 29, 2012   1325.4
Dec. 31, 2012    1393
June 28, 2013   1449.2
Dec. 31, 2013    1490.3

These figures represent the median value across the 32 forecasters on the survey’s panel.
_____

I post various economic forecasts because I believe they should be carefully monitored.  However, as those familiar with this blog are aware, I do not agree with many of the consensus estimates and much of the commentary in these forecast surveys.
_____

The Special Note summarizes my overall thoughts about our economic situation

SPX at 1325.66 as this post is written

Saturday, June 9, 2012

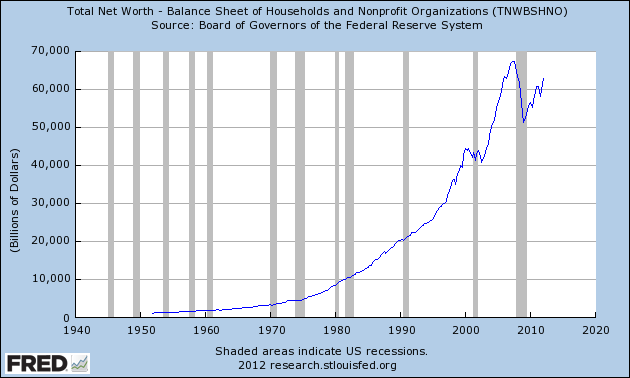
Total Household Net Worth As Of 1Q 2012 – A Long-Term Chart


In the June 8 post ("Total Household Net Worth As A Percent Of GDP 1Q 2012") I displayed a long-term chart depicting Total Household Net Worth as a percentage of GDP.

For reference purposes, here is Total Household Net Worth from a long-term perspective (from 1949:Q4 to 2012:Q1).  The last value (as of June 8, 2012) is $62.86558 Trillion:

(click on each chart to enlarge image)


_____

The Special Note summarizes my overall thoughts about our economic situation


SPX at 1325.66 as this post is written

Long-Term Charts Of The ECRI WLI & ECRI WLI, Gr. – June 8, 2012 Update


As I stated in my July 12, 2010 post (“ECRI WLI Growth History“):
For a variety of reasons, I am not as enamored with ECRI’s WLI and WLI Growth measures as many are.
However, I do think the measures are important and deserve close monitoring and scrutiny.
The movement of the ECRI WLI and WLI, Gr. is particularly notable at this time, as ECRI publicly announced on September 30, 2011 that the U.S. was “tipping into recession,” and ECRI has reaffirmed that view since, including a notable statement on March 15 (“Why Our Recession Call Stands”) as well as various interviews and statements the week of May 6, including:


Wall Street Journal video, May 9: “Free Market Economies Have Business Cycles


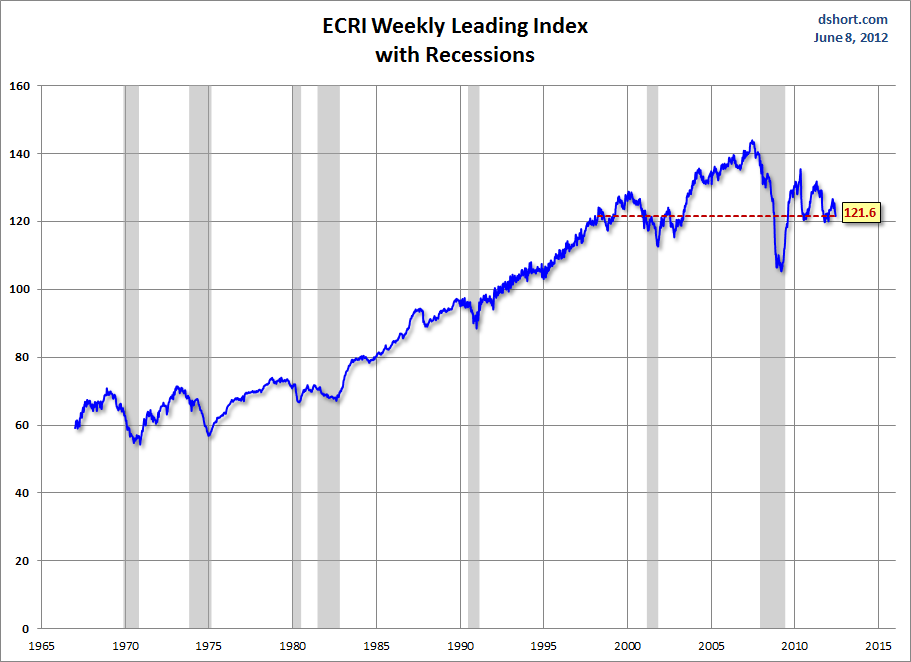
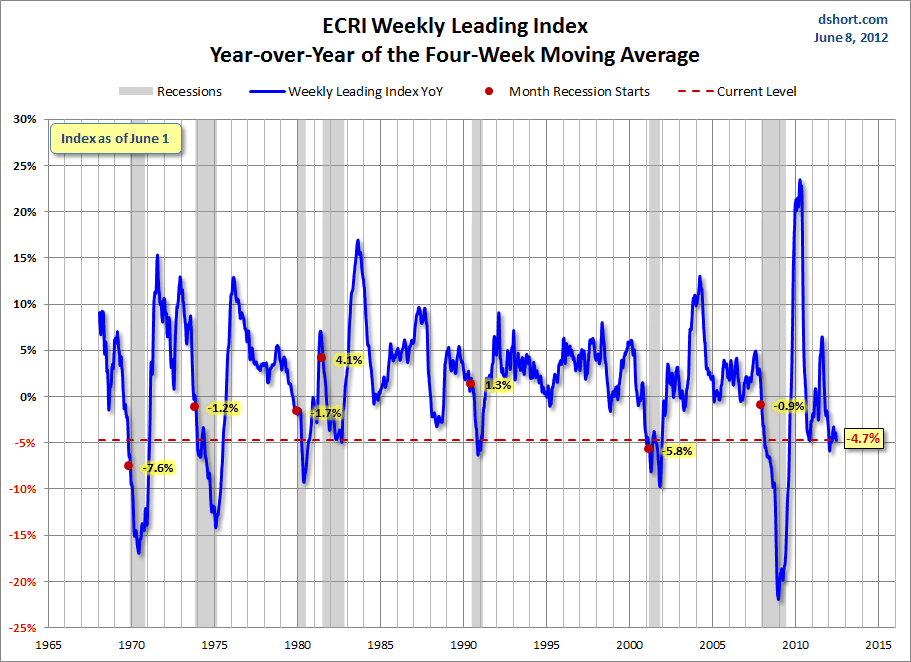
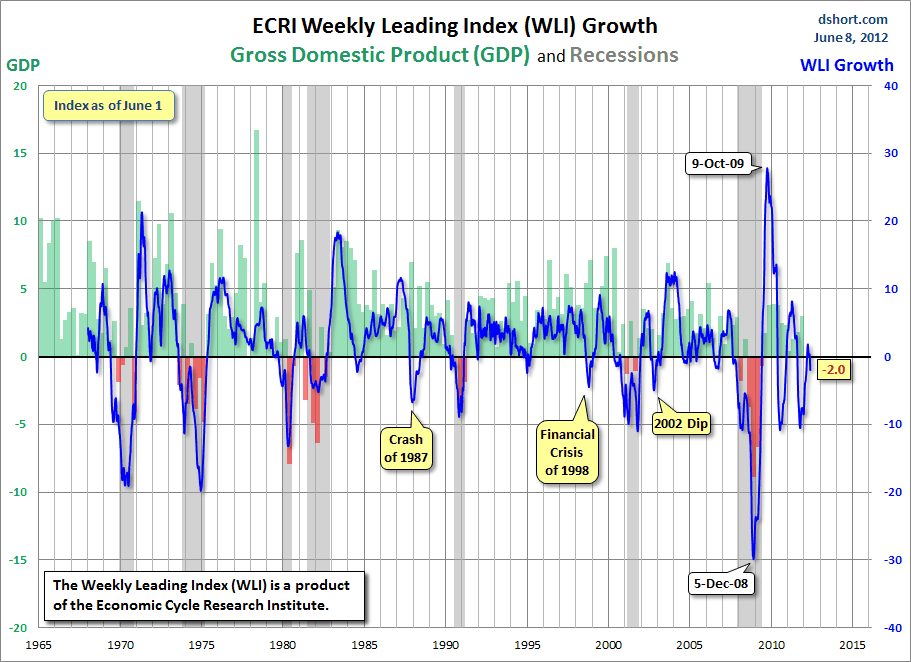
Below are three long-term charts, from Doug Short’s blog post of June 8 titled “ECRI Recession Call Update:  Weekly Leading Index Declines Further.”  These charts are on a weekly basis through the June 8 release, indicating data through June 1.

Here is the ECRI WLI (defined at ECRI’s glossary):

(click on charts to enlarge images)


-

This next chart depicts, on a long-term basis, the Year-over-Year change in the 4-week moving average of the WLI:


-

This last chart depicts, on a long-term basis, the WLI, Gr.:


_________

I post various economic indicators and indices because I believe they should be carefully monitored.  However, as those familiar with this blog are aware, I do not necessarily agree with what they depict or imply.
_____

The Special Note summarizes my overall thoughts about our economic situation

SPX at 1325.66 as this post is written

Friday, June 8, 2012

St. Louis Financial Stress Index – June 7, 2012 Update


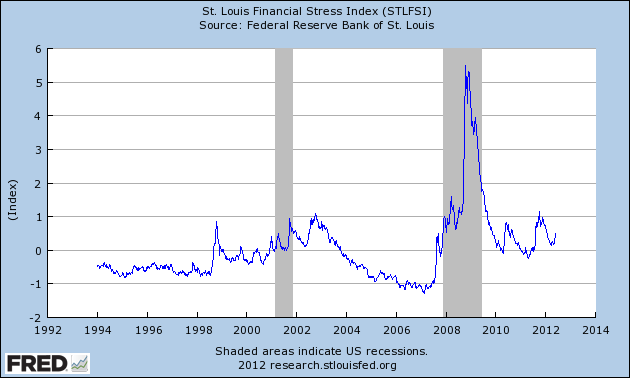
On March 28, 2011 I wrote a post ("The STLFSI") about the  STLFSI (St. Louis Fed’s Financial Stress Index) which is supposed to measure stress in the financial system.  For reference purposes, the most recent chart is seen below.  This chart was last updated on June 7, incorporating data from December 31,1993 to June 1, 2012 on a weekly basis.  The June 1, 2012 value is .488 :


_________

I post various indicators and indices because I believe they should be carefully monitored.  However, as those familiar with this blog are aware, I do not necessarily agree with what they depict or imply.
_____

The Special Note summarizes my overall thoughts about our economic situation

SPX at 1314.99 as this post is written