As many are aware, Thomson Reuters publishes earnings estimates for the S&P500. (My other posts concerning S&P earnings estimates can be found under the S&P500 Earnings label)
The following estimates are from Exhibit 24 of the “S&P500 Earnings Scorecard” (pdf) of December 17, 2018, and represent an aggregation of individual S&P500 component “bottom up” analyst forecasts. For reference, the Year 2014 value is $118.78/share, the Year 2015 value is $117.46, the Year 2016 value is $118.10/share, and the Year 2017 value is $132.00/share:
Year 2018 estimate:
$162.65/share
Year 2019 estimate:
$175.51/share
Year 2020 estimate:
$194.17/share
_____
I post various economic forecasts because I believe they should be carefully monitored. However, as those familiar with this site are aware, I do not agree with many of the consensus estimates and much of the commentary in these forecast surveys.
_____
The Special Note summarizes my overall thoughts about our economic situation
As many are aware, Standard & Poor’s publishes earnings estimates for the S&P500. (My posts concerning their estimates can be found under the S&P500 Earnings label)
For reference purposes, the most current estimates are reflected below, and are as of December 13, 2018:
Year 2018 estimates add to the following:
-From a “bottom up” perspective, operating earnings of $157.29/share
-From a “top down” perspective, operating earnings of N/A
-From a “bottom up” perspective, “as reported” earnings of $140.32/share
Year 2019 estimates add to the following:
-From a “bottom up” perspective, operating earnings of $173.49/share
-From a “top down” perspective, operating earnings of N/A
-From a “bottom up” perspective, “as reported” earnings of $157.47/share
_____
I post various economic forecasts because I believe they should be carefully monitored. However, as those familiar with this site are aware, I do not agree with many of the consensus estimates and much of the commentary in these forecast surveys.
_____
The Special Note summarizes my overall thoughts about our economic situation
In the December 17, 2018 edition of Barron’s, the cover story is titled “2019 Outlook: More Sun, Fewer Clouds.” The subtitle is “U.S. stocks could rally more than 10% in 2019 as the economy grows, earnings rise, and interest rates stay low.”
Included in the story, 10 investment strategists give various forecasts for 2019 including S&P500 profits, S&P500 year-end price targets, GDP growth, and 10-Year Treasury Note Yields.
An excerpt:
Yet as U.S. stocks stumble toward what could be their first yearly loss since 2015, next year is looking rather sunny. So say the 10 market strategists Barron’s consulted this month, all of whom have 2019 targets for the S&P 500 index that are higher than the benchmark’s recent price level of 2600. Based on the group’s mean prediction, the S&P 500 will end next year at 2975, indicating a gain of more than 14%.
The strategists, who mostly hail from investment banks and asset-management firms, offered up individual S&P targets ranging from 2750 to 3100. The stock market is down almost 3% this year, as measured by the S&P 500—a disappointing showing in any year, but especially so after last year’s nearly 20% gain.
To some degree, 2017’s rally discounted this year’s robust profit growth, likely to total over 20%. Could 2018’s downdraft signal next year’s earnings moderation? Our prognosticators expect S&P 500 profits to rise just 5% to 6% in 2019, to $172 per share,partly because companies will be losing the boost from this year’s reduction in federal taxes.
Industry analysts, who typically have loftier forecasts than “top-down” strategists, anticipate per share profit growth of 9% next year.
As seen in the article, the investment strategists expect an average 2019 GDP growth of 2.50%.
_____
I post various economic forecasts because I believe they should be carefully monitored. However, as those familiar with this blog are aware, I do not agree with many of the consensus estimates and much of the commentary in these forecast surveys.
_____
The Special Note summarizes my overall thoughts about our economic situation
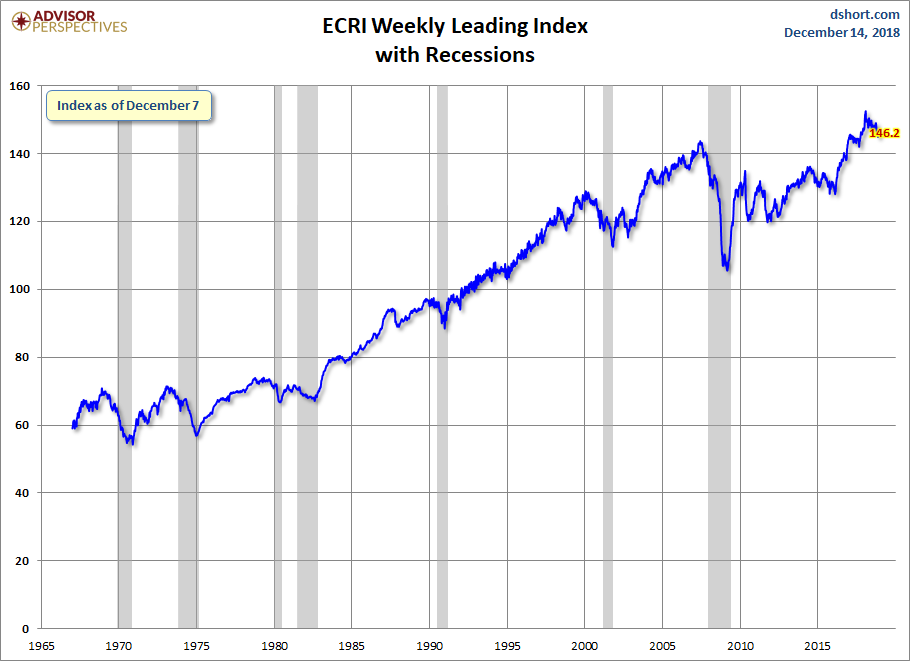
This next chart depicts, on a long-term basis, the Year-over-Year change in the 4-week moving average of the WLI:
–
This last chart depicts, on a long-term basis, the WLI, Gr.:
_________
I post various economic indicators and indices because I believe they should be carefully monitored. However, as those familiar with this site are aware, I do not necessarily agree with what they depict or imply.
_____
The Special Note summarizes my overall thoughts about our economic situation
Throughout this site there are many discussions of economic indicators. At this time, the readings of various indicators are especially notable. This post is the latest in a series of posts indicating U.S. economic weakness or a notably low growth rate.
While many U.S. economic indicators – including GDP – are indicating economic growth, others depict (or imply) various degrees of weak growth or economic contraction. As seen in the December 2018 Wall Street Journal Economic Forecast Survey the consensus (average estimate) among various economists is for 3.1% GDP growth in 2018 and 2.3% GDP growth in 2019. However, there are other broad-based economic indicators that seem to imply a weaker growth rate.
As well, it should be remembered that GDP figures can be (substantially) revised.
Charts Indicating U.S. Economic Weakness
Below are a small sampling of charts that depict weak growth or contraction, and a brief comment for each:
Total Federal Receipts
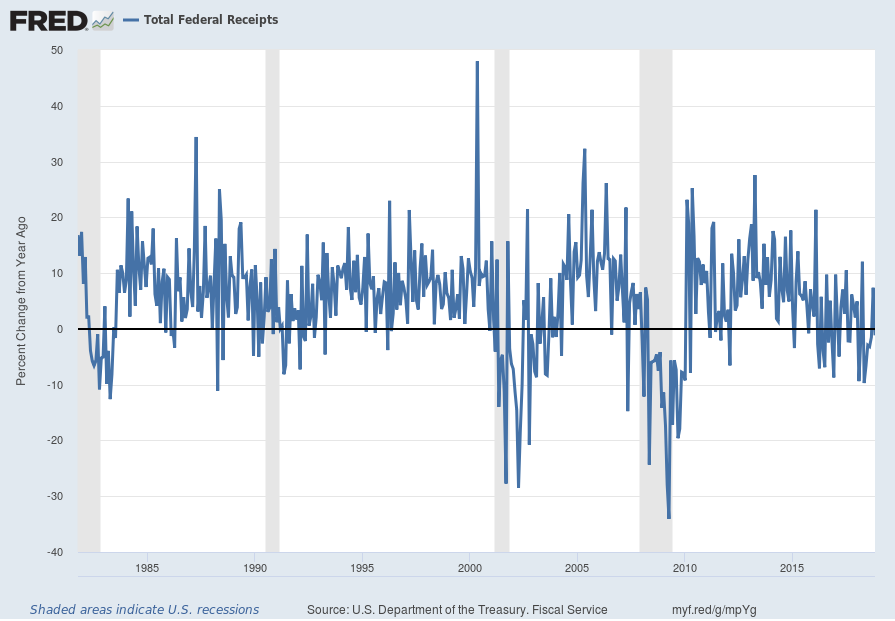
“Total Federal Receipts” growth continues to be intermittent in nature since 2015. As well, the level of growth does not seem congruent to the (recent) levels of economic growth as seen in aggregate measures such as Real GDP.
“Total Federal Receipts” through November had a last value of $205,961 Million. Shown below is the measure displayed on a “Percent Change From Year Ago” basis with value -1.5%, last updated December 13, 2018:
source: U.S. Department of the Treasury. Fiscal Service, Total Federal Receipts [MTSR133FMS], retrieved from FRED, Federal Reserve Bank of St. Louis, accessed December 13, 2018: https://fred.stlouisfed.org/series/MTSR133FMS
__
The Aruoba-Diebold-Scotti Business Conditions Index (ADS Index)
While the 3rd quarter GDP (Second Estimate)(pdf) was 3.5%, there are other broad-based economic indicators that seem to imply a weaker growth rate.
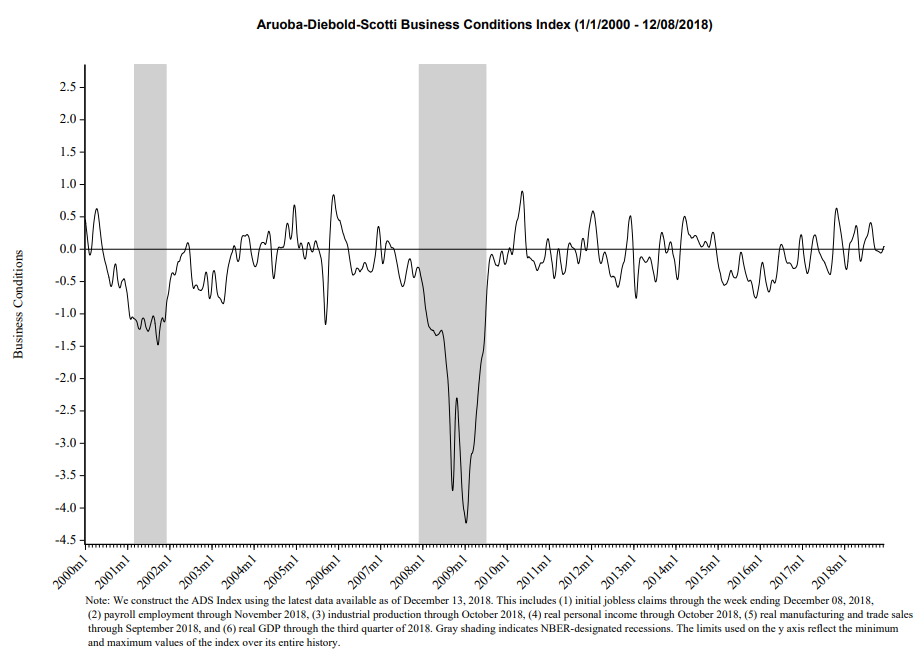
Among the broad-based economic indicators that seem to imply subdued or intermittent growth is that of the Aruoba-Diebold-Scotti Business Conditions Index (ADS Index.) Below is a chart of the index from the year 2000 through December 8, 2018, with a value of .0405, as of the December 13 update:
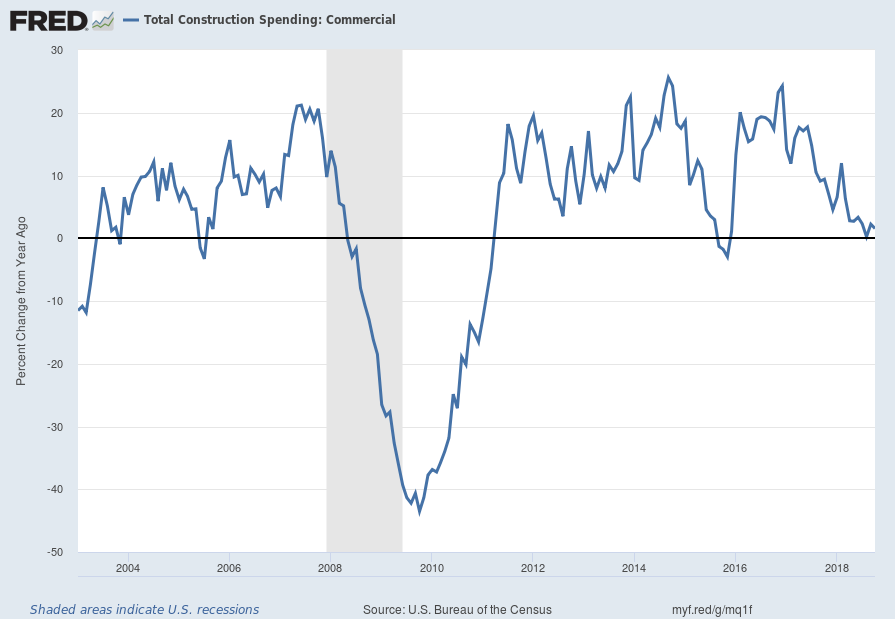
“Total Private Construction Spending: Commercial” is a measure of construction exhibiting weak YoY growth. This measure through October had a last value of $88,686 Million. Shown below is the measure displayed on a “Percent Change From Year Ago” basis with a value of 1.6%, last updated December 3, 2018:
source: U.S. Bureau of the Census, Total Construction Spending: Commercial [TLCOMCONS], retrieved from FRED, Federal Reserve Bank of St. Louis, accessed December 13, 2018: https://fred.stlouisfed.org/series/TLCOMCONS
__
The Yield Curve
Many people believe that the Yield Curve is a leading economic indicator for the United States economy.
While I continue to have the stated reservations regarding the “yield curve” as an indicator, I do believe that it should be monitored.
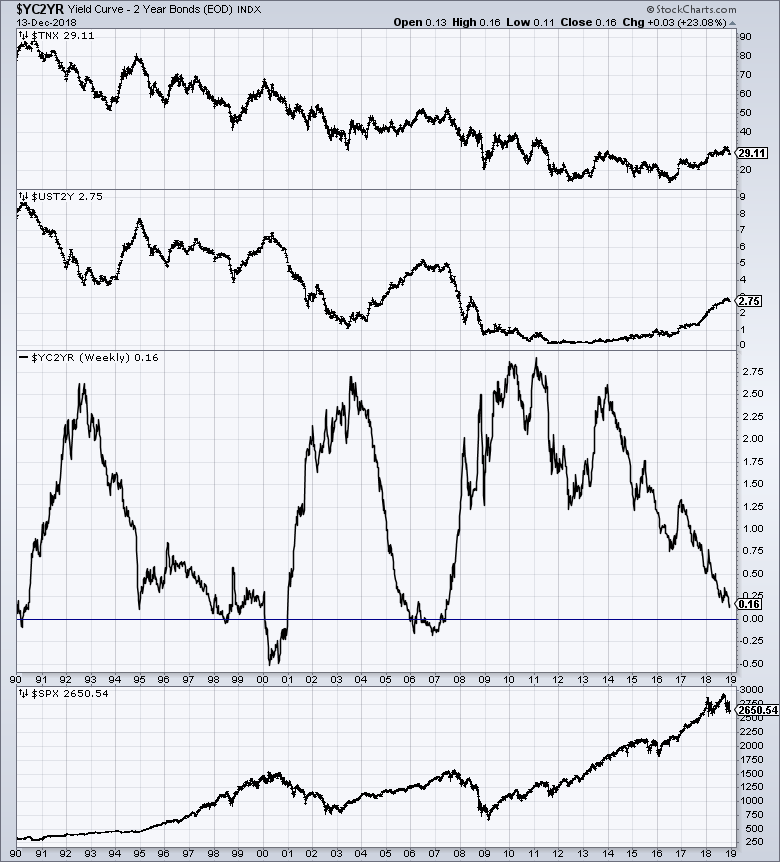
As an indication of the yield curve (i.e. a yield curve proxy), below is a weekly chart from January 1, 1990 through December 13, 2018. The top two plots show the 10-Year Treasury and 2-Year Treasury yields. The third plot shows the (yield) spread between the 10-Year Treasury and 2-Year Treasury, with the December 13, 2018 closing value of .16%. The bottom plot shows the S&P500:
(click on chart to enlarge image)(chart courtesy of StockCharts.com; chart creation and annotation by the author)
__
Loan Demand And Related Measures
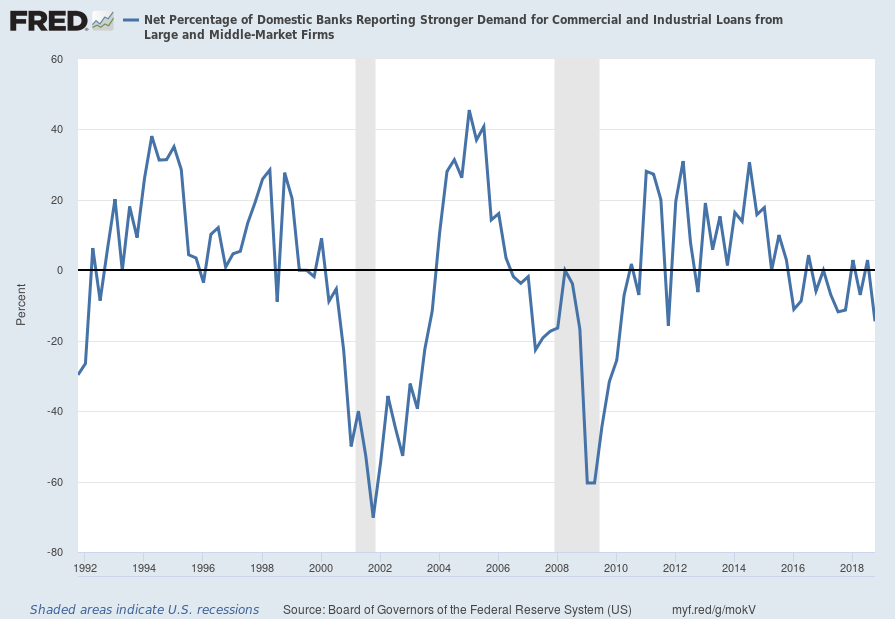
As seen in previous updates, various aspects of lending growth and related measures have shown a marked slowing in the growth rate. Shown below is a measure, Net Percentage of Domestic Banks Reporting Stronger Demand for Commercial and Industrial Loans from Large and Middle-Market Firms, that shows a decline. The current value is -14.5% as of the November 14, 2018 quarterly update:
source: Board of Governors of the Federal Reserve System (US), Net Percentage of Domestic Banks Reporting Stronger Demand for Commercial and Industrial Loans from Large and Middle-Market Firms [DRSDCILM], retrieved from FRED, Federal Reserve Bank of St. Louis; accessed December 11, 2018: https://fred.stlouisfed.org/series/DRSDCILM
__
The ECRI WLI (Weekly Leading Index)
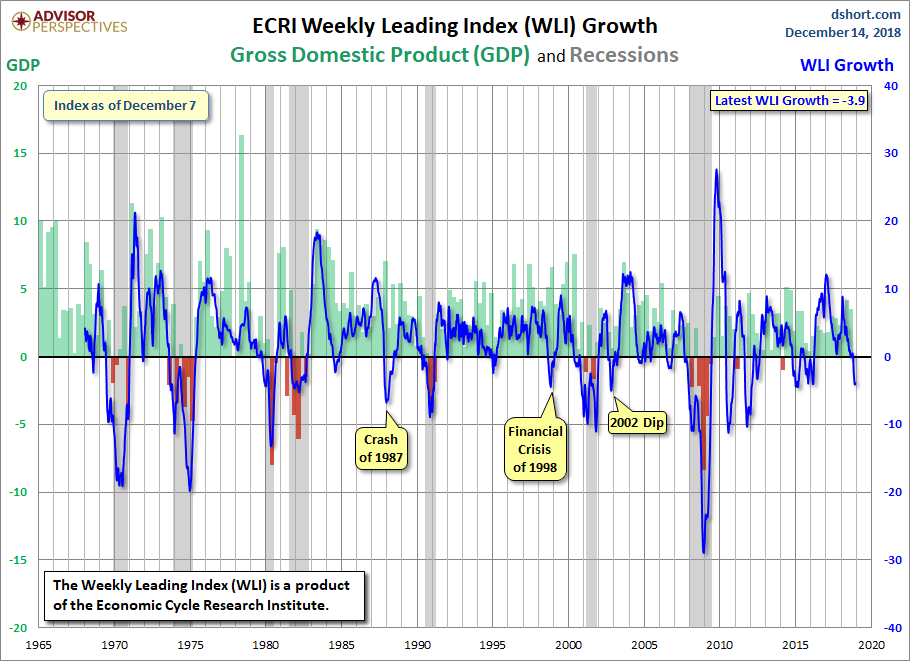
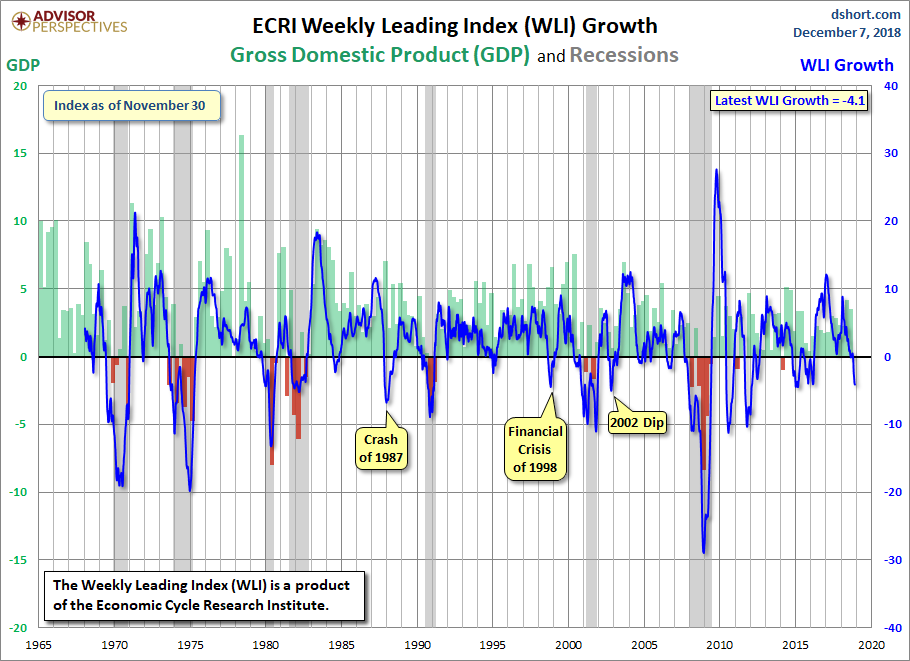
The ECRI WLI,Gr. measure has been declining and now is at -4.1% as of the December 7, 2018 update, reflecting data through November 30, 2018.
A chart of the WLI,Gr., with an overlay of U.S. GDP, from the Doug Short’s site ECRI update post of December 7, 2018:
__
Other Indicators
As mentioned previously, many other indicators discussed on this site indicate weak economic growth or economic contraction, if not outright (gravely) problematical economic conditions.
_____
The Special Note summarizes my overall thoughts about our economic situation
I found numerous items to be notable – although I don’t necessarily agree with them – both within the article and in the “Economist Q&A” section.
Two excerpts:
Nearly half of economists who responded to a survey by The Wall Street Journal, 47.3%, said they viewed the U.S. dispute with Beijing as the No. 1 risk for 2019. Some 20% cited financial market disruptions and 12.7% pointed to a slowdown in business investment.
also:
Just 7.3% of economists, or four respondents in total, agreed that Fed rate increases were the biggest threat to the economy in 2019.
A couple of private-sector economists cited other risks, such as excessive federal spending. Just over 9% pointed to slowing global growth as the biggest threat.
As seen in the “Recession Probability” section, the average response as to the odds of another recession starting within the next 12 months was 22.02%. The individual estimates, of those who responded, ranged from 0% to 50%. For reference, the average response in November’s survey was 19.55%.
As stated in the article, the survey’s respondents were 60 academic, financial and business economists. Not every economist answered every question. The survey was conducted December 7 – December 11, 2018.
–
The current average forecasts among economists polled include the following:
GDP:
full-year 2018: 3.1%
full-year 2019: 2.3%
full-year 2020: 1.7%
full-year 2021: 1.8%
Unemployment Rate:
December 2018: 3.7%
December 2019: 3.6%
December 2020: 3.8%
December 2021: 4.1%
10-Year Treasury Yield:
December 2018: 3.00%
December 2019: 3.35%
December 2020: 3.38%
December 2021: 3.36%
CPI:
December 2018: 2.20%
December 2019: 2.30%
December 2020: 2.10%
December 2021: 2.20%
Crude Oil ($ per bbl):
for 12/31/2018: $54.95
for 12/31/2019: $59.21
for 12/31/2020: $59.43
for 12/31/2021: $60.42
(note: I highlight this WSJ Economic Forecast survey each month; commentary on past surveys can be found under the “Economic Forecasts” label)
_____
I post various economic forecasts because I believe they should be carefully monitored. However, as those familiar with this site are aware, I do not necessarily agree with many of the consensus estimates and much of the commentary in these forecast surveys.
_____
The Special Note summarizes my overall thoughts about our economic situation
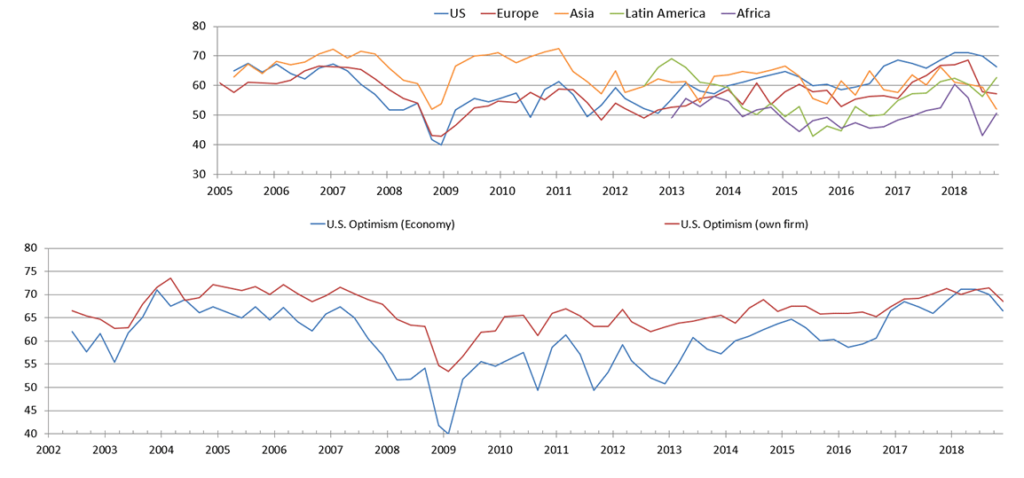
In this CFO survey press release, I found the following to be the most notable excerpts – although I don’t necessarily agree with them:
Nearly half (48.6 percent) of U.S. CFOs believe that the nation’s economy will be in recession by the end of 2019, and 82 percent believe that a recession will have begun by the end of 2020.
also:
In 2019, CFOs expect sub-3% growth for the U.S. economy, with accompanying capital spending and employment growth of about 3 percent.
also:
Moreover, their forecasts are skewed to the downside, with a one-in-ten chance that annual real growth will be a meager 0.6 percent. In this worst-case scenario, CFOs would expect their capital spending to fall by 1.3 percent and for hiring to remain flat.
The CFO survey contains two Optimism Index charts, with the bottom chart showing U.S. Optimism (with regard to the economy) at 66, as seen below:
—
It should be interesting to see how well the CFOs predict business and economic conditions going forward. I discussed past various aspects of this, and the importance of these predictions, in the July 9, 2010 post titled “The Business Environment”.
(past posts on CEO and CFO surveys can be found under the “CFO and CEO Confidence” label)
_____
I post various economic forecasts because I believe they should be carefully monitored. However, as those familiar with this site are aware, I do not necessarily agree with many of the consensus estimates and much of the commentary in these forecast surveys.
_____
The Special Note summarizes my overall thoughts about our economic situation
The St. Louis Fed’s Financial Stress Index (STLFSI) is one index that is supposed to measure stress in the financial system. Its reading as of the December 6, 2018 update (reflecting data through November 30, 2018) is -.889.
Of course, there are a variety of other measures and indices that are supposed to measure financial stress and other related issues, both from the Federal Reserve as well as from private sources.
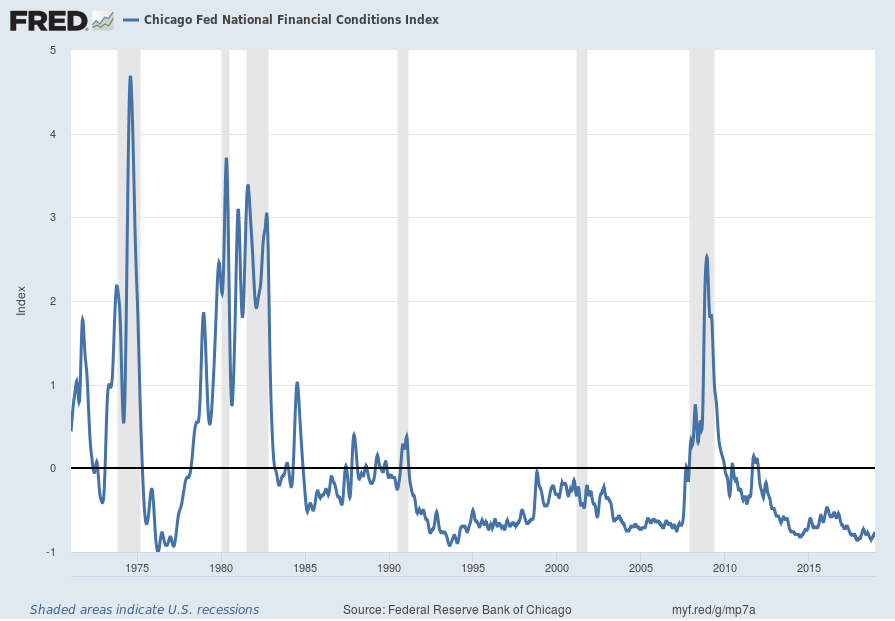
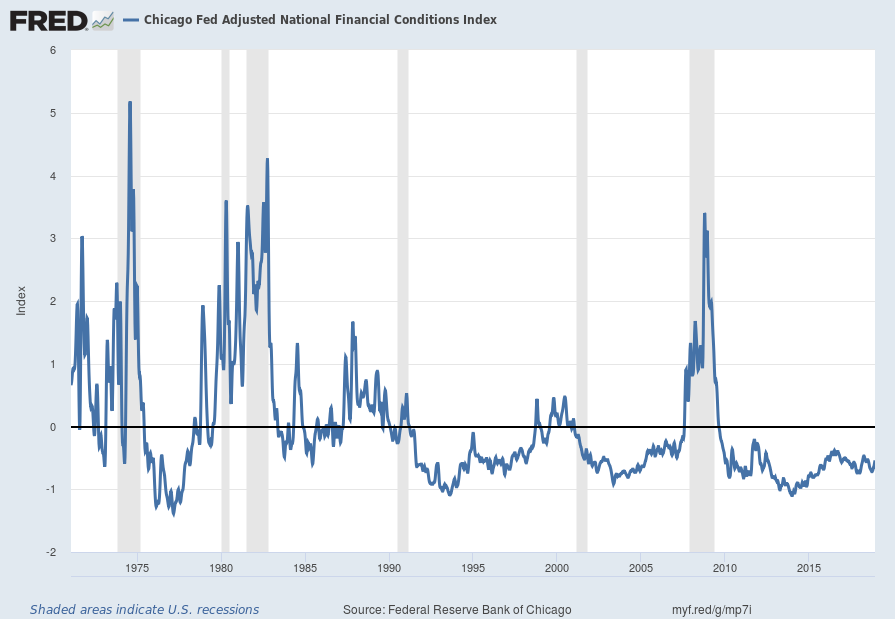
Two other indices that I regularly monitor include the Chicago Fed National Financial Conditions Index (NFCI) as well as the Chicago Fed Adjusted National Financial Conditions Index (ANFCI).
Here are summary descriptions of each, as seen in FRED:
The National Financial Conditions Index (NFCI) measures risk, liquidity and leverage in money markets and debt and equity markets as well as in the traditional and “shadow” banking systems. Positive values of the NFCI indicate financial conditions that are tighter than average, while negative values indicate financial conditions that are looser than average.
The adjusted NFCI (ANFCI). This index isolates a component of financial conditions uncorrelated with economic conditions to provide an update on how financial conditions compare with current economic conditions.
For further information, please visit the Federal Reserve Bank of Chicago’s web site:
Below are the most recently updated charts of the NFCI and ANFCI, respectively.
The NFCI chart below was last updated on December 12, 2018 incorporating data from January 8, 1971 through December 7, 2018, on a weekly basis. The December 7 value is -.76:
The ANFCI chart below was last updated on December 12, 2018 incorporating data from January 8, 1971 through December 7, 2018, on a weekly basis. The December 7 value is -.54:
I post various indicators and indices because I believe they should be carefully monitored. However, as those familiar with this site are aware, I do not necessarily agree with what they depict or imply.
_____
The Special Note summarizes my overall thoughts about our economic situation