As many are aware, Refinitiv publishes earnings estimates for the S&P500. (My other posts concerning S&P earnings estimates can be found under the S&P500 Earnings label)
The following estimates are from Exhibit 24 of the “S&P500 Earnings Scorecard” (pdf) of February 12, 2021, and represent an aggregation of individual S&P500 component “bottom up” analyst forecasts. For reference, the Year 2014 value is $118.78/share; the Year 2015 value is $117.46/share; the Year 2016 value is $118.10/share; the Year 2017 value is $132.00/share; the Year 2018 value is $161.93/share; and the Year 2019 value is $162.93/share:
Year 2020 estimate:
$140.62/share
Year 2021 estimate:
$173.70/share
Year 2022 estimate:
$200.41/share
_____
I post various economic forecasts because I believe they should be carefully monitored. However, as those familiar with this site are aware, I do not agree with many of the consensus estimates and much of the commentary in these forecast surveys.
_____
The Special Note summarizes my overall thoughts about our economic situation
As many are aware, Standard & Poor’s publishes earnings estimates for the S&P500. (My posts concerning their estimates can be found under the S&P500 Earnings label)
For reference purposes, the most current estimates are reflected below, and are as of February 11, 2021:
Year 2020 estimates add to the following:
-From a “bottom up” perspective, operating earnings of $118.77/share
-From a “top down” perspective, operating earnings of N/A
-From a “bottom up” perspective, “as reported” earnings of $91.38/share
Year 2021 estimates add to the following:
-From a “bottom up” perspective, operating earnings of $170.76/share
-From a “top down” perspective, operating earnings of N/A
-From a “bottom up” perspective, “as reported” earnings of $153.86/share
_____
I post various economic forecasts because I believe they should be carefully monitored. However, as those familiar with this site are aware, I do not agree with many of the consensus estimates and much of the commentary in these forecast surveys.
_____
The Special Note summarizes my overall thoughts about our economic situation
The survey shows, among many measures, the following median expectations:
Real GDP: (annual average level)
full-year 2021: 4.5%
full-year 2022: 3.7%
full-year 2023: 3.1%
full-year 2024: 2.5%
Unemployment Rate: (annual average level)
for 2021: 5.9%
for 2022: 4.8%
for 2023: 4.2%
for 2024: 4.0%
–
Regarding the risk of a negative quarter in real GDP in any of the next few quarters, mean estimates are 19.1%, 12.7%, 12.3%, 12.9%, and 14.1% for each of the quarters from Q1 2021 through Q1 2022, respectively.
As well, there are also a variety of time frames shown (present quarter through the year 2030) with the median expected inflation (annualized) of each. Inflation is measured in Headline and Core CPI and Headline and Core PCE. Over all time frames expectations are shown to be in the 1.8% to 2.5% range.
_____
I post various economic forecasts because I believe they should be carefully monitored. However, as those familiar with this site are aware, I do not agree with many of the consensus estimates and much of the commentary in these forecast surveys.
_____
The Special Note summarizes my overall thoughts about our economic situation
I found numerous items to be notable – although I don’t necessarily agree with them – both within the article and in the “Economist Q&A” section.
Two excerpts:
Economists on average expected gross domestic product to expand nearly 4.9% this year, measured from the fourth quarter of the prior year, according to the business and academic economists surveyed in February, an improvement from their 4.3% forecast in January. They cited the distribution of Covid-19 vaccinations and the prospect of additional fiscal relief from Washington for the brightening outlook.
also:
“The economy is already picking up some growth momentum in the first quarter,” said Brian Bethune, professor of economics at Boston College. “The large $1.9 trillion stimulus package will provide significant insurance against a relapse into recession,” he said, referring to President Biden’s proposal.
More than half of the respondents said the amount of fiscal aid the economy needs to recover from the coronavirus shock was less than $1 trillion, while only one said that more than $2 trillion was required.
As seen in the “Recession Probability” section, the average response as to whether the economy will be in a recession within the next 12 months was 17.51%. The individual estimates, of those who responded, ranged from 0% to 79%. For reference, the average response in January’s survey was 21.2%.
As stated in the article, the survey’s 62 respondents were academic, financial and business economists. The survey was conducted February 5 – February 9. Not every economist answered every question.
–
Economic Forecasts
The current average forecasts among economists polled include the following:
GDP:
full-year 2021: 4.87%
full-year 2022: 3.07%
full-year 2023: 2.46%
Unemployment Rate:
December 2021: 5.28%
December 2022: 4.46%
December 2023: 4.10%
10-Year Treasury Yield:
December 2021: 1.48%
December 2022: 1.85%
December 2023: 2.18%
CPI:
December 2021: 2.27%
December 2022: 2.22%
December 2023: 2.21%
Crude Oil ($ per bbl):
for 12/31/2021: $56.39
for 12/31/2022: $58.32
for 12/31/2023: $58.95
(note: I highlight this WSJ Economic Forecast survey each month; commentary on past surveys can be found under the “Economic Forecasts” label)
_____
I post various economic forecasts because I believe they should be carefully monitored. However, as those familiar with this site are aware, I do not necessarily agree with many of the consensus estimates and much of the commentary in these forecast surveys.
_____
The Special Note summarizes my overall thoughts about our economic situation
Throughout this site there are many discussions of economic indicators. This post is the latest in a series of posts indicating U.S. economic weakness or a notably low growth rate.
The level and trend of economic growth is especially notable at this time. As seen in various measures and near-term projections, the U.S. economy has undergone an outsized level of economic contraction. However, most people believe (and virtually all prominent economic forecasts indicate) that this historic level of contraction will be temporary in nature and that a sustainable economic rebound will have started in the third quarter of 2020.
Below are a small sampling of charts that depict weak growth or contraction, and a brief comment for each:
The Weekly Economic Index (WEI)
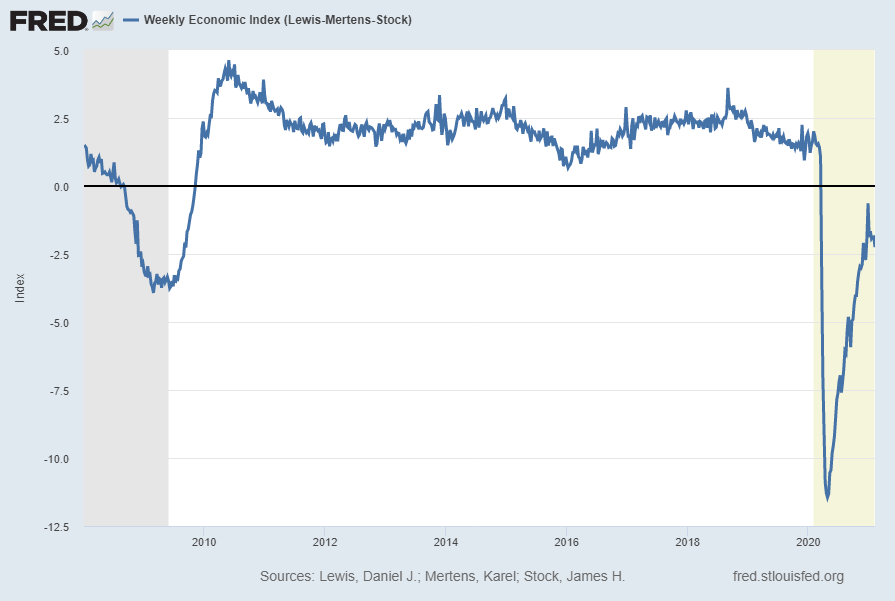
A recently-introduced indicator, the Weekly Economic Index, is an economic indicator that is a composite of 10 different weekly indicators. It is (purportedly) designed to provide a timely depiction of the U.S. economic trend. As seen below, it depicts the severity of the recent plunge in economic activity and subsequent (partial) rebound.
The Weekly Economic Index (WEI) with a value of -2.25, updated as of February 11, 2021 (incorporating data through February 6, 2021):
source: Lewis, Daniel J., Mertens, Karel and Stock, James H., Weekly Economic Index (Lewis-Mertens-Stock) [WEI], retrieved from FRED, Federal Reserve Bank of St. Louis; accessed February 11, 2021: https://fred.stlouisfed.org/series/WEI
__
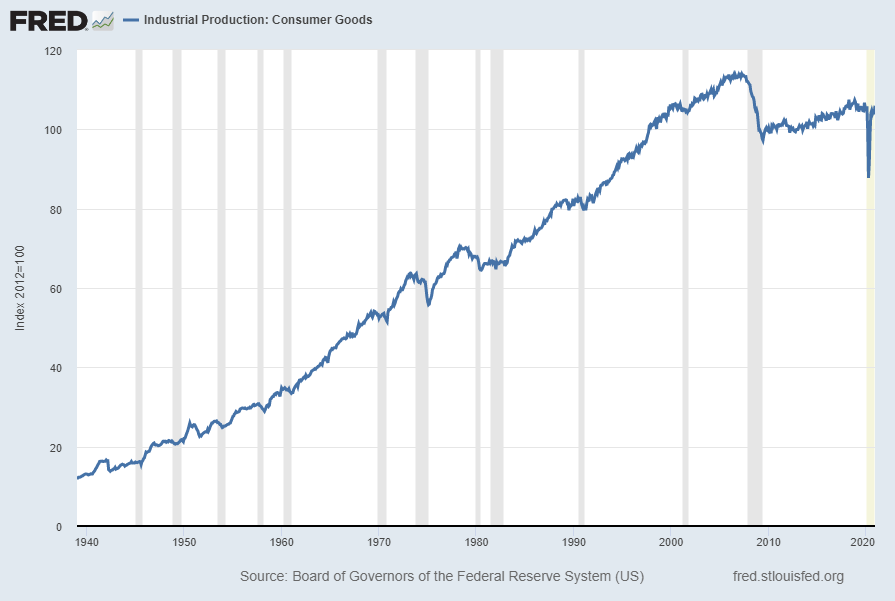
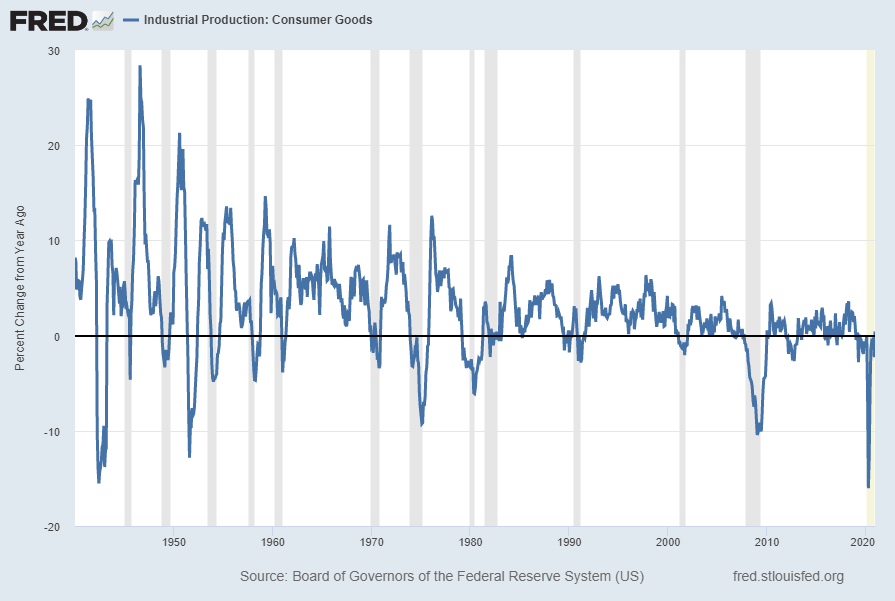
Industrial Production: Consumer Goods (IPCONGD)
The “Industrial Production: Consumer Goods” measure is another measure exhibiting an outsized contraction followed by a (partial) rebound. Shown below is a long-term chart of this measure (displayed from 1939), with last value of 105.9516 through December 2020, last updated January 15, 2021:
Displayed below is this same IPCONGD measure on a “Percent Change From Year Ago” basis with value .4%:
source: Board of Governors of the Federal Reserve System (US), Industrial Production: Consumer Goods [IPCONGD], retrieved from FRED, Federal Reserve Bank of St. Louis; accessed February 11, 2021: https://fred.stlouisfed.org/series/IPCONGD
__
Value of Manufacturers’ New Orders for Consumer Goods Industries (ACOGNO)
Another measure for consumer goods exhibiting a recent outsized weakening followed by a partial rebound is the “Value of Manufacturers’ New Orders for Consumer Goods Industries” (ACOGNO). Shown below is this measure with last value of $209,545 Million through December 2020 (last updated February 4, 2021):
Displayed below is this same ACOGNO measure on a “Percent Change From Year Ago” basis with value -1.9%, last updated February 4, 2021:
source: U.S. Census Bureau, Value of Manufacturers’ New Orders for Consumer Goods Industries [ACOGNO], retrieved from FRED, Federal Reserve Bank of St. Louis; accessed February 10, 2021: https://fred.stlouisfed.org/series/ACOGNO
__
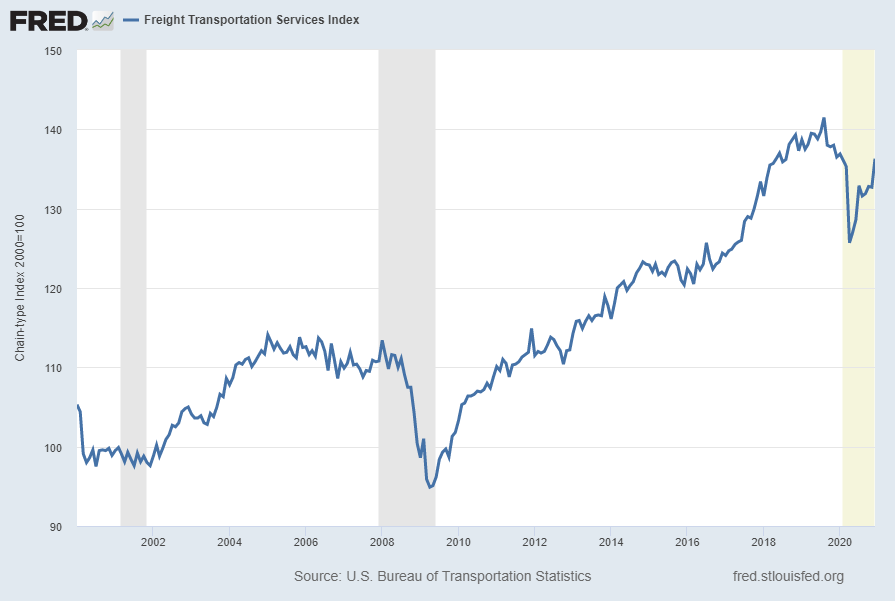
Freight Transportation Services Index (TSIFRGHT)
“Freight Transportation Services Index” (TSIFRGHT), like other transportation measures, is exhibiting recent substantial weakness. Shown below is this measure with last value of 136.3 through December, last updated February 10, 2021:
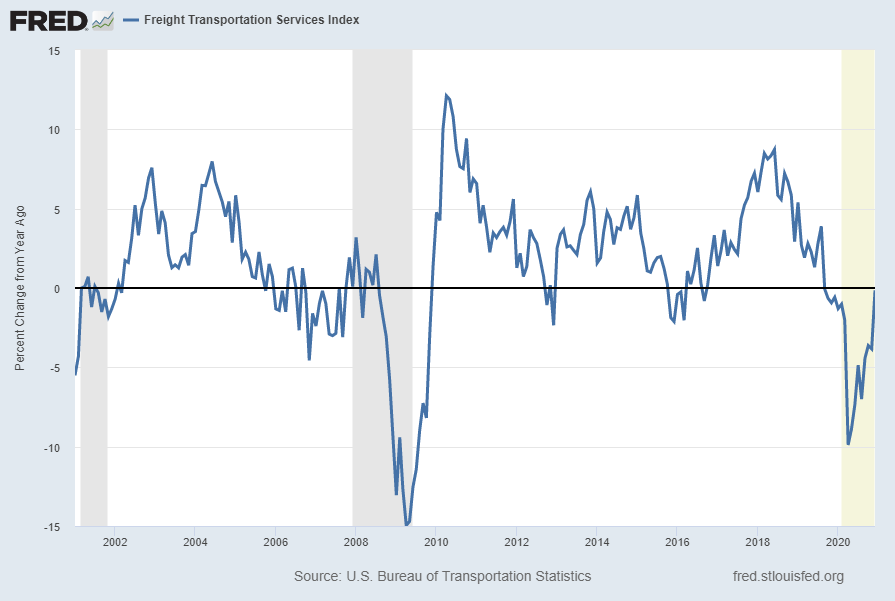
Below is this measure displayed on a “Percent Change From Year Ago” basis with value -.1%:
source: U.S. Bureau of Transportation Statistics, Freight Transportation Services Index [TSIFRGHT], retrieved from FRED, Federal Reserve Bank of St. Louis; accessed February 11, 2021; https://fred.stlouisfed.org/series/TSIFRGHT
__
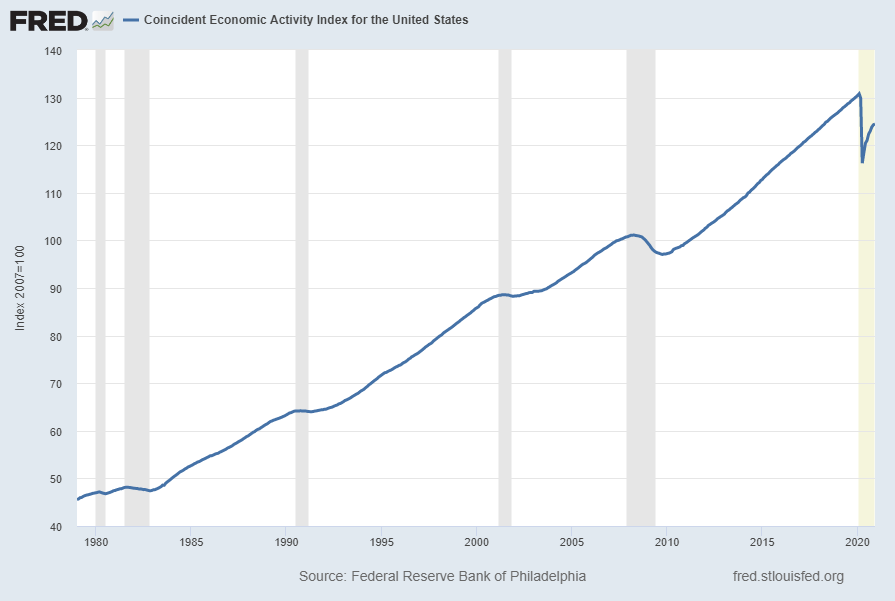
Coincident Economic Activity Index for the United States (USPHCI)
The Coincident Economic Activity Index for the United States (USPHCI) is described in FRED as the following:
The Coincident Economic Activity Index includes four indicators: nonfarm payroll employment, the unemployment rate, average hours worked in manufacturing and wages and salaries. The trend for each state’s index is set to match the trend for gross state product.
As seen in the long-term chart below, like many U.S. economic indicators the index appears to be attempting a rebound from the recent 2020 decline.
Shown below is a chart with data through December 2020 (last value of 124.44), last updated January 29, 2021:
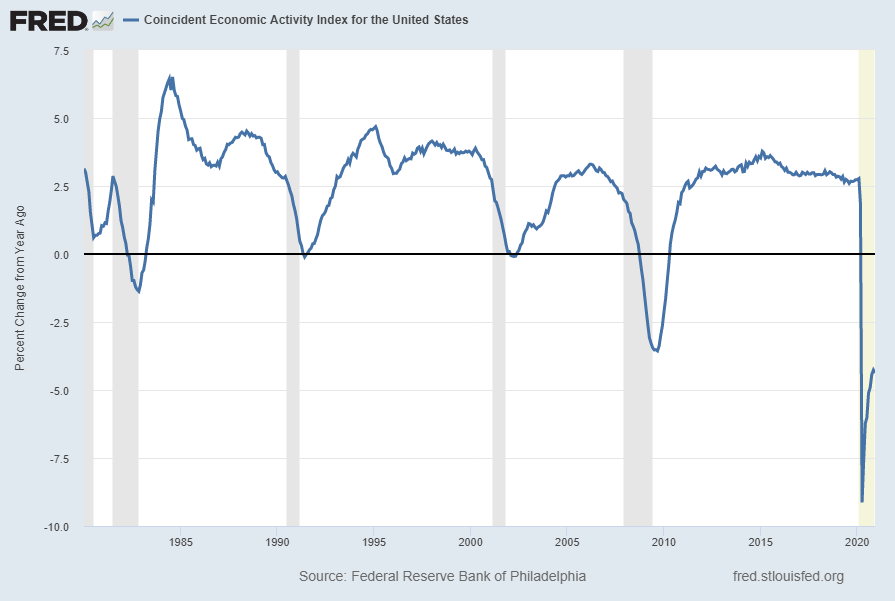
Below is this measure displayed on a “Percent Change From Year Ago” basis with value -4.4%:
source: Federal Reserve Bank of Philadelphia, Coincident Economic Activity Index for the United States [USPHCI], retrieved from FRED, Federal Reserve Bank of St. Louis; accessed February 10, 2021: https://fred.stlouisfed.org/series/USPHCI
__
Other Indicators
As mentioned previously, many other indicators discussed on this site indicate slow economic growth or economic contraction, if not outright (gravely) problematical economic conditions.
_____
The Special Note summarizes my overall thoughts about our economic situation
Although there was an official declaration of U.S. recession on June 8, 2020 (as discussed in the “Recession Declared For The United States By The NBER BCDC” post), the following discussion is warranted for many reasons. Among the reasons is that two of the measures mentioned below are “forward-looking” in nature.
There are a variety of economic models that are supposed to predict the probabilities of recession.
While I don’t agree with the methodologies employed or probabilities of impending economic weakness as depicted by the following two models, I think the results of these models should be monitored.
Please note that each of these models is updated regularly, and the results of these – as well as other recession models – can fluctuate significantly.
Currently (last updated February 4, 2021 using data through January 2021) this “Yield Curve” model shows a 12.1891% probability of a recession in the United States twelve months ahead. For comparison purposes, it showed a 14.3616% probability through December 2020, and a chart going back to 1960 is seen at the “Probability Of U.S. Recession Predicted by Treasury Spread.” (pdf)
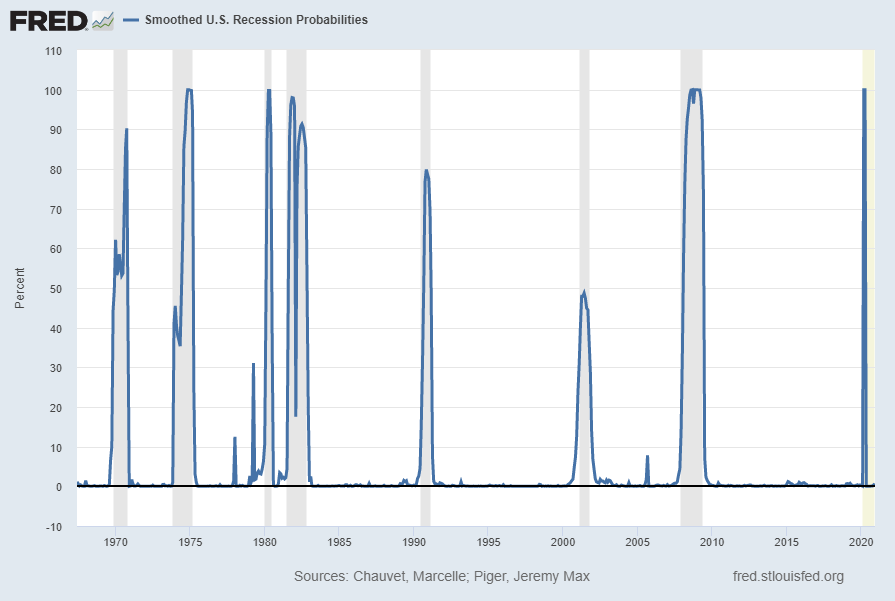
Smoothed recession probabilities for the United States are obtained from a dynamic-factor markov-switching model applied to four monthly coincident variables: non-farm payroll employment, the index of industrial production, real personal income excluding transfer payments, and real manufacturing and trade sales. This model was originally developed in Chauvet, M., “An Economic Characterization of Business Cycle Dynamics with Factor Structure and Regime Switching,” International Economic Review, 1998, 39, 969-996. (http://faculty.ucr.edu/~chauvet/ier.pdf)
This model, last updated on February 1, 2021 currently shows a .28% probability using data through December 2020.
Here is the FRED chart (last updated February 1, 2021):
Data Source: Piger, Jeremy Max and Chauvet, Marcelle, Smoothed U.S. Recession Probabilities [RECPROUSM156N], retrieved from FRED, Federal Reserve Bank of St. Louis, accessed February 8, 2021: http://research.stlouisfed.org/fred2/series/RECPROUSM156N
–
The two models featured above can be compared against measures seen in recent posts. For instance, as seen in the January 14, 2021 post titled “The January 2021 Wall Street Journal Economic Forecast Survey“ economists surveyed averaged a 21.2% probability of a U.S. recession within the next 12 months.
_____
The Special Note summarizes my overall thoughts about our economic situation
My overall analysis indicates a continuing elevated and growing level of financial danger which contains many worldwide and U.S.-specific “stresses” of a very complex nature. I have written numerous posts on this site concerning both ongoing and recent “negative developments.” These developments, as well as other exceedingly problematical conditions, have presented a highly perilous economic environment that endangers the overall financial system.
Also of ongoing immense importance is the existence of various immensely large asset bubbles, a subject of which I have extensively written. While all of these asset bubbles are wildly pernicious and will have profound adverse future implications, hazards presented by the bond market bubble are especially notable.
Predicting the specific timing and extent of a stock market crash is always difficult, and the immense complexity of today’s economic situation makes such a prediction even more challenging. With that being said, my analyses continue to indicate that a near-term exceedingly large (from an ultra long-term perspective) stock market crash – that would also involve (as seen in 2008) various other markets – will occur. [note: the “next crash” and its aftermath has paramount significance and implications, as discussed in the post of January 6, 2012 titled “The Next Crash And Its Significance“ and various subsequent posts in the “Economic Depression” label]
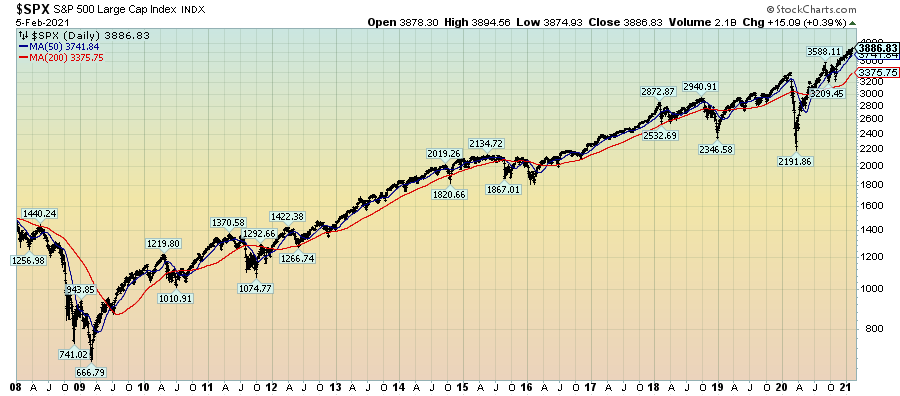
As reference, below is a daily chart since 2008 of the S&P500 (through February 5, 2021 with a last price of 3886.83), depicted on a LOG scale, indicating both the 50dma and 200dma as well as price labels:
(click on chart to enlarge image)(chart courtesy of StockCharts.com; chart creation and annotation by the author)
_____
The Special Note summarizes my overall thoughts about our economic situation
For reference purposes, below are five charts that display growth in payroll employment, as depicted by the Total Nonfarm Payroll measures (FRED data series PAYEMS).
PAYEMS, which is seasonally adjusted, is defined in Financial Reserve Economic Data [FRED] as:
All Employees: Total Nonfarm, commonly known as Total Nonfarm Payroll, is a measure of the number of U.S. workers in the economy that excludes proprietors, private household employees, unpaid volunteers, farm employees, and the unincorporated self-employed. This measure accounts for approximately 80 percent of the workers who contribute to Gross Domestic Product (GDP).
This measure provides useful insights into the current economic situation because it can represent the number of jobs added or lost in an economy. Increases in employment might indicate that businesses are hiring which might also suggest that businesses are growing. Additionally, those who are newly employed have increased their personal incomes, which means (all else constant) their disposable incomes have also increased, thus fostering further economic expansion.
Generally, the U.S. labor force and levels of employment and unemployment are subject to fluctuations due to seasonal changes in weather, major holidays, and the opening and closing of schools. The Bureau of Labor Statistics (BLS) adjusts the data to offset the seasonal effects to show non-seasonal changes: for example, women’s participation in the labor force; or a general decline in the number of employees, a possible indication of a downturn in the economy. To closely examine seasonal and non-seasonal changes, the BLS releases two monthly statistical measures: the seasonally adjusted All Employees: Total Nonfarm (PAYEMS) and All Employees: Total Nonfarm (PAYNSA), which is not seasonally adjusted.
The series comes from the ‘Current Employment Statistics (Establishment Survey).’
The source code is: CES0000000001
The first chart shows the monthly change in Total Nonfarm Payroll from the year 2000 through the current January 2021 report (January 2021 value of 49 (Thousands)):
(click on charts to enlarge images)
Data Source: FRED, Federal Reserve Economic Data, Federal Reserve Bank of St. Louis: All Employees: Total Nonfarm [PAYEMS] ; U.S. Department of Labor: Bureau of Labor Statistics; accessed February 5, 2021; https://fred.stlouisfed.org/series/PAYEMS
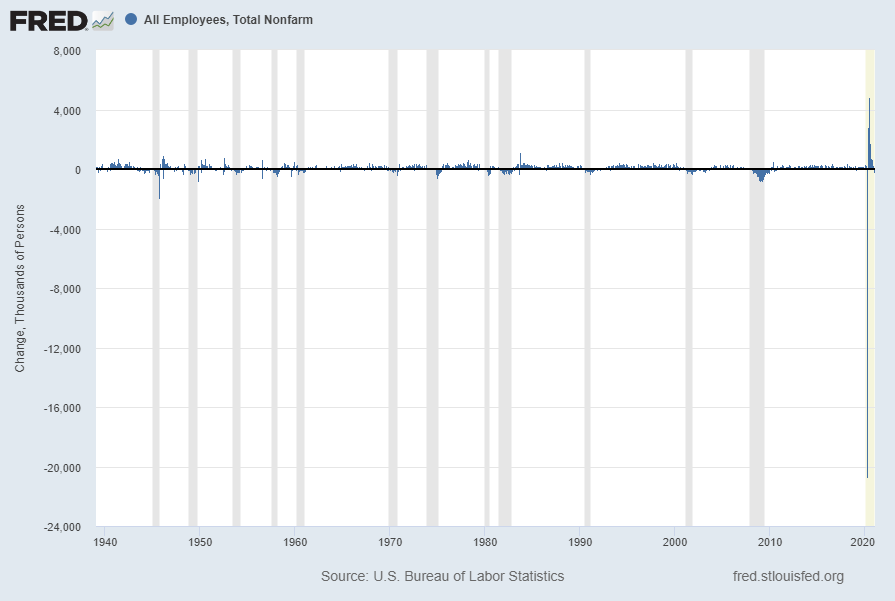
The second chart shows a longer-term chart of the same month-over-month change in Total Nonfarm Payroll (reports of February 1939 through the present report of January 2021):
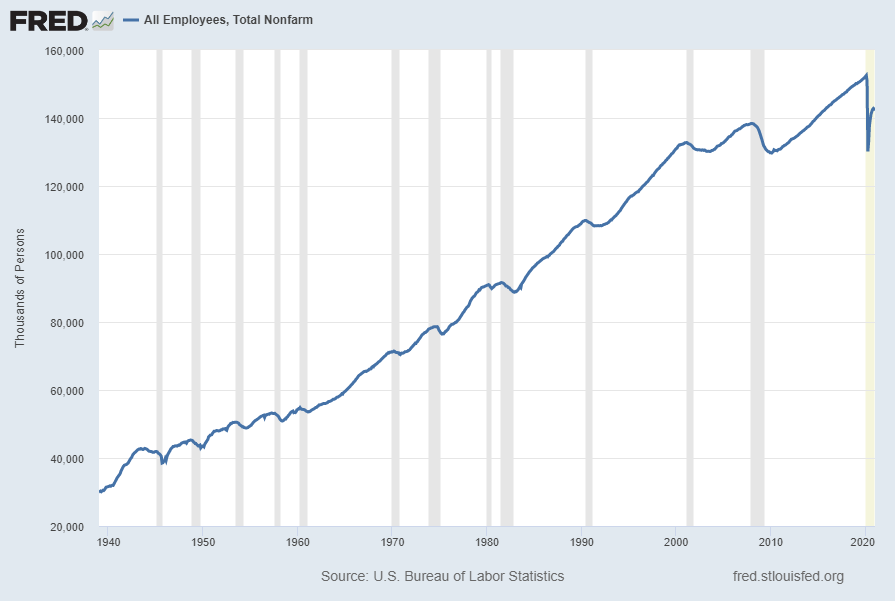
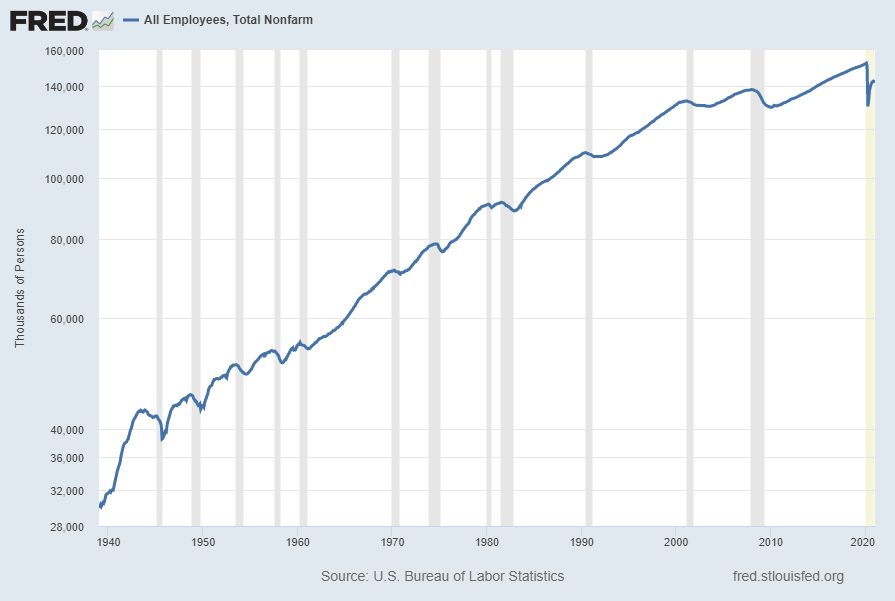
The third chart shows the aggregate number of Total Nonfarm Payroll, from the reports of January 1939 – January 2021 (January 2021 value of 142.631 million):
The fourth chart shows this same measure of aggregate number of Total Nonfarm Payroll as seen above but presented on a LOG scale:
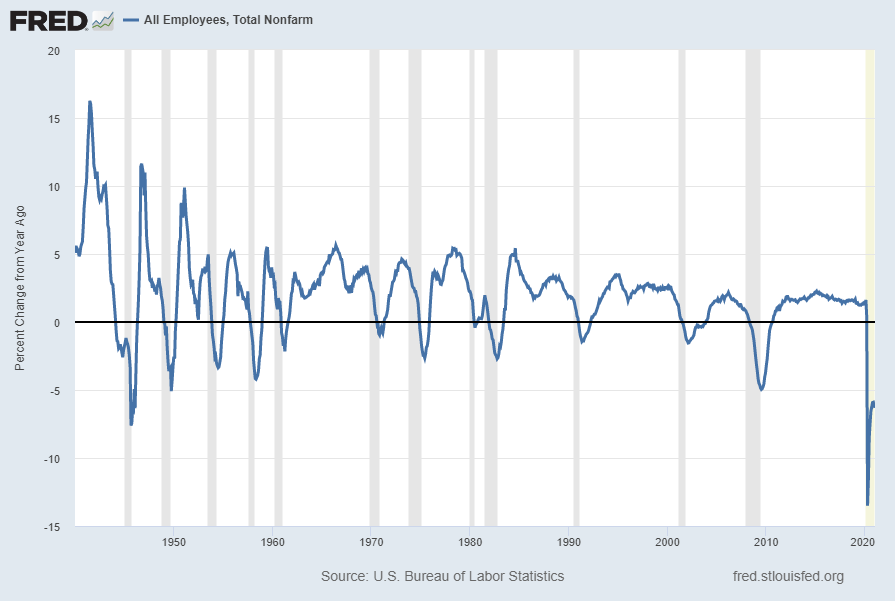
Lastly, the fifth chart shows the Total Nonfarm Payroll number on a “Percent Change from Year Ago” basis from January 1940 – January 2021: (January 2021 value of -6.3%)
_________
I post various indicators and indices because I believe they should be carefully monitored. However, as those familiar with this site are aware, I do not necessarily agree with what they depict or imply.
_____
The Special Note summarizes my overall thoughts about our economic situation


![Value of Manufacturers’ New Orders for Consumer Goods Industries [ACOGNO]](https://www.economicgreenfield.com/wp-content/uploads/2021/02/ACOGNO_2-4-21-209545.png)
![Value of Manufacturers’ New Orders for Consumer Goods Industries [ACOGNO] Percent Change From Year Ago](https://www.economicgreenfield.com/wp-content/uploads/2021/02/ACOGNO_2-4-21-209545-1.9-Percent-Change-From-Year-Ago.png)