As many are aware, Refinitiv publishes earnings estimates for the S&P500. (My other posts concerning S&P earnings estimates can be found under the S&P500 Earnings label)
The following estimates are from Exhibit 24 of the “S&P500 Earnings Scorecard” (pdf) of November 12, 2021, and represent an aggregation of individual S&P500 component “bottom up” analyst forecasts. For reference, the Year 2014 value is $118.78/share; the Year 2015 value is $117.46/share; the Year 2016 value is $118.10/share; the Year 2017 value is $132.00/share; the Year 2018 value is $161.93/share; the Year 2019 value is $162.93/share; and the Year 2020 value is $139.72/share:
Year 2021 estimate:
$205.72/share
Year 2022 estimate:
$221.35/share
Year 2023 estimate:
$241.10/share
_____
I post various economic forecasts because I believe they should be carefully monitored. However, as those familiar with this site are aware, I do not agree with many of the consensus estimates and much of the commentary in these forecast surveys.
_____
The Special Note summarizes my overall thoughts about our economic situation
The Philadelphia Fed 4th Quarter 2021 Survey of Professional Forecasters was released on November 15, 2021. This survey is somewhat unique in various regards, such as it incorporates a longer time frame for various measures.
The survey shows, among many measures, the following median expectations:
Real GDP: (annual average level)
full-year 2021: 5.5%
full-year 2022: 3.9%
full-year 2023: 2.6%
full-year 2024: 2.3%
Unemployment Rate: (annual average level)
for 2021: 5.4%
for 2022: 4.1%
for 2023: 3.6%
for 2024: 3.7%
–
Regarding the risk of a negative quarter in real GDP in any of the next few quarters, mean estimates are 9.1%, 13.3%, 15.0%, 15.9% and 16.9% for each of the quarters from Q4 2021 through Q4 2022, respectively.
As well, there are also a variety of time frames shown (present quarter through the year 2030) with the median expected inflation (annualized) of each. Inflation is measured in Headline and Core CPI and Headline and Core PCE. Over all time frames expectations are shown to be in the 2.2% to 5.8% range.
_____
I post various economic forecasts because I believe they should be carefully monitored. However, as those familiar with this site are aware, I do not agree with many of the consensus estimates and much of the commentary in these forecast surveys.
_____
The Special Note summarizes my overall thoughts about our economic situation
As many are aware, Standard & Poor’s publishes earnings estimates for the S&P500. (My posts concerning their estimates can be found under the S&P500 Earnings label)
For reference purposes, the most current estimates are reflected below, and are as of November 11, 2021:
Year 2021 estimates add to the following:
-From a “bottom up” perspective, operating earnings of $202.02/share
-From a “top down” perspective, operating earnings of N/A
-From a “bottom up” perspective, “as reported” earnings of $191.30/share
Year 2022 estimates add to the following:
-From a “bottom up” perspective, operating earnings of $218.95/share
-From a “top down” perspective, operating earnings of N/A
-From a “bottom up” perspective, “as reported” earnings of $205.26/share
_____
I post various economic forecasts because I believe they should be carefully monitored. However, as those familiar with this site are aware, I do not agree with many of the consensus estimates and much of the commentary in these forecast surveys.
_____
The Special Note summarizes my overall thoughts about our economic situation
For a variety of reasons, I am not as enamored with ECRI’s WLI and WLI Growth measures as many are.
However, I do think the measures are important and deserve close monitoring and scrutiny.
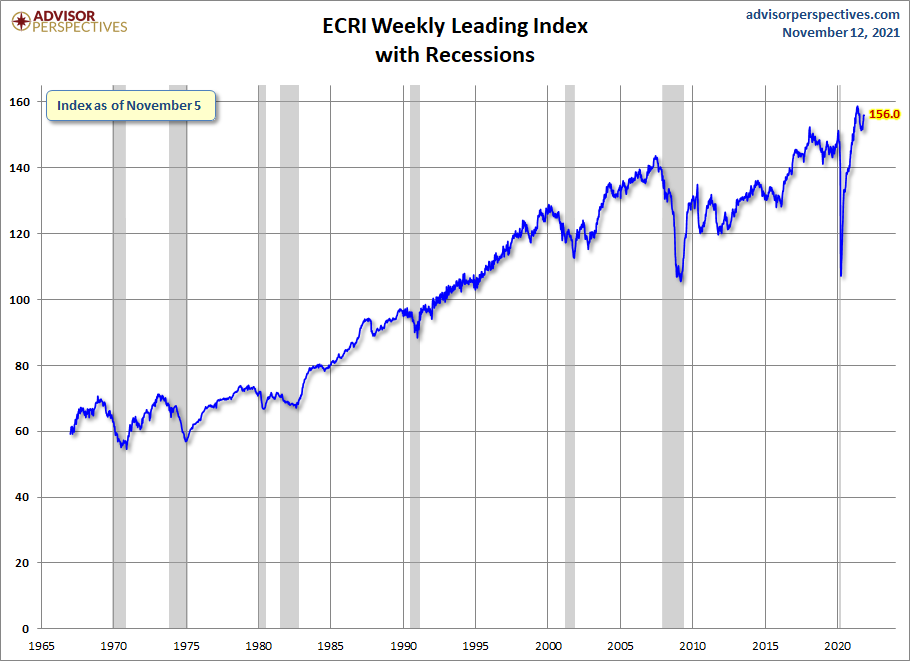
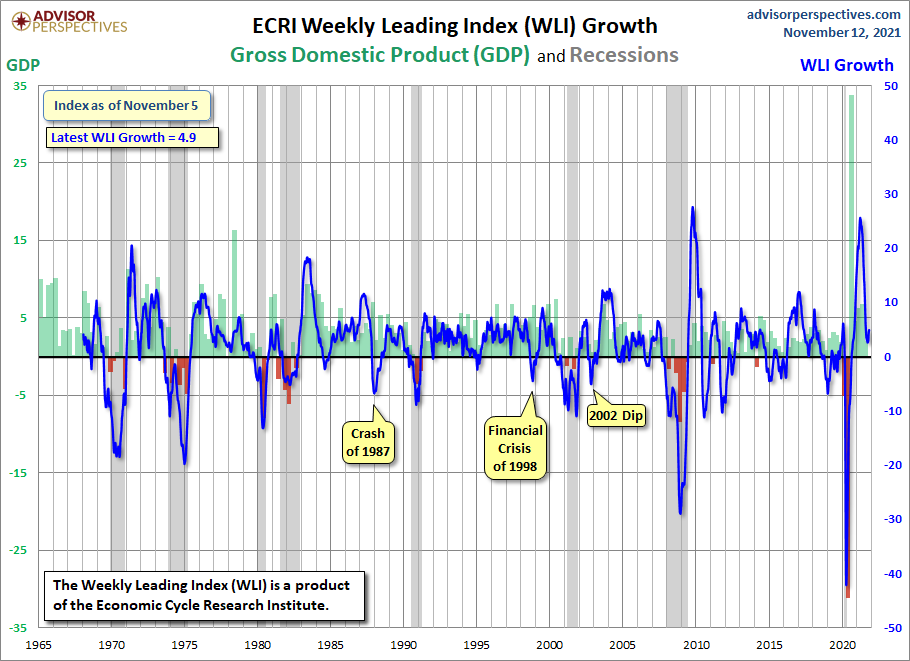
Below are three long-term charts, from Advisor Perspectives’ ECRI update post of November 12, 2021 titled “ECRI Weekly Leading Index Update.” These charts are on a weekly basis as of the November 12, 2021 release, reflecting data through November 5, 2021.
This next chart depicts, on a long-term basis, the Year-over-Year change in the 4-week moving average of the WLI:
–
This last chart depicts, on a long-term basis, the WLI, Gr.:
_________
I post various economic indicators and indices because I believe they should be carefully monitored. However, as those familiar with this site are aware, I do not necessarily agree with what they depict or imply.
_____
The Special Note summarizes my overall thoughts about our economic situation
Throughout this site there are many discussions of economic indicators. This post is the latest in a series of posts indicating facets of U.S. economic weakness or a notably low growth rate.
The level and trend of economic growth is especially notable at this time. As seen in various measures and near-term projections, the U.S. economy had undergone an outsized level of economic contraction in 2020. However, most people believe (and virtually all prominent economic forecasts indicate) that this historic level of contraction will prove ephemeral in nature; i.e. an economic expansion will continue.
As seen in the October 2021 Wall Street Journal Economic Forecast Survey the consensus (average estimate) among various economists is for 5.22% GDP growth in 2021, 3.59% GDP growth in 2022, 2.53% GDP growth in 2023, and 2.23% GDP growth in 2024.
Charts Indicating U.S. Economic Weakness
Below are a small sampling of charts that depict weak growth or contraction, and a brief comment for each:
The Chicago Fed National Activity Index (CFNAI)
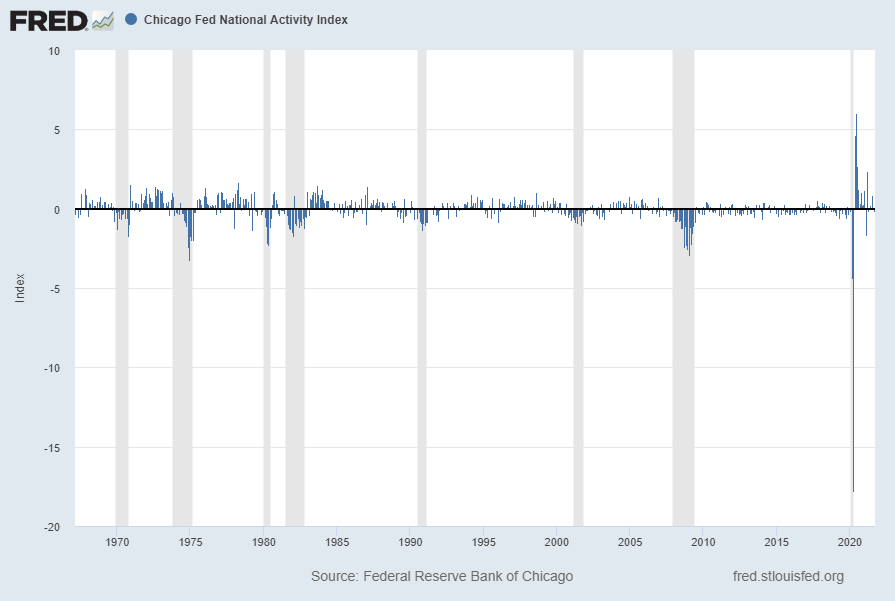
A broad-based economic indicator, the Chicago Fed National Activity Index (CFNAI), shows a negative value in its most current reading.
The October 2020 Chicago Fed National Activity Index (CFNAI) updated as of October 25, 2021:
The CFNAI, with current reading of -.13:
source: Federal Reserve Bank of Chicago, Chicago Fed National Activity Index [CFNAI], retrieved from FRED, Federal Reserve Bank of St. Louis; accessed October 25, 2021; https://fred.stlouisfed.org/series/CFNAI
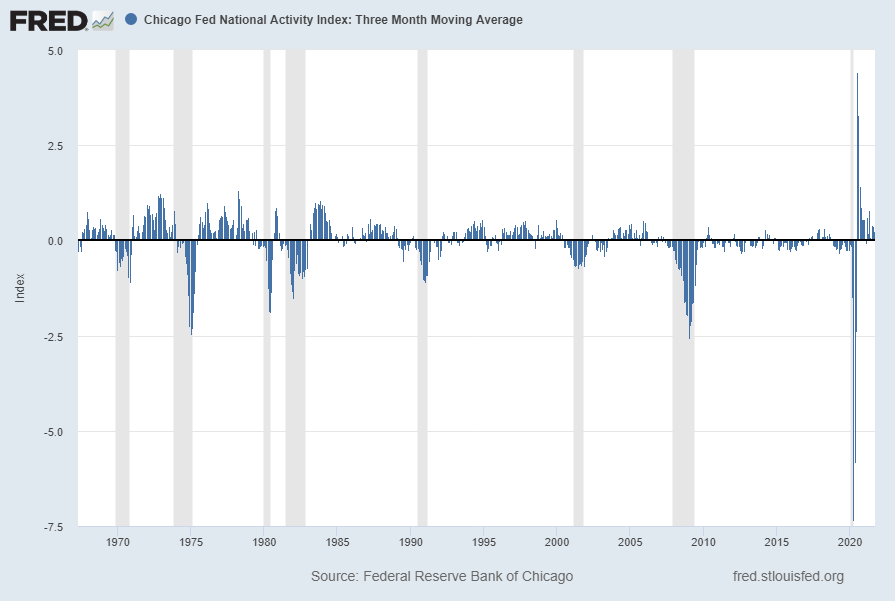
The CFNAI-MA3 (CFNAI 3-month moving average) while positive, is showing a declining trend with current reading of .25:
source: Federal Reserve Bank of Chicago, Chicago Fed National Activity Index: Three Month Moving Average [CFNAIMA3], retrieved from FRED, Federal Reserve Bank of St. Louis; : accessed October 25, 2021: https://fred.stlouisfed.org/series/CFNAIMA3
__
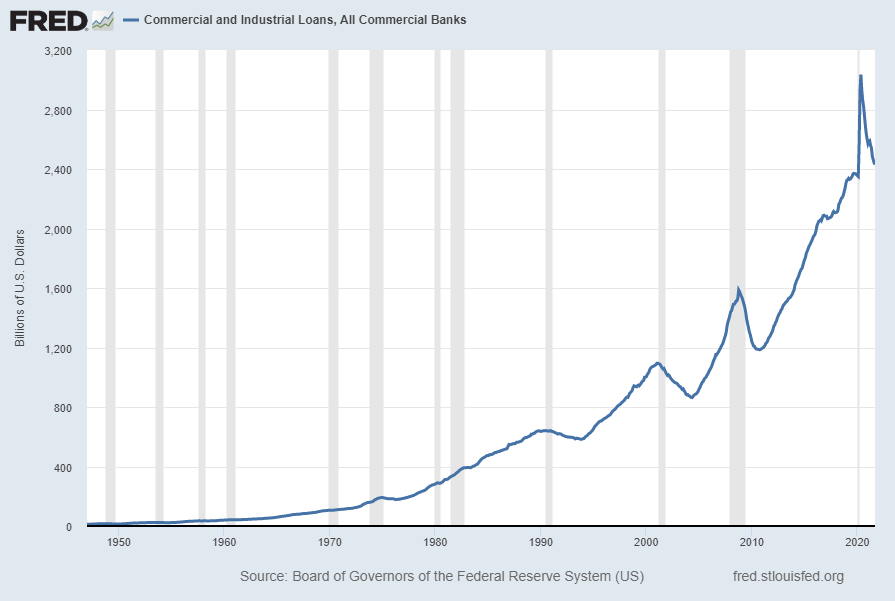
Commercial And Industrial Loans, All Commercial Banks (BUSLOANS)
“Commercial And Industrial Loans, All Commercial Banks” (BUSLOANS) has recently been declining. Shown below is this measure with last value of $2,430.2430 Billion through September 2021, last updated November 5, 2021:
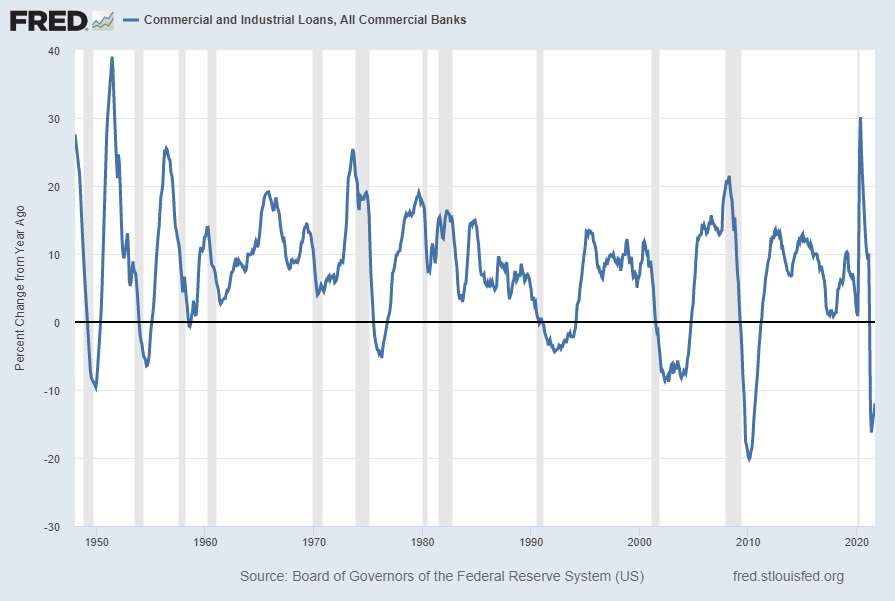
Below is this measure displayed on a “Percent Change From Year Ago” basis with value -12.0%:
source: Board of Governors of the Federal Reserve System (US), Commercial and Industrial Loans, All Commercial Banks [BUSLOANS], retrieved from FRED, Federal Reserve Bank of St. Louis; accessed November 11, 2021: https://fred.stlouisfed.org/series/BUSLOANS
__
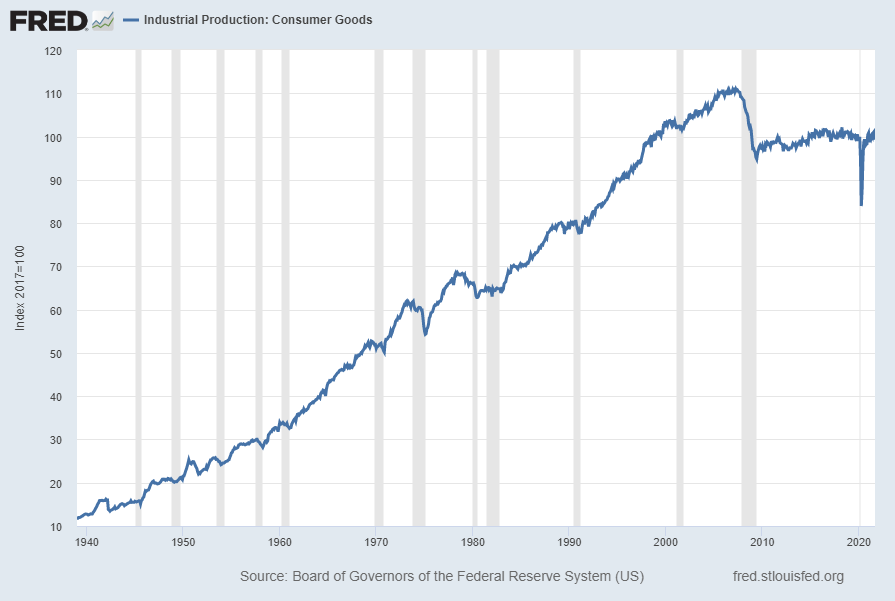
Industrial Production: Consumer Goods (IPCONGD)
The “Industrial Production: Consumer Goods” measure has been relatively subdued since the Financial Crisis. Shown below is a long-term chart of this measure (displayed from 1939), with last value of 99.2593 through September 2021, last updated October 18, 2021:
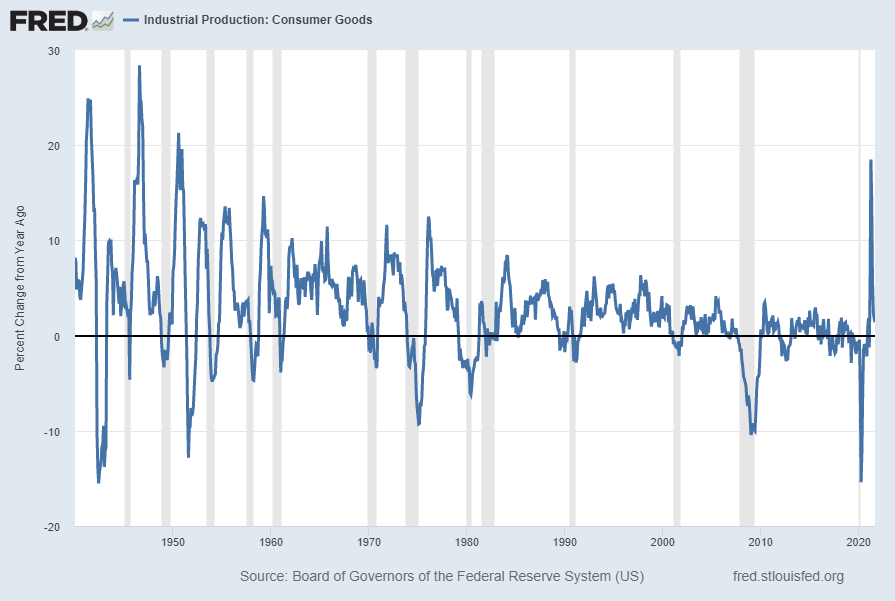
Displayed below is this same IPCONGD measure on a “Percent Change From Year Ago” basis, showing a continuing post-2020 rebound albeit with a declining growth trend. The current value is 1.4%:
source: Board of Governors of the Federal Reserve System (US), Industrial Production: Consumer Goods [IPCONGD], retrieved from FRED, Federal Reserve Bank of St. Louis; accessed November 11, 2021: https://fred.stlouisfed.org/series/IPCONGD
__
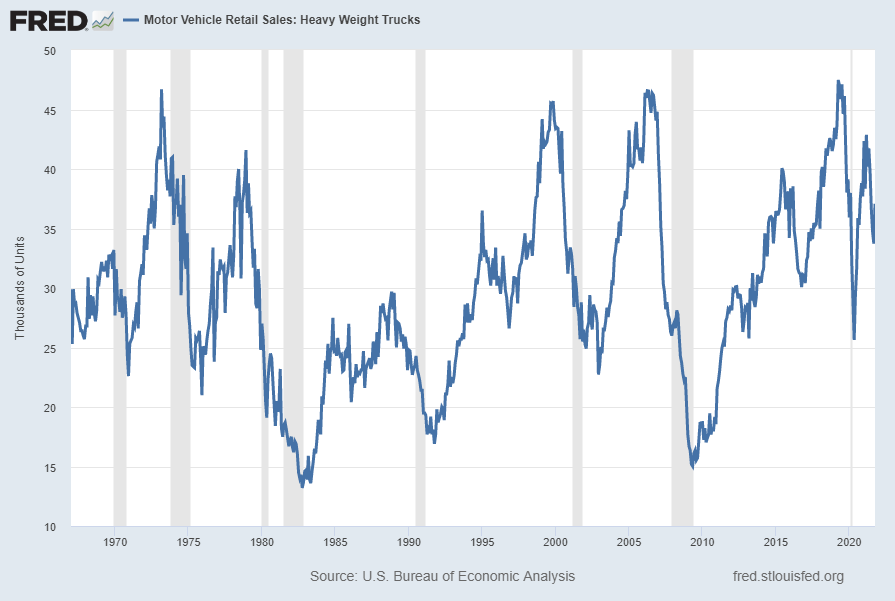
Motor Vehicle Retail Sales: Heavy Weight Trucks (HTRUCKSSA)
Sales of “Heavy Weight Trucks” (HTRUCKSSA) has recently been volatile. Shown below is this measure with last value of 37.078 Thousand through October 2021, last updated November 5, 2021:
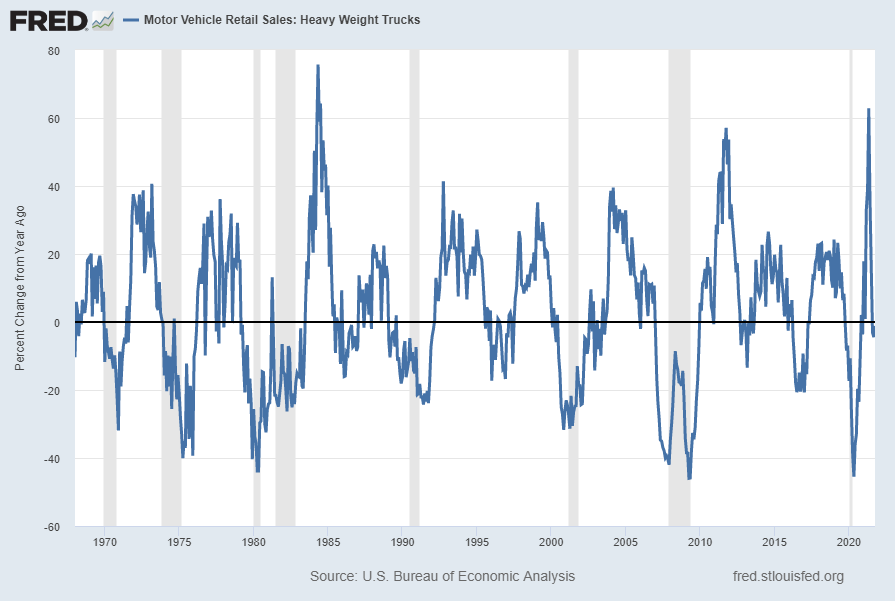
Below is this measure displayed on a “Percent Change From Year Ago” basis with value -1.2%:
source: U.S. Bureau of Economic Analysis, Motor Vehicle Retail Sales: Heavy Weight Trucks [HTRUCKSSA], retrieved from FRED, Federal Reserve Bank of St. Louis; accessed November 11, 2021: https://fred.stlouisfed.org/series/HTRUCKSSA
__
Other Indicators
As mentioned previously, many other indicators discussed on this site indicate economic weakness or economic contraction, if not outright (gravely) problematical economic conditions.
_____
The Special Note summarizes my overall thoughts about our economic situation
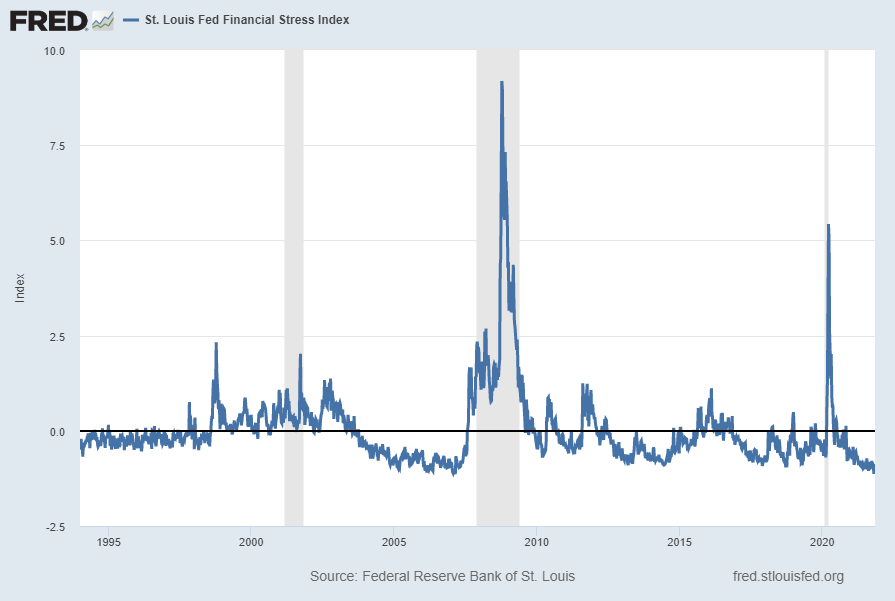
The St. Louis Fed’s Financial Stress Index (STLFSI2) is one index that is supposed to measure stress in the financial system. Its reading as of the November 11, 2021 update (reflecting data through November 5, 2021) is -.8724:
source: Federal Reserve Bank of St. Louis, St. Louis Fed Financial Stress Index [STLFSI2], retrieved from FRED, Federal Reserve Bank of St. Louis; accessed November 11, 2021: https://fred.stlouisfed.org/series/STLFSI2
Of course, there are a variety of other measures and indices that are supposed to measure financial stress and other related issues, both from the Federal Reserve as well as from private sources.
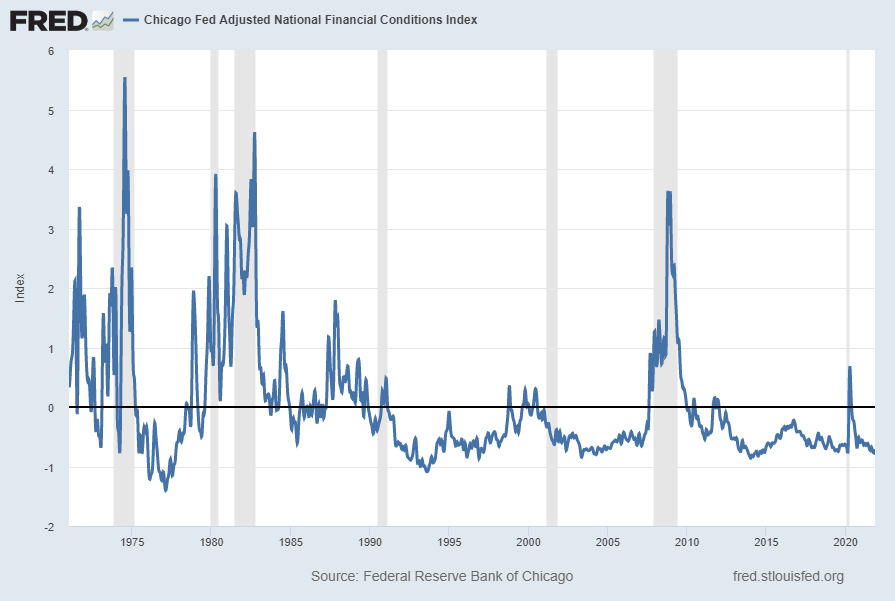
Two other indices that I regularly monitor include the Chicago Fed National Financial Conditions Index (NFCI) as well as the Chicago Fed Adjusted National Financial Conditions Index (ANFCI).
Here are summary descriptions of each, as seen in FRED:
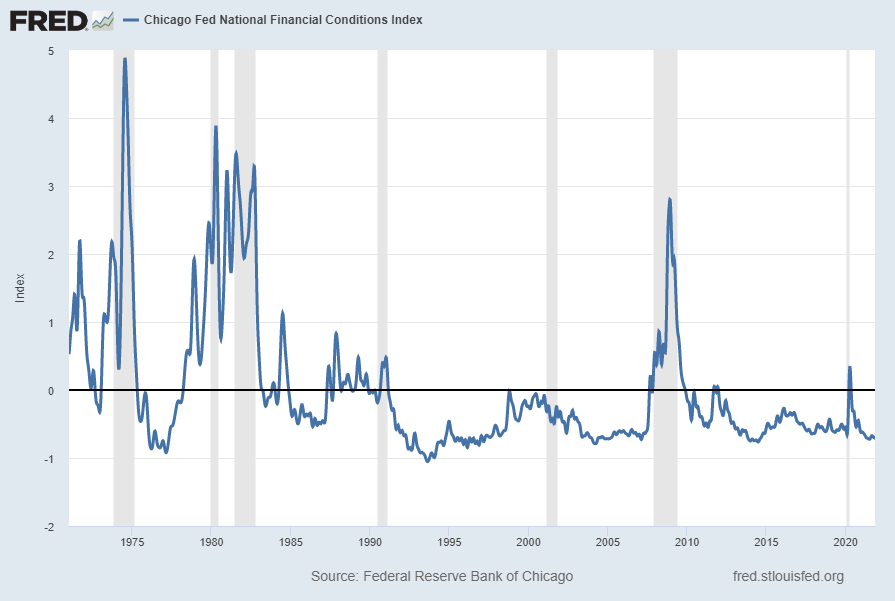
The National Financial Conditions Index (NFCI) measures risk, liquidity and leverage in money markets and debt and equity markets as well as in the traditional and “shadow” banking systems. Positive values of the NFCI indicate financial conditions that are tighter than average, while negative values indicate financial conditions that are looser than average.
The adjusted NFCI (ANFCI). This index isolates a component of financial conditions uncorrelated with economic conditions to provide an update on how financial conditions compare with current economic conditions.
For further information, please visit the Federal Reserve Bank of Chicago’s web site:
Below are the most recently updated charts of the NFCI and ANFCI, respectively.
The NFCI chart below was last updated on November 10, 2021 incorporating data from January 8, 1971 through November 5, 2021, on a weekly basis. The November 5 value is -.67611:
The ANFCI chart below was last updated on November 10, 2021 incorporating data from January 8, 1971 through November 5, 2021, on a weekly basis. The November 5, 2021 value is -.71088:
I post various indicators and indices because I believe they should be carefully monitored. However, as those familiar with this site are aware, I do not necessarily agree with what they depict or imply.
_____
The Special Note summarizes my overall thoughts about our economic situation
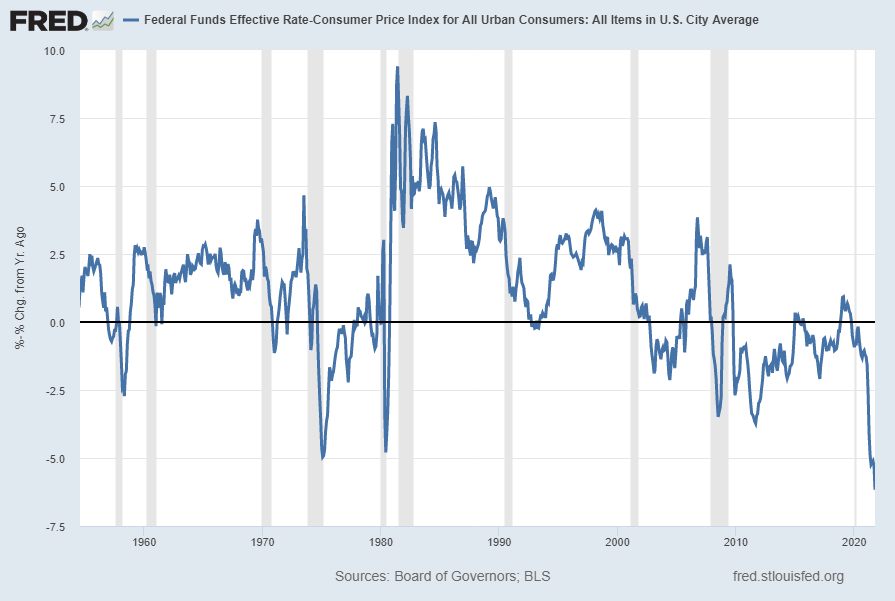
On January 9, 2017 I wrote a post titled “Low Interest Rates And The Formation Of Asset Bubbles.“ As discussed in that post – and for other reasons – the level of the Fed Funds rate – and whether its level is appropriate – has vast importance and far-reaching consequences with regard to many aspects of the economy and financial system.
Along these lines, below is an updated long-term chart indicating the Real Fed Funds Rate [FRED FEDFUNDS – CPIAUCSL] , with a last value of -6.16352 through October 2021. Of particular note is the post-2000 persistently negative Real Fed Funds rate:
source: Board of Governors of the Federal Reserve System (US), Effective Federal Funds Rate [FEDFUNDS], retrieved from FRED, Federal Reserve Bank of St. Louis; accessed November 10, 2021: https://fred.stlouisfed.org/series/FEDFUNDS
source: U.S. Bureau of Labor Statistics, Consumer Price Index: All Items in U.S. City Average, All Urban Consumers [CPIAUCSL], retrieved from FRED, Federal Reserve Bank of St. Louis; accessed November 10, 2021: https://fred.stlouisfed.org/series/CPIAUCSL
_____
The Special Note summarizes my overall thoughts about our economic situation
My overall analysis indicates a continuing elevated and growing level of financial danger which contains many worldwide and U.S.-specific “stresses” of a very complex nature. I have written numerous posts on this site concerning both ongoing and recent “negative developments.” These developments, as well as other exceedingly problematical conditions, have presented a highly perilous economic environment that endangers the overall financial system.
Also of ongoing immense importance is the existence of various immensely large asset bubbles, a subject of which I have extensively written. While all of these asset bubbles are wildly pernicious and will have profound adverse future implications, hazards presented by the bond market bubble are especially notable.
Predicting the specific timing and extent of a stock market crash is always difficult, and the immense complexity of today’s economic situation makes such a prediction even more challenging. With that being said, my analyses continue to indicate that a near-term exceedingly large (from an ultra long-term perspective) stock market crash – that would also involve (as seen in 2008) various other markets – will occur. [note: the “next crash” and its aftermath has paramount significance and implications, as discussed in the post of January 6, 2012 titled “The Next Crash And Its Significance“ and various subsequent posts in the “Economic Depression” label]
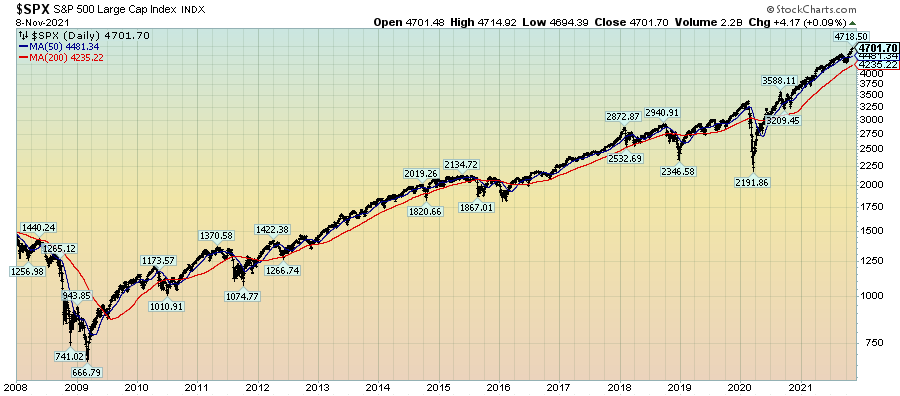
As reference, below is a daily chart since 2008 of the S&P500 (through November 8, 2021 with a last price of 4701.70), depicted on a LOG scale, indicating both the 50dma and 200dma as well as price labels:
(click on chart to enlarge image)(chart courtesy of StockCharts.com; chart creation and annotation by the author)
_____
The Special Note summarizes my overall thoughts about our economic situation