As many are aware, Refinitiv publishes earnings estimates for the S&P500. (My other posts concerning S&P earnings estimates can be found under the S&P500 Earnings label)
The following estimates are from Exhibit 24 of the “S&P500 Earnings Scorecard” (pdf) of October 13, 2023, and represent an aggregation of individual S&P500 component “bottom up” analyst forecasts. For reference, the Year 2014 value is $118.78/share; the Year 2015 value is $117.46/share; the Year 2016 value is $118.10/share; the Year 2017 value is $132.00/share; the Year 2018 value is $161.93/share; the Year 2019 value is $162.93/share; the Year 2020 value is $139.72/share; the year 2021 value is $208.12/share; and the year 2022 value is $218.09/share:
Year 2023 estimate:
$220.46/share
Year 2024 estimate:
$246.96/share
Year 2025 estimate:
$276.82/share
_____
I post various economic forecasts because I believe they should be carefully monitored. However, as those familiar with this site are aware, I do not agree with many of the consensus estimates and much of the commentary in these forecast surveys.
_____
The Special Note summarizes my overall thoughts about our economic situation
As many are aware, Standard & Poor’s publishes earnings estimates for the S&P500. (My posts concerning their estimates can be found under the S&P500 Earnings label)
For reference purposes, the most current estimates are reflected below, and are as of October 11, 2023:
Year 2023 estimates add to the following:
-From a “bottom up” perspective, operating earnings of $219.55/share
-From a “bottom up” perspective, “as reported” earnings of $201.65/share
Year 2024 estimates add to the following:
-From a “bottom up” perspective, operating earnings of $244.79/share
-From a “bottom up” perspective, “as reported” earnings of $229.86/share
_____
I post various economic forecasts because I believe they should be carefully monitored. However, as those familiar with this site are aware, I do not agree with many of the consensus estimates and much of the commentary in these forecast surveys.
_____
The Special Note summarizes my overall thoughts about our economic situation
The following is the latest update of 10 charts that depict various aspects of the U.S. economic and financial situation.
I find these charts portray disturbing long-term trends. These trends have been in effect for years.
These charts raise a lot of questions. As well, they highlight the “atypical” nature of our economic situation from a long-term historical perspective.
All of these charts are from the Federal Reserve, and represent the most recently updated data.
(click on charts to enlarge images)
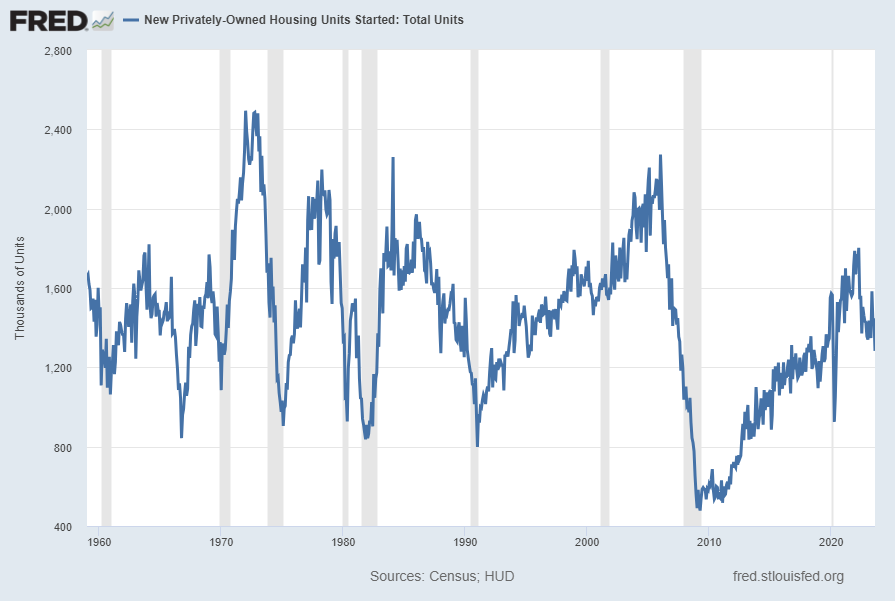
Housing starts (last update September 19, 2023):
U.S. Bureau of the Census, Housing Starts: Total: New Privately Owned Housing Units Started [HOUST], retrieved from FRED, Federal Reserve Bank of St. Louis https://research.stlouisfed.org/fred2/series/HOUST/, October 15, 2023.
–
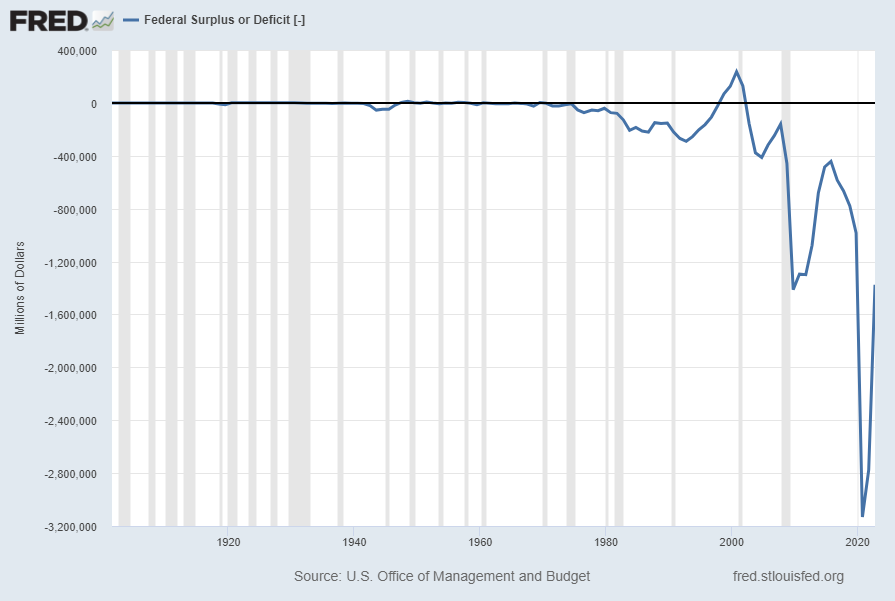
The Federal Deficit (last updated March 15, 2023):
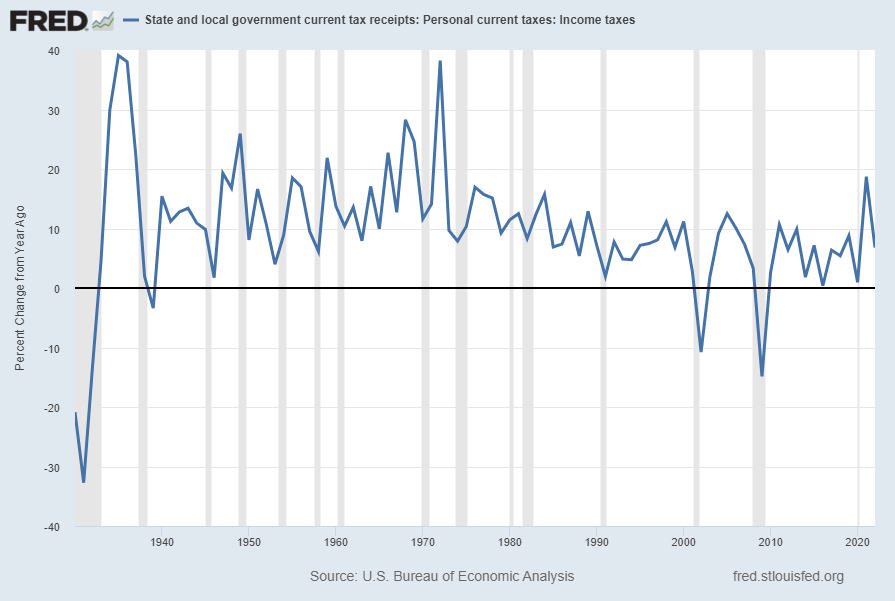
State & Local Personal Income Tax Receipts (% Change from Year Ago)(last updated September 28, 2023):
U.S. Bureau of Economic Analysis, State and local government current tax receipts: Personal current taxes: Income taxes [ASLPITAX], retrieved from FRED, Federal Reserve Bank of St. Louis https://research.stlouisfed.org/fred2/series/ASLPITAX/, October 15, 2023.
–
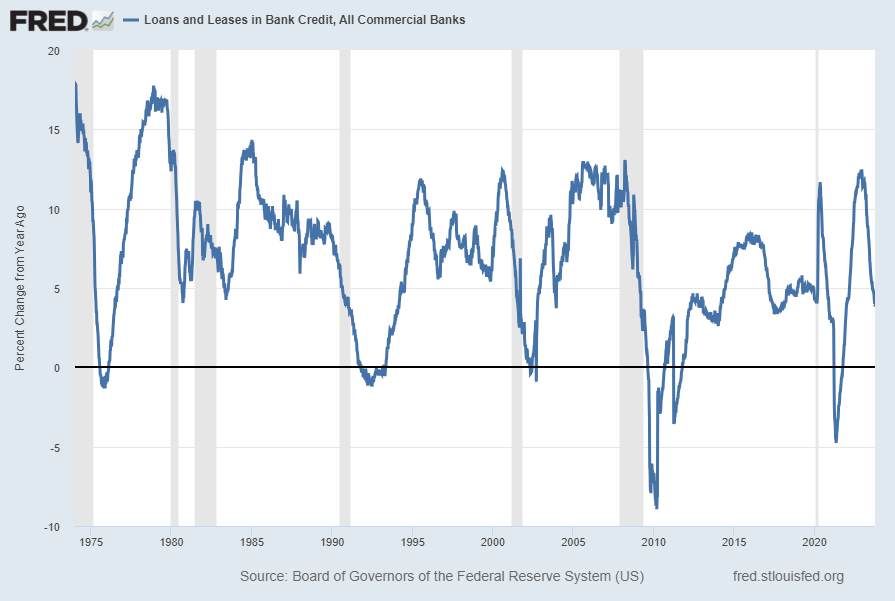
Total Loans and Leases of Commercial Banks (% Change from Year Ago)(last updated October 13, 2023):
Board of Governors of the Federal Reserve System (US), Loans and Leases in Bank Credit, All Commercial Banks [TOTLL], retrieved from FRED, Federal Reserve Bank of St. Louis https://research.stlouisfed.org/fred2/series/TOTLL/, October 15, 2023.
–
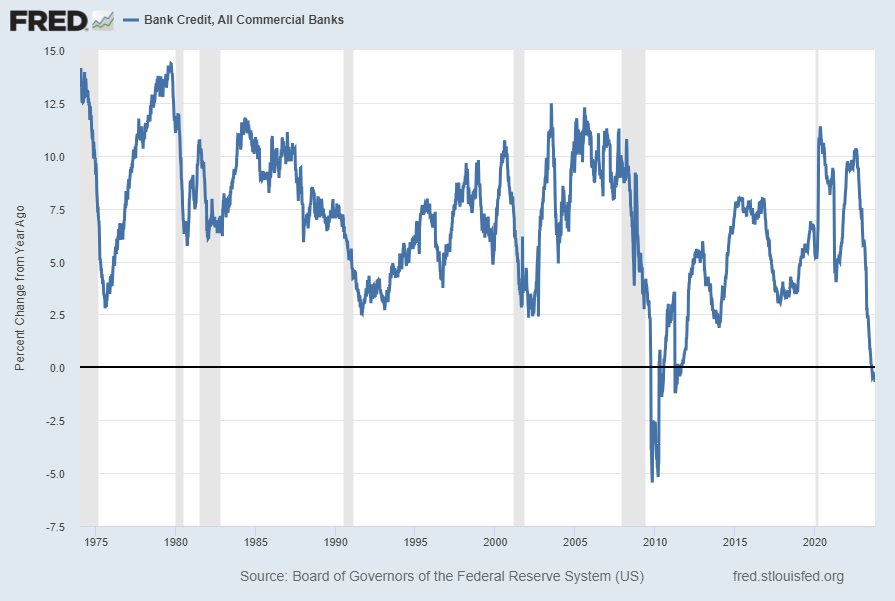
Bank Credit – All Commercial Banks (% Change from Year Ago)(last updated October 13, 2023):
Board of Governors of the Federal Reserve System (US), Bank Credit of All Commercial Banks [TOTBKCR], retrieved from FRED, Federal Reserve Bank of St. Louis https://research.stlouisfed.org/fred2/series/TOTBKCR/, October 15, 2023.
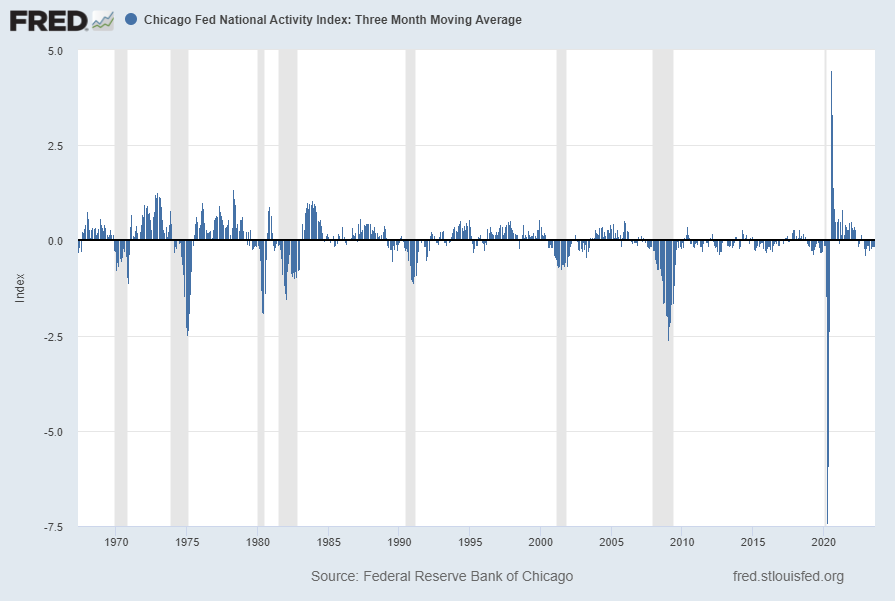
The Chicago Fed National Activity Index Three Month Moving Average (CFNAI-MA3)(last updated September 25, 2023):
Federal Reserve Bank of Chicago, Chicago Fed National Activity Index: Three Month Moving Average [CFNAIMA3], retrieved from FRED, Federal Reserve Bank of St. Louis https://research.stlouisfed.org/fred2/series/CFNAIMA3/, October 15, 2023.
–
I will continue to update these charts on an intermittent basis as they deserve close monitoring…
_____
The Special Note summarizes my overall thoughts about our economic situation
The October 2023 Wall Street Journal Economic Forecast Survey was published on October 15, 2023. The headline is “A Recession Is No Longer The Consensus.”
I found numerous items to be notable – although I don’t necessarily agree with them – both within the article and in the forecasts section.
An excerpt:
Economists are turning optimistic on the U.S. economy. They now think it will skirt a recession, the Federal Reserve is done raising interest rates and inflation will continue to ease.
As seen in the “Recession Probability” section, the average response as to whether the economy will be in a recession within the next 12 months was 48%. The individual estimates, of those who responded, ranged from 1% to 98%. For reference, the average response in July’s survey [the previously published survey] was 54%.
As stated in the article, the survey’s 65 respondents were academic, financial and business economists. The survey was conducted October 6 – October 11. Not every economist answered every question.
–
Economic Forecasts
The current average forecasts among economists polled include the following:
GDP:
full-year 2023: 2.18%
full-year 2024: .98%
full-year 2025: 2.12%
full-year 2026: 1.99%
Unemployment Rate:
December 2023: 3.90%
December 2024: 4.41%
December 2025: 4.17%
December 2026: 4.02%
10-Year Treasury Yield:
December 2023: 4.47%
December 2024: 3.94%
December 2025: 3.81%
December 2026: 3.72%
CPI:
December 2023: 3.39%
December 2024: 2.41%
December 2025: 2.24%
December 2026: 2.27%
Core PCE:
full-year 2023: 3.54%
full-year 2024: 2.46%
full-year 2025: 2.18%
full-year 2026: 2.16%
(note: I have highlighted this WSJ Economic Forecast survey each time it is published; it was published monthly until April 2021, after which the survey is conducted (at least) every three months; commentary on past surveys can be found under the “Economic Forecasts” label)
_____
I post various economic forecasts because I believe they should be carefully monitored. However, as those familiar with this site are aware, I do not necessarily agree with many of the consensus estimates and much of the commentary in these forecast surveys.
_____
The Special Note summarizes my overall thoughts about our economic situation
The St. Louis Fed’s Financial Stress Index (STLFSI4) is one index that is supposed to measure stress in the financial system. Its reading as of the October 12, 2023 update (reflecting data through October 6, 2023) is -.4893:
source: Federal Reserve Bank of St. Louis, St. Louis Fed Financial Stress Index [STLFSI4], retrieved from FRED, Federal Reserve Bank of St. Louis; accessed October 12, 2023: https://fred.stlouisfed.org/series/STLFSI4
Of course, there are a variety of other measures and indices that are supposed to measure financial stress and other related issues, both from the Federal Reserve as well as from private sources.
Two other indices that I regularly monitor include the Chicago Fed National Financial Conditions Index (NFCI) as well as the Chicago Fed Adjusted National Financial Conditions Index (ANFCI).
Here are summary descriptions of each, as seen in FRED:
The National Financial Conditions Index (NFCI) measures risk, liquidity and leverage in money markets and debt and equity markets as well as in the traditional and “shadow” banking systems. Positive values of the NFCI indicate financial conditions that are tighter than average, while negative values indicate financial conditions that are looser than average.
The adjusted NFCI (ANFCI). This index isolates a component of financial conditions uncorrelated with economic conditions to provide an update on how financial conditions compare with current economic conditions.
For further information, please visit the Federal Reserve Bank of Chicago’s web site:
Below are the most recently updated charts of the NFCI and ANFCI, respectively.
The NFCI chart below was last updated on October 12, 2023 incorporating data from January 8, 1971 through October 6, 2023 on a weekly basis. The October 6 value is -.37525:
The ANFCI chart below was last updated on October 12, 2023 incorporating data from January 8, 1971 through October 6, 2023, on a weekly basis. The October 6, 2023 value is -.32901:
I post various indicators and indices because I believe they should be carefully monitored. However, as those familiar with this site are aware, I do not necessarily agree with what they depict or imply.
_____
The Special Note summarizes my overall thoughts about our economic situation
My overall analysis indicates a continuing elevated and growing level of financial danger which contains many worldwide and U.S.-specific “stresses” of a very complex nature. I have written numerous posts on this site concerning both ongoing and recent “negative developments.” These developments, as well as other exceedingly problematical conditions, have presented a highly perilous economic environment that endangers the overall financial system.
Also of ongoing immense importance is the existence of various immensely large asset bubbles, a subject of which I have extensively written. While all of these asset bubbles are wildly pernicious and will have profound adverse future implications, hazards presented by the bond market bubble are especially notable.
Predicting the specific timing and extent of a stock market crash is always difficult, and the immense complexity of today’s economic situation makes such a prediction even more challenging. With that being said, my analyses continue to indicate that a near-term exceedingly large (from an ultra long-term perspective) stock market crash – that would also involve (as seen in 2008) various other markets – will occur. [note: the “next crash” and its aftermath has paramount significance and implications, as discussed in the post of January 6, 2012 titled “The Next Crash And Its Significance“ and various subsequent posts in the “Economic Depression” label]
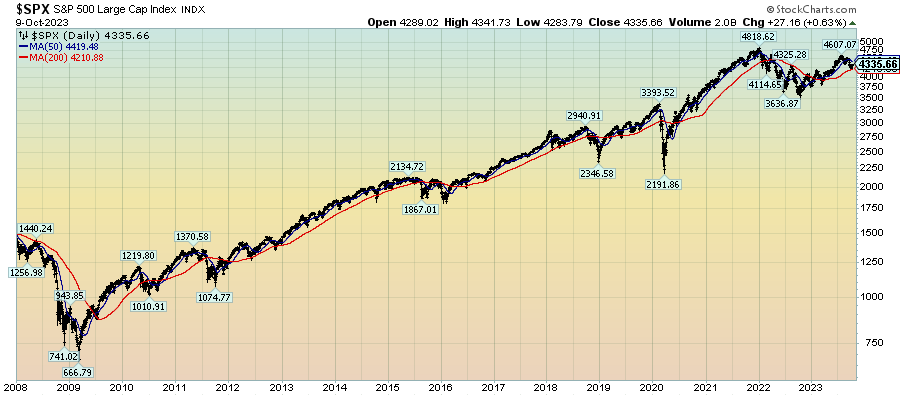
As reference, below is a daily chart since 2008 of the S&P500 (through October 9, 2023 with a last price of 4335.66), depicted on a LOG scale, indicating both the 50dma and 200dma as well as price labels:
(click on chart to enlarge image)(chart courtesy of StockCharts.com; chart creation and annotation by the author)
_____
The Special Note summarizes my overall thoughts about our economic situation
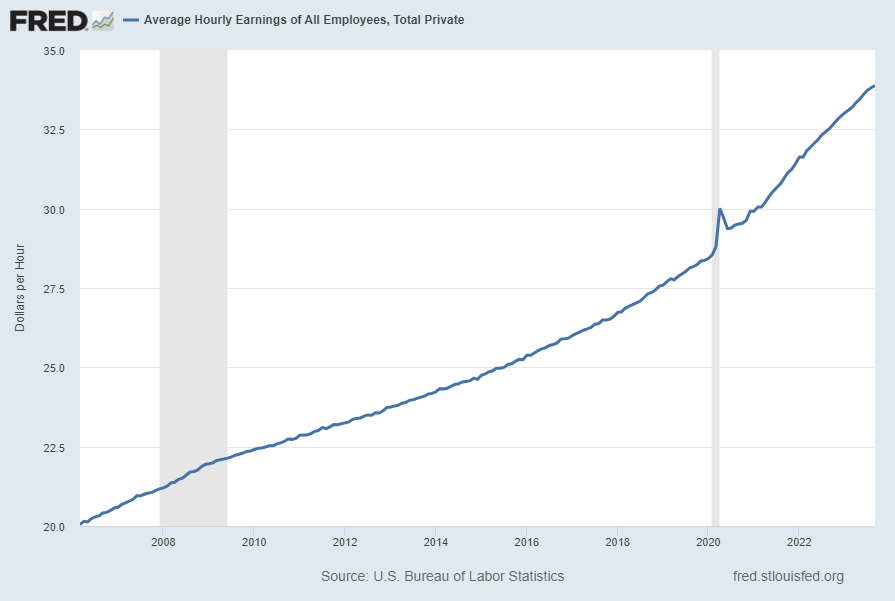
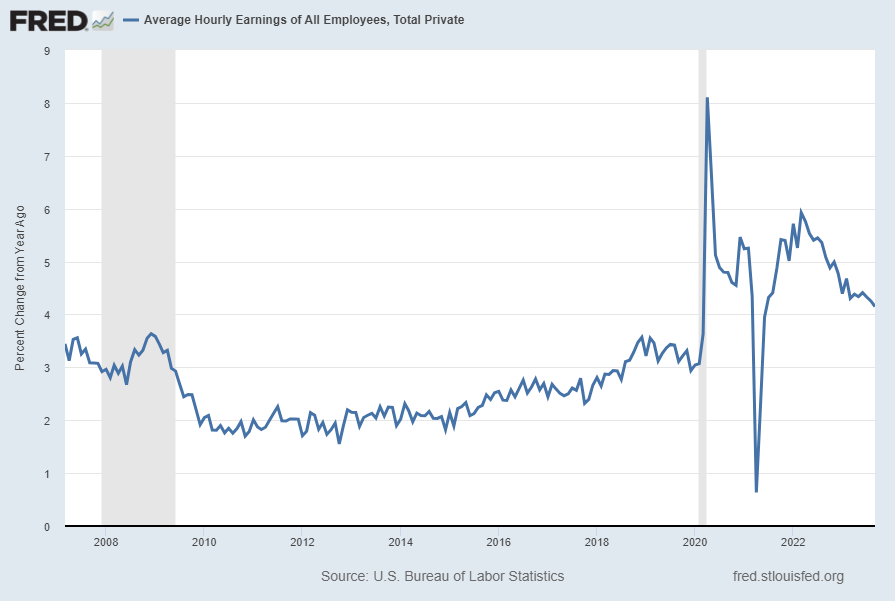
Along these lines, one of the measures showing disconcerting trends is that of hourly earnings.
While the concept of hourly earnings can be defined and measured in a variety of ways, below are a few charts that I believe broadly illustrate problematic trends.
The first chart depicts Average Hourly Earnings Of All Employees: Total Private (FRED series CES0500000003)(current value = $33.88):
(click on chart to enlarge image)(chart last updated 10-6-23)
Data Source: FRED, Federal Reserve Economic Data, Federal Reserve Bank of St. Louis: Average Hourly Earnings of All Employees: Total Private [CES0500000003] ; U.S. Department of Labor: Bureau of Labor Statistics; accessed October 6, 2023: http://research.stlouisfed.org/fred2/series/CES0500000003
–
This next chart depicts this same measure on a “Percentage Change From A Year Ago” basis. While not totally surprising, I find the decline from 2009 and subsequent trend to be disconcerting:
(click on chart to enlarge image)(chart last updated 10-6-23)
–
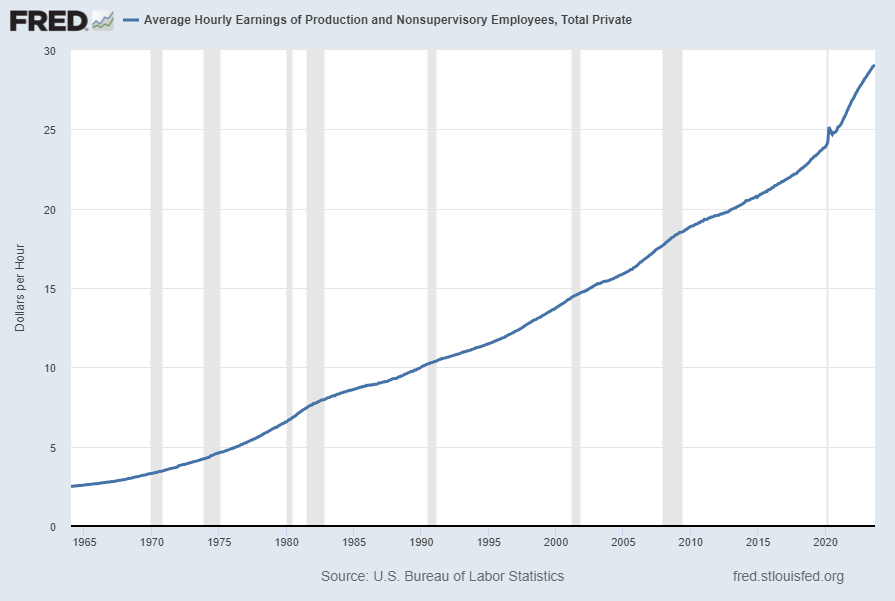
There are slightly different measures available from a longer-term perspective. Pictured below is another measure, the Average Hourly Earnings of Production and Nonsupervisory Employees – Total Private (FRED series AHETPI)(current value = $29.06):
(click on chart to enlarge image)(chart last updated 10-6-23)
Data Source: FRED, Federal Reserve Economic Data, Federal Reserve Bank of St. Louis: Average Hourly Earnings of Production and Nonsupervisory Employees: Total Private [AHETPI] ; U.S. Department of Labor: Bureau of Labor Statistics; accessed October 6, 2023: http://research.stlouisfed.org/fred2/series/AHETPI
–
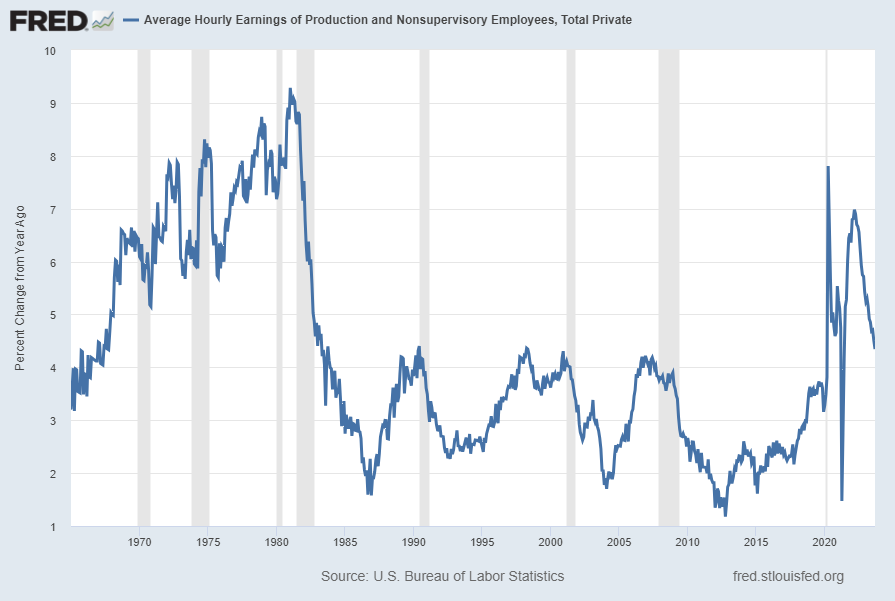
Pictured below is this AHETPI measure on a “Percentage Change From A Year Ago” basis. While not totally surprising, I find the decline from 2009 and subsequent trend to be disconcerting:
(click on chart to enlarge image)(chart last updated 10-6-23)
I will continue to actively monitor these trends, especially given the post-2009 dynamics.
_________
I post various economic indicators and indices because I believe they should be carefully monitored. However, as those familiar with this site are aware, I do not necessarily agree with what they depict or imply.
_____
The Special Note summarizes my overall thoughts about our economic situation